Testing the D
/
H ratio of alkenones and palmitic acid as salinity
proxies in the Amazon Plume
C. Häggi1, C. M. Chiessi2, and E. Schefuß1
1MARUM – Center for Marine Environmental Sciences, University of Bremen, Bremen, Germany 2School of Arts, Sciences and Humanities, University of São Paulo, São Paulo, Brazil
Correspondence to: C. Häggi (chaeggi@marum.de)
Received: 26 June 2015 – Published in Biogeosciences Discuss.: 26 August 2015
Revised: 12 November 2015 – Accepted: 21 November 2015 – Published: 10 December 2015
Abstract. The stable hydrogen isotope composition of lipid biomarkers, such as alkenones, is a promising new tool for the improvement of palaeosalinity reconstructions. Lab-oratory studies confirmed the correlation between lipid biomarkerδD composition (δDLipid), waterδD composition
(δDH2O)and salinity; yet there is limited insight into the ap-plicability of this proxy in oceanic environments. To fill this gap, we test the use of the δD composition of alkenones (δDC37) and palmitic acid (δDPA) as salinity proxies us-ing samples of surface suspended material along the distinct salinity gradient induced by the Amazon Plume. Our results indicate a positive correlation between salinity and δDH2O, while the relationship between δDH2O andδDLipid is more complex: δDPA correlates strongly withδDH2O (r
2=0.81)
and shows a salinity-dependent isotopic fractionation factor. δDC37only correlates withδDH2Oin a small number (n=8) of samples with alkenone concentrations > 10 ng L−1, while there is no correlation if all samples are taken into account. These findings are mirrored by alkenone-based temperature reconstructions, which are inaccurate for samples with low alkenone concentrations. Deviations in δDC37 and temper-ature are likely to be caused by limited haptophyte algae growth due to low salinity and light limitation imposed by the Amazon Plume. Our study confirms the applicability of δDLipidas a salinity proxy in oceanic environments. But
it raises a note of caution concerning regions where low alkenone production can be expected due to low salinity and light limitation, for instance, under strong riverine discharge.
1 Introduction
The precise reconstruction of past ocean salinity is still a pending issue in palaeoclimatology (Rohling, 2007). Un-til recently, most palaeosalinity studies have relied on foraminifera-based reconstructions of the stable oxygen iso-tope composition of seawater, which correlates with salinity (Epstein and Mayeda, 1953). However, temperature also con-trols the oxygen isotope composition of foraminifera, mak-ing corrections in the estimation of palaeosalinity necessary (Lea et al., 2000; Rostek et al., 1993). The imprecision as-sociated with this approach has led to the search for alterna-tive salinity proxies. The use of the hydrogen isotopic com-position of algal lipids (δDLipid) for the reconstruction of
the stable hydrogen composition of water (δDH2O) is one such recent development (Sessions et al., 1999; Schouten et al., 2006). As outlined in a theoretical framework by Rohling (2007), this method has the potential to lead to more precise reconstructions of surface water salinity in combina-tion with foraminifera-basedδ18O.
So far, efforts to apply δDLipid as a salinity proxy have
mainly involved the use of long-chain alkenones. Long-chain alkenones have the advantage of being exclusively produced by specific haptophyte algae, and of showing good preserva-tion over geologic timescales (Marlowe et al., 1984, 1990). Laboratory studies have confirmed the correlation of the D/H ratio of the C37alkenones (δDC37)withδDH2O (Engle-brecht and Sachs, 2005; Schouten et al., 2006). Furthermore, the D/H fractionation factor between alkenones and water (αC37),
αC37=
δDC37+1000 δDH2O+1000
was found to be salinity-dependent, leading to a poten-tially twofold way of reconstructing salinity (Schouten et al., 2006). There are, however, potential factors that may com-promise the use ofδDC37andαC37as salinity proxies. Indeed αC37is, for instance, inconsistent among different haptophyte algae species. Species preferring shelf environments have a higher αC37 than species favouring open marine habitats (M’Boule et al., 2014). In some situations αC37 has shown a small temperature dependency (Zhang and Sachs, 2007). Furthermore, αC37 is also dependent on algal growth phase and rate (Schouten et al., 2006; Wolhowe et al., 2009; Chivall et al., 2014b). All these factors potentially exceed the effects of salinity and may impede the use ofδDC37as a palaeosalin-ity proxy. Nevertheless, palaeoclimate studies have made successful use of δDC37 as a palaeosalinity proxy (van der Meer et al., 2007, 2008; Giosan et al., 2012; Schmidt et al., 2014; Pahnke et al., 2007). However, in some cases, factors like species’ variability complicatedδDC37-based salinity re-constructions (Kasper et al., 2015).
Apart from alkenones, there is a variety of other algal lipids which feature a distinct δDH2O – δDLipid relation-ship (Zhang et al., 2009; Sauer et al., 2001; Nelson and Sachs, 2014). Among these less frequently used compounds is palmitic acid. Palmitic acid is a saturated fatty acid, which is highly abundant in most aquatic environments. The in-frequent use of palmitic acid is mainly due to its ubiqui-tous occurrence, which does not allow linkage to a single group of producing species. Furthermore, palmitic acid is less resistant to degradation than alkenones (Sun and Wake-ham, 1994). Nevertheless, δD of palmitic acid (δDPA)has
been successfully used as a palaeoclimate indicator in sev-eral studies (Huang et al., 2002; Smittenberg et al., 2011; Shuman et al., 2006).
Although there are numerous laboratory and palaeocli-mate studies confirming the applicability of δDLipid to
re-construct the past isotopic composition of water, there have been only few calibration studies in oceanic environments (Schwab and Sachs, 2011, 2009; Wolhowe et al., 2015). To fill this gap, we analysedδDC37 andδDPAof suspended par-ticle samples along the salinity gradient induced by the Ama-zon freshwater plume and tested their applicability as salin-ity proxies (Fig. 1). Along with the hydrogen isotope anal-yses, we also tested the accuracy of the U37k0 temperature proxy (Müller et al., 1998) under the influence of the Ama-zon Plume. Potential impact of haptophyte species’ variabil-ity was monitored using the C37/C38 ratio (Rosell-Mele et
al., 1994), as defined below.
C37/C38=
C37:3Me+C37:2Me
C38:3Et+C38:3Me+C38:2Et+C38:2Me
[image:2.612.308.545.65.257.2](2)
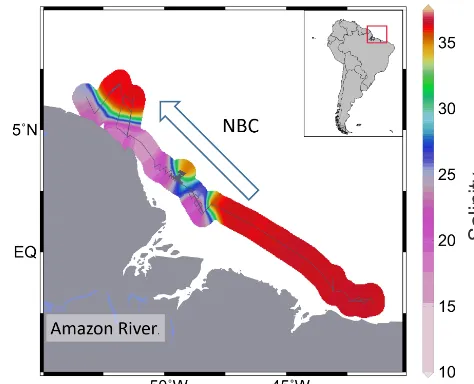
Figure 1. Map of the low-salinity plume of the Amazon River
outflow derived from the interpolation of on-board salinity mea-surements. The grey line shows RV Maria S. Merian cruise track MSM20/3 (Mulitza et al., 2013). The blue arrow depicts the North Brazil Current (NBC).
2 Methods 2.1 Study area
The study area is situated offshore northern Brazil and French Guyana close to the Amazon estuary (Fig. 1). A large portion of the research area is influenced by freshwater out-flow from the Amazon River, which induces a steep salin-ity gradient (Lentz and Limeburner, 1995). The freshwater plume is generally transported northwestwards by the North Brazil Current along the coastline of northern Brazil and French Guyana, while areas to the southeast of the Amazon River estuary are largely unaffected by the Amazon freshwa-ter discharge (Geyer et al., 1996). The geometry and trans-port of the freshwater plume are subject to large seasonal variations. The plume reaches its maximum extent during peak Amazon discharge in boreal summer (Molleri et al., 2010), while its northwestward transport is controlled by wind stress along the shelf (Geyer et al., 1996).
2.2 Sampling
Figure 2. (a)δDH2Oplotted against salinity; (b)U k0
37-based sea surface temperature (SST) reconstruction using the calibration by Müller et al. (1998) plotted against measured temperature. Green data points represent samples with a C37concentration > 10 ng L−1. The grey bar indicates the range of measured SST; (c) concentration of the C37alkenones plotted against salinity; (d) palmitic acid concentration plotted against salinity.
Along with the suspended particle samples, water samples were collected at the beginning and at the end of each filter-ing period. Water samples were sealed with wax and stored at 4◦C before analysis. On-board salinity and temperature measurements were conducted in 1 s intervals by a Sea-Bird Electronics SBE 45 MicroTSG thermosalinograph (accuracy 0.002◦C and 0.005 psu).
2.3 Stable isotope analysis of water
The stable hydrogen isotope composition of seawater sam-ples was determined at MARUM – Center for Marine En-vironmental Sciences, University of Bremen, with a thermal conversion/elemental analyzer operated at 1400◦C coupled to a Thermo Fisher Scientific MAT 253™Isotope Ratio Mass Spectrometer. Measurements were repeated 10 times for each seawater sample. Four in-house water standards used for cal-ibration were calibrated against IAEA standards VSMOW, GISP and SLAP. The maximum deviation from the calibra-tion slope was 1.6 ‰ vs. VSMOW and the average deviacalibra-tion was 0.7 ‰ vs. VSMOW.
2.4 Lipid analysis
Suspended particle samples were freeze-dried in a Christ Alpha 1–4 freeze-dryer. Lipids were extracted in a DIONEX Accelerated Solvent Extractor (ASE 200) using a dichloromethane (DCM): methanol (MeOH) 9:1 solution at 1000 psi and 100◦C for three cycles lasting 5 min each. Prior to extraction 2-nonadecanone and erucic acid were added as internal standards for the ketone and acid fractions, re-spectively. After extraction, samples were dried in a Hei-dolph ROTOVAP system. The extracts were saponified us-ing 0.1 M KOH in MeOH, yieldus-ing neutral and acid tions. The neutral fraction was separated into three frac-tions using activated silica gel chromatography (1 % H2O).
[image:3.612.128.469.64.386.2](FAMEs). The FAMEs were subsequently cleaned over pipet columns containing 2 cm silica. In order to remove unsat-urated compounds, further cleaning over columns of 2 cm AgNO3was conducted. Ketones and FAMEs were analysed
using a Thermo Fisher Scientific Focus gas chromatograph equipped with a 30 m Rxi™-5ms column (30 m, 0.25 mm, 0.25 µm) and a flame ionization detector. Compounds were quantified by comparing the integrated peak areas of the compounds to external standard solutions. Precision of com-pound quantification is about 5 % and precision of U37k0 re-constructions is 0.38◦C based on multiple standard analy-ses. Compound-specific isotope analyses was carried out on a Thermo Fisher Scientific MAT 253™ Isotope Ratio Mass Spectrometer coupled via a GC IsoLink operated at 1420◦C to a Thermo Fisher Scientific TRACE™GC equipped with a HP-5ms column (30 m, 0.25 mm, 1 µm; GC denotes gas chro-matograph). For each sample, duplicate injections of C37and
palmitic acid were conducted. Measurement accuracy was controlled byn-alkane standards of known isotopic compo-sition every six measurements and by the daily determination of the H+3 factor using H2as reference gas. H+3 factors
var-ied between 5.6 and 6.2, while the mean absolute deviation of external standards was 2.2 ‰. In order to prevent a bias intro-duced by variable alkenone distribution, theδD of alkenones was analysed for C37:2and C37:3together rather than
sepa-rately (van der Meer et al., 2013).δD values for palmitic acid were corrected for the methyl group added during methyla-tion.
3 Results
On-board sea surface temperature measurements resulted in uniform values of 28.5±0.5◦C, while salinity varied be-tween 10 and 36 psu (Fig. 1; Table 1). The hydrogen isotope analyses of seawater samples yieldedδD values between 6 and−15 ‰ (all isotope values are given vs. VSMOW). The values correlated linearly with sea surface salinity (Fig. 2a). The suspended particle samples yielded C37 alkenone
con-centrations between 0.2 and 65.3 ng L−1 (Table 1). Sam-ples with a salinity > 25 psu showed variable concentrations (0.2–65.3 ng L−1), while samples with a salinity < 25 psu had concentrations consistently lower than 10 ng L−1. There were almost no alkenones (concentration < 1 ng L−1)in fil-ter samples with a salinity < 15 psu (Fig. 2c, Table 1). The fatty acid analysis yielded almost exclusively short-chain compounds, of which palmitic acid had concentrations be-tween 1.4 and 27 µg L−1 (Fig. 2d). Variations in palmitic
acid concentrations showed a weak inverse correlation with salinity (Fig. 2d). For samples with alkenone concentrations > 10 ng L−1, sea surface temperature reconstructions agreed within the calibration error of 1.5◦C with on-board temper-ature measurements (Fig. 2b, Table 1). Samples with a con-centration < 10 ng L−1 featured a larger scatter with devia-tions from on-board measurements of up to 10◦C (Fig. 2b).
The ratio of the C37/C38 alkenones resulted in values
be-tween 0.9 and 1.7 (Table 1), indicating the prevalence of open ocean haptophyte contribution throughout the transect (Rosell-Mele et al., 1994). The C37:4 alkenone, sometimes
used as a salinity proxy, was not present in our samples. Due to the absence of alkenones in the low-salinity sam-ples, isotope analysis of the C37alkenone was only possible
in samples with a salinity > 15 psu. For these samples,δDC37 varied between−176 and−205 ‰ (Fig. 3a, Table 1). When all samples are taken into account,δDC37andδDH2Odo not correlate (Fig. 3a). If only the samples with an alkenone concentration > 10 ng L−1 were considered, linear regres-sion yielded a correlation betweenδDC37 andδDH2Owith a slope of 1.36 ‰δDC37per 1 ‰δDH2O (r
2=0.51,p< 0.05;
Fig. 3a). The values ofαC37 varied between 0.79 and 0.84 and showed no significant salinity dependence (Fig. 3c). In contrast toδDC37,δDPA strongly correlates withδDH2O, re-gardless of lipid concentration (r2=0.81,p< 10−7; Fig. 3b).
The slope of the linear regression is 1.72 ‰δDPA per 1 ‰ δDH2O. The fractionation factor between palmitic acid and water (αPA)yielded values between 0.79 and 0.83, featuring
a significant salinity dependency with an increase of 0.001 per salinity unit (Fig. 3d).
4 Discussion 4.1 Lipid sources 4.1.1 Alkenone sources
The C37/C38ratio was used for the assessment of the
dom-inant alkenone source (Conte et al., 1998). Open marine species like Emiliania huxleyi and Gephyrocapsa oceanica produce alkenones with a C37/C38 between 0.5 and 1.5
(Conte et al., 1998). Coastal species like Isochrysis galbana and Chrysotila lamellosa produce alkenones with a C37/C38
ratio > 2, sometimes even > 10 (M’Boule et al., 2014; Prahl et al., 1988; Marlowe et al., 1984). The C37/C38 ratio of
the samples from the Amazon Plume varied between 0.9 and 1.7 and alkenone production was therefore likely dominated by open marine species (Conte et al., 1998). Since some of the samples feature values at the upper limit for open ma-rine species, some (probably small) contribution by coastal haptophytes cannot be ruled out (Kasper et al., 2015). Alter-natively, the small variations in the C37/C38ratio could also
be the effect of species’ variability within open marine hapto-phytes (Conte et al., 1998). In contrast to previous laboratory and field studies (Ono et al., 2009; Chu et al., 2005), we do not find a correlation between salinity and the C37/C38ratio
(not shown here).
4.1.2 Palmitic acid sources
Table 1. Average geographic position, average measured sea surface temperature (SST), average sea surface salinity (SSS), C37 concen-tration, palmitic acid (PA) concenconcen-tration,U37k0, C37/C38ratio,δD of water (δDH2O),δD of C37 (δDC37)andδD of palmitic acid (δDPA)
for each sample. Values for salinity and temperature are the average of on-board measurements taken in 1 s intervals during each filtering period. Errors represent the standard deviation of these measurements. TheδD values of water represent the mean of two samples taken at the beginning and the end of each filtering period; each sample represents the mean of 10 replicate injections. Errors represent the propagated standard deviation of these measurements. TheδD values of C37and palmitic acid are the means of duplicate measurements. Errors represent the range between the duplicate measurements.
Conc. Conc. C37 PA
Sample Lat. Long. SST (C◦) SSS (psu) (ng L−1) (µg L−1) U37k0 C37/C38 δDH2O δD C37 δD PA PP10 1.9035 −48.4169 28.37±0.03 36.2±0.09 47.7 1.3 0.98 1.46 4.8±0.9 −190.1±0.5 −170.8±1 PP11 1.7587 −48.2568 28.99±0.04 34.72±0.51 54.2 N/A 0.96 1.56 6.6±1.2 −189.2±3.7 N/A PP12 1.7123 −48.2975 29.28±0.05 31.65±1.1 65.3 6 0.95 1.45 2.3±1.1 −185.4±2.2 −183.5±0.8 PP13 1.6655 −48.3388 29.31±0.18 28.06±1.2 20.6 16.6 0.96 1.47 −2.6±1.6 −200.8±1.9 −193.2±1.7 PP14 1.6197 −48.3791 29.17±0.03 25.79±0.51 5.7 12.3 0.94 1.42 −4.1±1.1 −206.3±1.3 −197.5±0.4 PP15 1.5724 −48.421 29.28±0.05 22.86±0.47 8.6 19.4 0.95 1.44 −6.7±1 a −205.4±0.9 PP16 1.5676 −48.4632 29.23±0.05 20.91±0.47 1.4 13.9 0.89 1.33 −9.2±0.9 a −209.7±0.6 PP17 1.6199 −48.5119 29.02±0.07 20.55±0.41 1.5 8.7 0.89 1.19 −11.8±1.4 −176.9±0.3 −205.9±0 PP19 2.0306 −48.759 28.67±0.02 17.84±0.55 3.8 N/A 0.71 2.52 −14.5±1.3 a N/A PP20 2.0858 −48.7282 28.73±0.03 21.15±1.38 2.6 N/A 0.81 1.08 N/A a N/A PP21 2.1431 −48.6728 28.82±0.02 26.22±1.63 1.3 N/A 0.79 1.12 N/A a N/A PP22 2.1815 −48.6369 28.82±0.05 30.76±1.2 2.8 N/A 0.91 1.44 N/A a N/A PP23 2.2205 −48.6038 28.9±0.02 33.25±0.5 2.8 N/A 0.95 1.43 N/A a N/A PP24 2.259 −48.6055 28.93±0.02 33.89±0.11 4.9 N/A 0.97 0.99 3.8±0.9 −191.8±1.9 N/A PP25 2.3389 −48.7336 28.84±0.04 27.45±1.27 5.1 N/A 0.87 0.92 N/A a N/A PP26 2.2984 −48.7711 28.82±0.03 23.96±1.09 0.4 N/A 0.87 1.25 N/A a N/A PP27 2.2674 −48.7995 28.71±0.04 20.8±0.71 0.4 N/A 0.65 0.98 N/A a N/A PP33 2.0652 −48.5919 28.6±0.04 17.44±0.24 1.1 N/A 0.68 1.01 N/A a N/A PP34 1.9301 −48.5528 28.63±0.04 16.02±0.12 6.6 N/A 0.78 1.27 N/A a N/A PP35 1.7071 −48.4395 28.45±0.04 18.21±0.39 0.8 N/A 0.76 1.03 N/A a N/A PP36 1.6196 −48.4013 28.55±0.06 24.34±0.4 2.2 16.5 0.85 1.17 −9.1±1.2 a −204.3±0.2 PP37 1.7662 −48.4925 28.37±0.03 17.63±1.27 0.6 N/A 0.76 1.2 N/A a N/A PP38 2.0088 −48.6108 28.35±0.05 14.14±0.76 0.7 N/A 0.64 1.02 −17.4±0.9 a N/A PP40 2.8827 −49.4089 28.73±0.03 33.54±0.06 4.0 N/A 0.81 0.99 N/A a N/A PP41 2.8566 −49.3425 29.08±0.06 29.34±1.32 0.2 2.1 0.81 1.8 0.2±0.9 a −188±1.1 PP42 2.8342 −49.3151 29.04±0.03 26.65±1.52 0.2 2.0 0.86 1.25 −2.2±1.1 a −197.1±0.7 PP43 3.1391 −49.3335 28.46±0.04 36.16±0.11 16.7 5.5 0.97 1.55 5.9±1.3 −180.3±0.6 −183.4±0.8 PP44 3.0999 −49.3064 28.23±0.03 34.89±0.45 59.1 N/A 0.98 1.54 6.3±1.1 −189±1.4 N/A PP45 3.0627 −49.4272 28.51±0.02 32.83±0.8 33.3 N/A 0.98 1.63 4.1±0.9 −190.8±0.4 N/A PP46 3.0911 −49.4337 28.68±0.04 33.1±0.65 9.2 N/A 0.96 1.42 N/A a N/A PP47 3.0554 −49.4321 28.49±0.01 29.2±0.08 6.1 16.4 0.96 1.29 0±0.9 −177.2±1.4 −201.6±0.7 PP48 2.915 −49.3347 28.03±0.02 23.42±0.27 7.7 7.2 0.88 1.14 −9.2±1.4 −197.9±0.5 −202.3±1.6 PP49 2.8972 −49.4713 28.07±0.03 21.86±0.46 1.3 16.2 0.89 1.23 −8.4±1 a −211.7±0.3 PP51 3.1025 −49.7931 28.3±0.06 18.31±0.21 2.2 N/A 0.74 1.04 N/A a N/A PP52 3.098 −49.6761 28.68±0.03 24.91±0.16 0.6 27.0 0.86 1.23 −10±1.3 a −204.9±1.6 PP53 3.5031 −50.1667 28.25±0.08 20.33±1.93 1.0 N/A 0.85 1.38 N/A a N/A PP54 3.5576 −50.3623 28.2±0.1 18.63±0.6 0.3 11.9 0.82 1.05 N/A a N/A PP55 3.9688 −50.5373 28.27±0.16 16.94±1.38 0.7 N/A 0.75 1.04 −16±0.8 a N/A PP57 4.4874 −51.2401 28.04±0.05 15.88±0.09 0.1 17.7 0.82 b −18.2±0.7 a −220.3±0.8 PP60 6.1499 −51.2679 28.09±0.03 36.16±0.01 2.0 2.7 0.99 b 5.8±0.8 −183.2±1.2 −182.4±0.6 PP61 5.5698 −51.8561 27.93±0.09 32.19±1.28 23.4 N/A 0.98 1.11 2.1±1.3 −191.1±2.7 N/A PP62 5.3201 −51.9255 27.9±0.04 22.72±1.32 3.4 23.2 0.97 1.1 −8.3±0.9 −192±5.4 −209.7±1.4 PP65 4.766 −51.5166 27.55±0.08 17.58±4.51 1.1 20.2 0.97 1.05 N/A a N/A PP66 6.658 −52.8391 28.09±0 36.06±0 7.1 4.01 0.96 1.2 6.2±0.7 −195.5±0.1 −188.9±0.5 PP67 5.9423 −52.6319 27.91±0.07 25.25±1.1 9.2 13.4 0.97 1.32 −4.9±1.2 −183.7±2 −206.7±0 PP68 5.79 −52.7484 27.53±0.06 23.4±0.17 4.6 N/A 0.96 1.16 −7.1±1.2 −192.5±0.4 N/A PP69 6.0839 −53.601 27.47±0.03 22.69±0.24 2.5 N/A 0.8 1.45 N/A a N/A PP70 6.2821 −53.1561 27.64±0.03 24.96±0.74 2.4 N/A 0.96 1.03 N/A a N/A
Figure 3. Results of theδDlipidanalysis. (a)δDC37plotted againstδDH2O. Green data points represent samples with a C37concentration
> 10 ng L−1; (b)δDPAplotted againstδDH2O; (c)αC37plotted against salinity. Green data points represent samples with a C37concentration
> 10 ng L−1; (d)αPAplotted against salinity.
bacteria (Eglinton and Eglinton, 2008). Unlike aqueous or-ganisms, terrestrial plants also synthesize long-chain fatty acids (Eglinton and Hamilton, 1967), which were not present in the filter samples. This indicates that the palmitic acids found in the Amazon Plume are exclusively produced by aquatic organisms. Also, the fast turnover rates of palmitic acid make a contribution by riverine compounds unlikely. Furthermore, previous studies have generally confirmed that palmitic acids in marine environments are predominantly produced by marine algae (Pearson et al., 2001).
4.2 Temperature reconstruction
Oceanic temperature reconstructions based on alkenones are a widely used tool in palaeoclimatology (Bard et al., 1997; Rühlemann et al., 1999). The global calibrations in use are based on open marine haptophyte species (Prahl and Wake-ham, 1987; Müller et al., 1998). Our reconstructed temper-atures show deviations of up to 10◦C from instrumentally measured temperature for samples with alkenone concentra-tion < 10 ng L−1(Fig. 2b). These anomalous, generally lower than expected values, could be caused by different processes.
First, coastal species bear a temperature–U37k0 relationship with a markedly lower slope than open marine species (Sun et al., 2007; Versteegh et al., 2001). Hence, a larger alkenone contribution by coastal haptophyte species would lead to the observed lower temperatures. Second, lower salinity is re-ported to cause metabolic stress in alkenone producers, lead-ing to anomalous reconstructed temperatures (Harada et al., 2003). Third, variations in haptophyte growth rate due to nu-trient or light limitation could also lead to variations in re-constructed temperatures (Epstein et al., 1998; Versteegh et al., 2001). The latter two points would also lead to lower alkenone concentrations and thus enhance the possibility of overprint by advection of allochthonous alkenones.
Variations in haptophyte algae composition recorded by changes in the C37/C38ratio do not show a correlation with
the residue,
Tresidue=Tmeasured−Treconstructed, (3)
of the temperature reconstruction (not shown here). Hence, variations in species’ composition are likely insufficient to account for theTresidue. Conversely, there is a correlation
Figure 4. Residues of theU37k0-based SST reconstruction plotted against salinity (a) and C37 concentration (b). Residues of theδDC37
measurement plotted against salinity (c) and C37concentration (d).
be an important cause for the large Tresidue (Harada et al.,
2003). The riverine waters of the Amazon Plume are gener-ally nutrient-rich (Santos et al., 2008), which makes a sce-nario of nutrient limitation unlikely to impact temperature control ofU37k0 in our study area. The high sediment load de-livered by the Amazon River, however, leads to light limi-tation in the study area (Smith and Demaster, 1996). Light limitation is indeed reported to lower reconstructedU37k0 tem-peratures by up to 7◦C (Versteegh et al., 2001). Since di-minished alkenone production due to low salinity and light limitation would lead to smaller alkenone concentrations, this would also explain why high concentration samples fea-ture no temperafea-ture deviation (Fig. 4b). The advection of al-lochthonous alkenones biasing temperature reconstructions has been suggested in other studies (Rühlemann and Butzin, 2006; Benthien and Müller, 2000). In our samples,U37k0 over-print by advected alkenones can be considered less likely, since there are no nearby areas where alkenones with a lower temperature signal could originate from.
In conclusion, there are multiple potential factors influ-encing theU37k0 deviation in the Amazon Plume. Given that
low alkenone concentrations are consistently associated with large negative temperature deviations, reduced alkenone pro-duction due to low salinity and light limitation in the Amazon Plume might be the most important factor for the temperature deviations (Fig. 4a, b; Versteegh et al., 2001; Harada et al., 2003).
4.3 Stable hydrogen isotope signals 4.3.1 AlkenoneδD
If all samples are considered, there is no correlation between δDC37 andδDH2O(Fig. 3a). Given the relationship between C37 concentration,Tresidue and salinity (Fig. 4a, b), we also
betweenδDC37 andδDH2O to be important; especially since this relation reflects a generally constant αC37 of 0.81 and agrees with results obtained for open marine species cultured at different salinities (M’Boule et al., 2014). For a potential impact onδDC37, factors similar to those considered for the temperature deviations have to be scrutinized: synthesis by coastal haptophyte species (M’Boule et al., 2014), changes in growth rate and phase (Schouten et al., 2006; Wolhowe et al., 2009), overprint by advected material and variations in salinity (Schouten et al., 2006). Since temperature is more or less uniform over the entire study area, a temperature effect as reported by Zhang and Sachs (2007) is not expected to play a role.
As previously mentioned, variations in the C37/C38 ratio
imply only limited variation in haptophyte species’ compo-sition. Moreover, the values ofαC37 are between 0.795 and 0.835 and are only slightly higher than observed in laboratory experiments studying open marine haptophytes (Schouten et al., 2006), but are markedly lower than observed for coastal haptophytes (M’Boule et al., 2014). This again suggests that the studied alkenones are predominantly of open marine hap-tophyte origin. Although there are no signs of a full-scale change from open marine to coastal haptophytes, the vari-ability in habitat preference may still be sufficient to have a significant influence onαC37. The C37/C38variability found in a sediment core collected offshore Mozambique by Kasper et al. (2015) was similar to the one found in our samples and the associated species’ variability was likely large enough to significantly influenceδDC37. In our samples, the C37/C38 ratio does however not correlate withαC37and species’ vari-ations alone are therefore unlikely to be the dominant cause for the absent correlation betweenδDC37andδDH2Oin low-salinity samples. In contrast to laboratory studies (Schouten et al., 2006), we find no clear relationship between salin-ity and the fractionation factor (Fig. 3c). The absence of a salinity–αC37 relationship was also reported in a field study by Schwab and Sachs (2011) who explained their findings by the presence of additional factors such as species’ variability and temperature, which may have counteracted the effects of salinity. If the relation between δDC37 andδDH2O for high concentration samples is used to calculate the residue, δDres C37=δDC37− 1.358×δDH2O−194.558
, (4)
for each sample, it becomes apparent that low concentra-tion samples have higher residuals (Fig. 4d).Furthermore, δDres C37 correlates with salinity, which indicates that δDres C37 is largely influenced by the input of low-salinity Amazon freshwater (Fig. 4c). This observation would also fit with the assumption that the lower C37concentration in those
samples was a result of lower growth rate, because lower growth rate leads to a higher fractionation factor (M’Boule et al., 2014; Schouten et al., 2006; Sachse and Sachs, 2008). Since the steep salinity gradient of the Amazon Plume leads to a wide range of surface water isotopic composition over
a short geographic distance, we cannot exclude some influ-ence of advected alkenones in samples with low or absent in situ alkenone production. As this effect is insufficient to ex-plain the largeTresidue, advection is likely not the main factor
responsible for the absence of a correlation betweenδDC37 andδDH2O. Although the deviation inδDC37 cannot be tied to a single factor, low alkenone production associated with the low-salinity, suspension-rich Amazon waters is likely the most important factor (Wolhowe et al., 2015). Thus, the tem-perature andδDC37 deviations are likely caused by similar effects (Fig. 4a–d).
4.3.2 Palmitic acidδD
In contrast to δDC37, δDPA correlates well with δDH2O (Fig. 3b). Furthermore,αPA correlates with salinity (Fig. 3d)
and thus confirms the relationship between salinity and α observed in various laboratory and field studies for palmitic acid and other lipids (Schouten et al., 2006; M’Boule et al., 2014; Chivall et al., 2014a). Our findings imply that the lim-iting factors potentially leading to variations inαC37 do not influenceαPA. The factors that could potentially influence δDPA are largely similar to those influencingδDC37 (Chivall et al., 2014a). Unlike for alkenones there is, however, no clear evidence for a growth rate dependence ofαPA(Zhang et al.,
2009).
One striking difference between palmitic acid and alkenones in our samples is the different abundance of the two compounds. Palmitic acid concentrations were about 3 orders of magnitude higher than alkenone concentrations (Fig. 2c, d). This is unsurprising, since palmitic acid is typ-ically very abundant in marine environments (Pearson et al., 2001). In further contrast to the C37 concentration, the
palmitic acid concentration was not lower in low-salinity samples, but featured a trend towards higher concentrations. This indicates that palmitic-acid-producing organisms were not negatively affected by the low-salinity, sediment-rich Amazon input like haptophyte algae, but rather benefited from the high nutrient supply by the Amazon (Santos et al., 2008). This marked difference supports the notion that low alkenone production rates in parts of the study area were responsible for the αC37 deviations. Furthermore, the high palmitic acid concentrations also limit the influence of a pos-sible overprint of the in situ signal by allochthonous com-pounds. Apart from that, the high turnover rate of palmitic acid may further impede the influence of allochthonous com-pounds. This is also in contrast to alkenones, which are comparably stable towards degradation (Sun and Wakeham 1994). Therefore, the lower turnover rate of alkenones ren-ders these compounds more susceptible to overprint by older, allochthonous compounds.
Our study shows thatαPA remains relatively stable over
agree-observed in those studies is also in the range of αPA
ob-served in the Amazon Plume (0.79–0.83). This further dicates that species’ composition and other factors do not in-fluenceαPAto a large extent on an ecosystem level. Potential
variations ofαPAfrom different contributors are either small
or levelled out by integration over ecosystems. A surpris-ing constancy inδDPAhas also been observed in a sediment
core from the Santa Barbara Basin (Li et al., 2009). There, the δDPA remained constant even in the presence of
het-erotrophic palmitic acid producers. This could indicate that the constancy inαPA is not only limited to phototrophic
or-ganisms as observed here and by Huang et al. (2004), but also extends to heterotrophic organisms. The constancy could be caused by the very similar biosynthetic pathway for palmitic acid in bacteria and eukaryotes (Li et al., 2009).
Although there are multiple lacustrine studies that success-fully applyδDPA as a palaeoenvironmental proxy
(Smitten-berg et al., 2011; Shuman et al., 2006) andδDPA faithfully
records δDH2O in our study, there are still multiple factors that could overprint a surfaceδDPAsignal. Especially in open
oceanic environments, palmitic acid production deeper in the water column could alter the signal recorded at the surface. After deposition, bacterial activity in the sediment could also overprint the original upper water column signal (Perry et al., 1979).
5 Conclusions
Our study shows that δDPA in suspended particle samples
from the Amazon Plume salinity gradient records variations in salinity. For δDC37, this correlation is only present in samples above a C37 concentration of 10 ng L−1. The low
alkenone concentrations are likely caused by the sediment-rich freshwater input of the Amazon River impeding hapto-phyte growth and affecting αC37. Hence, the ubiquitous na-ture of palmitic acid proved to be highly beneficial in the study area. Moreover, palmitic acid bears the advantage of easier isotopic measurement and a high availability in most environments. The use of δDPA as a stand-alone salinity
proxy has to be considered with caution. Potential disad-vantages of palmitic acid include post-depositional degrada-tion, compound synthesis deeper in the water column, which may not record surface conditions and the bacterial over-print in the sediment. A possible way to circumvent these limitations, as well as the problems encountered forδDC37, could be the parallel use of δDPA and δD37. δDPA is not
sensitive to the low concentration issues encountered in this study, while δDC37 is only produced in surface waters and not susceptible to synthesis or degradation deeper in the wa-ter column or sediments. Therefore, the combined study of compound-specific hydrogen isotope composition of more
Acknowledgements. We would like to acknowledge funding through the DFG Research Center/Cluster of Excellence “The Ocean in the Earth System” at MARUM – Center for Envi-ronmental Sciences. C. Häggi thanks GLOMAR – Bremen International Graduate School for Marine Sciences – for support and C. M. Chiessi acknowledges financial support from FAPESP (grant 2012/17517-3). We thank the RV Maria S. Merian cruise MSM20/3 crew for technical support during sampling, and Ralph Kreutz and Ana C. R. de Albergaria-Barbosa for laboratory support. Helpful comments by two anonymous reviewers greatly improved the manuscript.
The article processing charges for this open-access publication were covered by the University of Bremen.
Edited by: H. Niemann
References
Bard, E., Rostek, F., and Sonzogni, C.: Interhemispheric synchrony of the last deglaciation inferred from alkenone palaeothermome-try, Nature, 385, 707–710, doi:10.1038/385707a0, 1997. Benthien, A. and Müller, P. J.: Anomalously low alkenone
temper-atures caused by lateral particle and sediment transport in the Malvinas Current region, western Argentine Basin, Deep-Sea Res. Pt. I, 47, 2369–2393, doi:10.1016/s0967-0637(00)00030-3, 2000.
Chivall, D., M’Boule, D., Heinzelmann, S. M., Kasper, S., Sinke-Schoen, D., Sinninghe-Damsté, J. S., Schouten, S., and van der Meer, M. T. J.: Towards a palaeosalinity proxy: hydrogen iso-topic fractionation between source water and lipids produced via different biosynthetic pathways in haptophyte algae, Geophysi-cal Research Abstracts, 16, 12066, 2014a.
Chivall, D., M’Boule, D., Sinke-Schoen, D., Sinninghe Damsté, J. S., Schouten, S., and van der Meer, M. T. J.: The effects of growth phase and salinity on the hydrogen isotopic composition of alkenones produced by coastal haptophyte algae, Geochim. Cosmochim. Ac., 140, 381–390, doi:10.1016/j.gca.2014.05.043, 2014b.
Chu, G. Q., Sun, Q., Li, S. Q., Zheng, M. P., Jia, X. X., Lu, C. F., Liu, J. Q., and Liu, T. S.: Long-chain alkenone distri-butions and temperature dependence in lacustrine surface sedi-ments from China, Geochim. Cosmochim. Ac., 69, 4985–5003, doi:10.1016/j.gca.2005.04.008, 2005.
Conte, M. H., Thompson, A., Lesley, D., and Harris, R. P.: Ge-netic and physiological influences on the alkenone/alkenoate ver-sus growth temperature relationship in Emiliania huxleyi and Gephyrocapsa oceanica, Geochim. Cosmochim. Ac., 62, 51–68, doi:10.1016/s0016-7037(97)00327-x, 1998.
Eglinton, G. and Hamilton, R. J.: Leaf epicuticular waxes, Science, 156, 1322–1335, doi:10.1126/science.156.3780.1322, 1967. Eglinton, T. I. and Eglinton, G.: Molecular proxies for
Englebrecht, A. C., and Sachs, J. P.: Determination of sediment provenance at drift sites using hydrogen isotopes and unsatura-tion ratios in alkenones, Geochim. Cosmochim. Ac., 69, 4253– 4265, doi:10.1016/j.gca.2005.04.011, 2005.
Epstein, B. L., D’Hondt, S., Quinn, J. G., Zhang, J. P., and Har-graves, P. E.: An effect of dissolved nutrient concentrations on alkenone-based temperature estimates, Paleoceanography, 13, 122–126, doi:10.1029/97pa03358, 1998.
Epstein, S. and Mayeda, T.: Variation of O18 content of waters from natural sources, Geochim. Cosmochim. Ac., 4, 213–224, doi:10.1016/0016-7037(53)90051-9, 1953.
Geyer, W. R., Beardsley, R. C., Lentz, S. J., Candela, J., Lime-burner, R., Johns, W. E., Castro, B. M., and Soares, I. D.: Phys-ical oceanography of the Amazon shelf, Cont. Shelf Res., 16, 575–616, doi:10.1016/0278-4343(95)00051-8, 1996.
Giosan, L., Coolen, M. J. L., Kaplan, J. O., Constantinescu, S., Filip, F., Filipova-Marinova, M., Kettner, A. J., and Thom, N.: Early Anthropogenic Transformation of the Danube-Black Sea System, Sci. Rep., 2, 582, doi:10.1038/srep00582, 2012. Harada, N., Shin, K. H., Murata, A., Uchida, M., and Nakatani, T.:
Characteristics of alkenones synthesized by a bloom of Emiliania huxleyi in the Bering Sea, Geochim. Cosmochim. Ac., 67, 1507– 1519, doi:10.1016/s0016-7037(02)01318-2, 2003.
Huang, Y. S., Shuman, B., Wang, Y., and Webb, T.: Hydrogen isotope ratios of palmitic acid in lacustrine sediments record late Quaternary climate variations, Geology, 30, 1103–1106, doi:10.1130/0091-7613(2002)030< 1103:hiropa> 2.0.co;2, 2002.
Huang, Y. S., Shuman, B., Wang, Y., and Webb, T.: Hy-drogen isotope ratios of individual lipids in lake sed-iments as novel tracers of climatic and environmental change: a surface sediment test, J. Paleolimn., 31, 363–375, doi:10.1023/b:jopl.0000021855.80535.13, 2004.
Kasper, S., van der Meer, M. T. J., Castañeda, I. S., Tjallingii, R., Brummer, G.-J. A., Sinninghe Damsté, J. S., and Schouten, S.: Testing the alkenone D/H ratio as a pa-leo indicator of sea surface salinity in a coastal ocean margin (Mozambique Channel), Org. Geochem., 78, 62–68, doi:10.1016/j.orggeochem.2014.10.011, 2015.
Lea, D. W., Pak, D. K., and Spero, H. J.: Climate impact of late Quaternary equatorial Pacific sea surface temperature variations, Science, 289, 1719–1724, doi:10.1126/science.289.5485.1719, 2000.
Lentz, S. J. and Limeburner, R.: The Amazon River Plume during AMASSEDS – Spatial characteristics and salin-ity variabilsalin-ity, J. Geophys. Res.-Oceans, 100, 2355–2375, doi:10.1029/94jc01411, 1995.
Li, C., Sessions, A. L., Kinnaman, F. S., and Valentine, D. L.: Hydrogen-isotopic variability in lipids from Santa Barbara Basin sediments, Geochim. Cosmochim. Ac., 73, 4803–4823, doi:10.1016/j.gca.2009.05.056, 2009.
Marlowe, I. T., Green, J. C., Neal, A. C., Brassell, S. C., Eglinton, G., and Course, P. A.: Long-Chain (n-C37-C39) Alkenones in the Prymnesiophyceae – Distribution of Alkenones and other Lipids and their Taxonomic Significance, British Phycological Journal, 19, 203–216, doi:10.1080/00071618400650221, 1984.
Marlowe, I. T., Brassell, S. C., Eglinton, G., and Green, J. C.: Long-Chain Alkenones and Alkyl Alkenoates and the Fossil
Coccol-ith Record of Marine Sediments, Chem. Geol., 88, 349–375, doi:10.1016/0009-2541(90)90098-r, 1990.
M’Boule, D., Chivall, D., Sinke-Schoen, D., Sinninghe-Damsté, J. S., Schouten, S., and van der Meer, M. T. J.: Salinity dependent hydrogen isotope fractionation in alkenones produced by coastal and open ocean haptophyte algae, Geochim. Cosmochim. Ac., 130, 126–135, doi:10.1016/j.gca.2014.01.029, 2014.
Molleri, G. S. F., Novo, E., and Kampel, M.: Space-time variability of the Amazon River plume based on satellite ocean color, Cont. Shelf Res., 30, 342–352, doi:10.1016/j.csr.2009.11.015, 2010. Mulitza, S., Chiessi, C. M., Cruz, A. P. S., Frederichs, T., Gomes,
J. G., Gurgel, M. H., Haberkern, J., Huang, E., Jovane, L., Kuh-nert, H., Pittauerová, D., Reiners, S.-J., Roud, S. C., Schefuß, E., Schewe, F., Schwenk, T. A., Sicoli Seoane, J. C., Sousa, S. H. M., Wagner, D. J., and Wiers, S.: Response of Amazon sedimentation to deforestation, land use and climate variabil-ity, Cruise No. MSM20/3, February 19–March 11 2012, Recife (Brazil), Bridgetown (Barbados), Berichte, Fachbereich Geowis-senschaften, Universität Bremen, Bremen, Germany, 1–86, 2013. Müller, P. J., Kirst, G., Ruhland, G., von Storch, I., and Rosell-Mele, A.: Calibration of the alkenone paleotemperature index U37K’ based on core-tops from the eastern South Atlantic and the global ocean (60◦N–60◦S), Geochim. Cosmochim. Ac., 62, 1757–1772, doi:10.1016/s0016-7037(98)00097-0, 1998. Nelson, D. B. and Sachs, J. P.: The influence of salinity on D/H
fractionation in dinosterol and brassicasterol from globally dis-tributed saline and hypersaline lakes, Geochim. Cosmochim. Ac., 133, 325–339, doi:10.1016/j.gca.2014.03.007, 2014. Ono, M., Sawada, K., Kubota, M., and Shiraiwa, Y.: Change of the
unsaturation degree of alkenone and alkenoate during acclima-tion to salinity change in Emiliania huxleyi and Gephyrocapsa oceanica with reference to palaeosalinity indicator, Res. Org. Geochem, 25, 53–60, 2009.
Pahnke, K., Sachs, J. P., Keigwin, L., Timmermann, A., and Xie, S. P.: Eastern tropical Pacific hydrologic changes during the past 27 000 years from D/H ratios in alkenones, Paleoceanography, 22, PA4214, doi:10.1029/2007pa001468, 2007.
Pearson, A., McNichol, A. P., Benitez-Nelson, B. C., Hayes, J. M., and Eglinton, T. I.: Origins of lipid biomarkers in Santa Monica Basin surface sediment: A case study using compound-specific Delta C-14 analysis, Geochim. Cosmochim. Ac., 65, 3123–3137, doi:10.1016/s0016-7037(01)00657-3, 2001.
Perry, G. J., Volkman, J. K., Johns, R. B., and Bavor Jr., H. J.: Fatty acids of bacterial origin in contemporary marine sediments, Geochim. Cosmochim. Ac., 43, 1715–1725, doi:10.1016/0016-7037(79)90020-6, 1979.
Prahl, F. G. and Wakeham, S. G.: Calibration of unsaturation pat-terns in long-chain ketone compositions or paleotemperature as-sessment, Nature, 330, 367–369, doi:10.1038/330367a0, 1987. Prahl, F. G., Muehlhausen, L. A., and Zahnle, D. L.: Further
Eva-lutation of Long-Chain Alkenones as Indicators of Paleoceano-graphic Conditions, Geochim. Cosmochim. Ac., 52, 2303–2310, doi:10.1016/0016-7037(88)90132-9, 1988.
Rohling, E. J.: Progress in paleosalinity: Overview and pre-sentation of a new approach, Paleoceanography, 22, PA3215, doi:10.1029/2007pa001437, 2007.
sedi-Rostek, F., Ruhland, G., Bassinot, F. C., Muller, P. J., Labeyrie, L. D., Lancelot, Y., and Bard, E.: Reconstructing Sea-Surface Tem-perature and Salinity using Delta-O-18 and Alkenone Records, Nature, 364, 319–321, doi:10.1038/364319a0, 1993.
Rühlemann, C. and Butzin, M.: Alkenone temperature anomalies in the Brazil-Malvinas Confluence area caused by lateral advection of suspended particulate material, Geochem. Geophys. Geosys., 7, Q10015, doi:10.1029/2006gc001251, 2006.
Rühlemann, C., Mulitza, S., Muller, P. J., Wefer, G., and Zahn, R.: Warming of the tropical Atlantic Ocean and slowdown of ther-mohaline circulation during the last deglaciation, Nature, 402, 511–514, doi:10.1038/990069, 1999.
Sachse, D. and Sachs, J. P.: Inverse relationship between D/H fractionation in cyanobacterial lipids and salinity in Christmas Island saline ponds, Geochim. Cosmochim. Ac., 72, 793–806, doi:10.1016/j.gca.2007.11.022, 2008.
Santos, M. L. S., Muniz, K., Barros-Neto, B., and Araujo, M.: Nu-trient and phytoplankton biomass in the Amazon River shelf wa-ters, An. Acad. Bras. Cienc., 80, 703–717, doi:10.1590/s0001-37652008000400011, 2008.
Sauer, P. E., Eglinton, T. I., Hayes, J. M., Schimmelmann, A., and Sessions, A. L.: Compound-specific D/H ratios of lipid biomarkers from sediments as a proxy for environmental and climatic conditions, Geochim. Cosmochim. Ac., 65, 213–222, doi:10.1016/s0016-7037(00)00520-2, 2001.
Schmidt, F., Oberhansli, H., and Wilkes, H.: Biocoenosis re-sponse to hydrological variability in Southern Africa during the last 84 ka BP: A study of lipid biomarkers and compound-specific stable carbon and hydrogen isotopes from the hyper-saline Lake Tswaing, Global Planet. Change, 112, 92–104, doi:10.1016/j.gloplacha.2013.11.004, 2014.
Schouten, S., Ossebaar, J., Schreiber, K., Kienhuis, M. V. M., Langer, G., Benthien, A., and Bijma, J.: The effect of temper-ature, salinity and growth rate on the stable hydrogen isotopic composition of long chain alkenones produced by Emiliania hux-leyi and Gephyrocapsa oceanica, Biogeosciences, 3, 113–119, doi:10.5194/bg-3-113-2006, 2006.
Schwab, V. F. and Sachs, J. P.: The measurement of D/H ratio in alkenones and their isotopic heterogeneity, Org. Geochem., 40, 111–118, doi:10.1016/j.orggeochem.2008.09.013, 2009. Schwab, V. F. and Sachs, J. P.: Hydrogen isotopes in individual
alkenones from the Chesapeake Bay estuary, Geochim. Cos-mochim. Ac., 75, 7552–7565, doi:10.1016/j.gca.2011.09.031, 2011.
Sessions, A. L., Burgoyne, T. W., Schimmelmann, A., and Hayes, J. M.: Fractionation of hydrogen isotopes in lipid biosynthesis, Org. Geochem., 30, 1193–1200, doi:10.1016/s0146-6380(99)00094-7, 1999.
Shuman, B., Huang, Y. S., Newby, P., and Wang, Y.: Compound-specific isotopic analyses track changes in sea-sonal precipitation regimes in the Northeastern United States at ca 8200cal yrBP, Quat. Sci. Rev., 25, 2992–3002, doi:10.1016/j.quascirev.2006.02.021, 2006.
Smith, W. O. and Demaster, D. J.: Phytoplankton biomass and productivity in the Amazon River plume: Correlation with seasonal river discharge, Cont. Shelf Res., 16, 291–319, doi:10.1016/0278-4343(95)00007-n, 1996.
proxies for West Pacific Warm Pool hydrologic variability, Quat. Sci. Rev., 30, 921–933, doi:10.1016/j.quascirev.2011.01.012, 2011.
Sun, M. Y. and Wakeham, S. G.: Molecular evidence for degradation and preservation of organic matter in the anoxic Black-Sea Basin, Geochim. Cosmochim. Ac., 58, 3395–3406, doi:10.1016/0016-7037(94)90094-9, 1994.
Sun, Q., Chu, G. Q., Liu, G. X., Li, S., and Wang, X. H.: Calibration of alkenone unsaturation index with growth temperature for a lacustrine species, Chrysotila lamellosa (Haptophyceae), Org. Geochem., 38, 1226–1234, doi:10.1016/j.orggeochem.2007.04.007, 2007.
van der Meer, M. T. J., Baas, M., Rijpstra, W. I. C., Marino, G., Rohling, E. J., Sinninghe Damsté, J. S., and Schouten, S.: Hy-drogen isotopic compositions of long-chain alkenones record freshwater flooding of the Eastern Mediterranean at the onset of sapropel deposition, Earth Planet. Sci. Lett., 262, 594–600, doi:10.1016/j.epsl.2007.08.014, 2007.
van der Meer, M. T. J., Sangiorgi, F., Baas, M., Brinkhuis, H., Sinninghe Damsté, J. S., and Schouten, S.: Molecular iso-topic and dinoflagellate evidence for Late Holocene freshen-ing of the Black Sea, Earth Planet. Sci. Lett., 267, 426–434, doi:10.1016/j.epsl.2007.12.001, 2008.
van der Meer, M. T. J., Benthien, A., Bijma, J., Schouten, S., and Sinninghe Damsté, J. S.: Alkenone distribution impacts the hy-drogen isotopic composition of the C-37:2 and C-37:3 alkan-2-ones in Emiliania huxleyi, Geochim. Cosmochim. Ac., 111, 162– 166, doi:10.1016/j.gca.2012.10.041, 2013.
Versteegh, G. J. M., Riegman, R., de Leeuw, J. W., and Jansen, J. H. F.: U37K’ values for Isochrysis galbana as a function of cul-ture temperacul-ture, light intensity and nutrient concentrations, Org. Geochem., 32, 785–794, doi:10.1016/s0146-6380(01)00041-9, 2001.
Wolhowe, M. D., Prahl, F. G., Probert, I., and Maldonado, M.: Growth phase dependent hydrogen isotopic fractionation in alkenone-producing haptophytes, Biogeosciences, 6, 1681– 1694, doi:10.5194/bg-6-1681-2009, 2009.
Wolhowe, M. D., Prahl, F. G., Langer, G., Oviedo, A. M., and Ziveri, P.: AlkenoneδD as an ecological indicator: A culture and field study of physiologically-controlled chemical and hydrogen-isotopic variation in C37 alkenones, Geochim. Cosmochim. Ac., 162, 166–182, doi:10.1016/j.gca.2015.04.034, 2015.
Zhang, Z. H. and Sachs, J. P.: Hydrogen isotope frac-tionation in freshwater algae: I. Variations among lipids and species, Org. Geochem., 38, 582–608, doi:10.1016/j.orggeochem.2006.12.004, 2007.