www.biogeosciences.net/9/1985/2012/ doi:10.5194/bg-9-1985-2012
© Author(s) 2012. CC Attribution 3.0 License.
Biogeosciences
Organic matter dynamics and stable isotope signature as tracers of
the sources of suspended sediment
Y. Schindler Wildhaber, R. Liechti, and C. Alewell
Institute for Environmental Geosciences, Basel, Switzerland
Correspondence to: Y. Schindler Wildhaber (yael.schindler@unibas.ch)
Received: 22 December 2011 – Published in Biogeosciences Discuss.: 16 January 2012 Revised: 24 April 2012 – Accepted: 2 May 2012 – Published: 4 June 2012
Abstract. Suspended sediment (SS) and organic matter in rivers can harm brown trout Salmo trutta by affecting the health and fitness of free swimming fish and by causing sil-tation of the riverbed. The temporal and spatial dynamics of sediment, carbon (C), and nitrogen (N) during the brown trout spawning season in a small river of the Swiss Plateau were assessed and C isotopes as well as the C/N atomic ratio were used to distinguish autochthonous and allochthonous sources of organic matter in SS loads. The visual basic pro-gram IsoSource with13Ctot and 15N as input isotopes was
used to quantify the temporal and spatial sources of SS. Or-ganic matter concentrations in the infiltrated and suspended sediment were highest during low flow periods with small sediment loads and lowest during high flow periods with high sediment loads. Peak values in nitrate and dissolved organic C were measured during high flow and high rainfall, prob-ably due to leaching from pasture and arable land. The or-ganic matter was of allochthonous sources as indicated by the C/N atomic ratio andδ13Corg. Organic matter in SS
in-creased from up- to downstream due to an increase of pasture and arable land downstream of the river. The mean fraction of SS originating from upper watershed riverbed sediment decreased from up to downstream and increased during high flow at all measuring sites along the course of the river. Dur-ing base flow conditions, the major sources of SS are pas-ture, forest and arable land. The latter increased during rainy and warmer winter periods, most likely because both trig-gered snow melt and thus erosion. The measured increase in DOC and nitrate concentrations during high flow support these modeling results. Enhanced soil erosion processes on pasture and arable land are expected with increasing heavy rain events and less snow during winter seasons due to cli-mate change. Consequently, SS and organic matter in the
river will increase, which will possibly affect brown trout negatively.
1 Introduction
!
50 km
!
(
!
(
!
(!(!(!(
# * # *
# *
# *
# * # * # *
# * # *
# *#*#*
# *
!! !
!! !
! ! !
! ! !
ª ª
ª ªªªª
0 0.5 1 2km
±
Willisau!
( Riverbed S #
* Forest ! Pasture
ª Arable land
Hergiswil Switzerland
Site B 625 m a. s. l.
Site C 583 m a. s. l.
[image:2.595.55.282.61.390.2]Site A 757 m a. s. l.
Fig. 1. Watershed of the river Enziwigger with the three field
sites A, B and C including their altitude, soil sample spots and the towns Willisau and Hergiswil (Canton of Lucerne, Switzerland).
in hydraulic conductivity (Sch¨alchli, 1995). This affects the oxygen supply to the developing salmonid embryos in the redds negatively, and hence their survival (Greig et al., 2005, 2007a; Heywood and Walling, 2007). The presence of high organic matter in the IS and interstitial water can additionally disproportionately impact on spawning habits (Greig et al., 2005). As respiration is strongly dependent on the availabil-ity of organic matter, oxygen demand within riverbeds will increase as the pool of organic matter increases (for a review see Greig et al., 2007b). Organic material is derived either from in-stream sources (autochthonous), for example macro-phyte vegetation or from external sources (allochthonous), for example leaf litter or runoff from agricultural fields (Sear et al., 2008).
Schindler Wildhaber et al. (2012) reported in a study on sediment dynamics in a small Swiss headwater river of the Swiss Plateau with a native brown trout Salmo trutta popu-lation an SS increase from up- to downstream. This finding could be related to an increased shear stress attributable to a higher water level down the stream and/or to a higher fine sediment input from the arable land in the lower part of the catchment. Furthermore, organic carbon concentrations of
the SS were found to be highly variable with minimum val-ues around 1.5 % at high flow and maximum valval-ues around 10.5 % at low flow (Schindler Wildhaber et al., 2012).
An identification of SS sources is required to improve site management and possibly restrain the described nega-tive consequences for brown trouts. Sediment tracer-based methods have been used to distinguish possible sources in watersheds. Stable carbon (C) and nitrogen (N) isotopes and as well as the carbon to nitrogen atomic ratio (C/Na) have been found to be reliable tracers in recent studies (Onstad et al., 2000; McConnachie and Petticrew, 2006; Fox and Pa-panicolaou, 2007; Gao et al., 2007; Fox et al., 2010). Stable isotope compositions as well as C/Na are affected by many factors including soil depth, vegetation, climate and cultural history (Kendall, 1998). By assessing the ratio of13C to12C,
15N to14N and Ca to Na in the SS as well as in surface soils
of the catchment, conclusions concerning possible SS ori-gin can be drawn. The isotopic compositions of SS samples may represent a mixture of potential sources. The propor-tional contributions of different sources can be assessed by linear mixing models. The disadvantage of these models is generally the limitation in detecting potential sources by the number of isotope tracers. Withnisotope tracers,n+1 po-tential sources can be detected. The model is mathematically under-determined if the number of potential sources exceeds n+1, resulting in an equation system with less equations than unknown variables and therefore no single solution is possi-ble (Phillips and Gregg, 2001). Phillips and Gregg (2003) developed a a visual basic program called IsoSource to as-sess potential source contributions if more thann+1 sources are present. The program examines in small increment steps all possible combinations of each source contribution, result-ing in several feasible solutions. This program was used in this study to quantify source contributions to SS during the brown trout spawning season.
The objective of this study was (I) to assess the temporal and spatial C and N dynamics during the brown trout spawn-ing season in suspended and infiltrated sediments and river as well as interstitial water, (II) the use of Corg isotopes as
well as C/Na to distinguish autochthonous and allochthonous sources of the organic matter in the SS, and (III) the use of Ctotand N isotopes as tracers to quantify the sources of SS
with respect to time and space.
2 Materials and methods
2.1 Study site and general setup
morphology is strongly modified: Only 5 % is close to natural or natural, 21 % is little affected and 74 % is strongly affected or even artificial, including terraces that have been inserted to prevent deep channel erosion and scouring of the bed dur-ing flood events (classified with the Swiss modular stepwise procedure for ecomorphology after H¨utte and Niederhauser, 1998; EBP-WSB-Agrofutura, 2005).
The bedrock of the watershed consists of Upper Fresh-water Molasse. The soil types are mainly (stagnic) Cam-bisols and Leptosols (classified according to WRB (IUSS, 2006)). The mean annual temperature in Willisau is 8.5◦C with a mean annual rainfall of 1050 mm. Mean annual rain-fall on the peak of the mountain Napf, where the river En-ziwigger originates, is 1700 mm per year (1961–2007; data from MeteoSwiss).
SS, IS and water samples were collected at three sites named A, B and C; from up- to downstream (Fig. 1) dur-ing the brown trout spawndur-ing season from November 2009 to end of March 2010. The sites had an altitude of 757, 625 and 583 m above sea level. For more information regard-ing the characteristics of the river and the three sites, see Schindler Wildhaber et al. (2012).
2.1.1 Sample collection
SS were sampled with 6 time-integrated SS samplers at each site following Phillips et al. (2000). The aperture of the SS samplers were about 60–70 mm above the riverbed. IS ples were collected in 6 sediment baskets per site. SS sam-plers and sediment baskets were both emptied in a weekly interval. The basket’s sediment was sieved with a 4 mm sieve and the basket refilled with the remaining coarse sediment during each sampling event. Sediments<4 mm were taken to the laboratory for further analyses. The term infiltrated sediment (IS) refers to the total sediment<2 mm infiltrated during one week in the sediment basket and suspended sedi-ment (SS) refers to the total amount of sedisedi-ment caught dur-ing one week in the SS samplers. For a detailed descrip-tion and discussion of the used methods for SS and IS see Schindler Wildhaber et al. (2012).
Interstitial water samples for dissolved organic carbon (DOC) and nitrate analyses were obtained in approximately two week intervals in 12 mini piezometers per site. The mini piezometers were 300 mm deep and perforated in the lower 160 mm. They were designed after Baxter et al. (2003) and are described in detail in Schindler Wildhaber et al. (2012). The interstitial water samples represent the water at the depth of the burried eggs in natural redds. Water samples were fil-tered in the field with 0.45 µm filters and laboratory analyses were conducted the following day. Soil samples for isotope and organic matter analyses were collected in forest, pasture and arable land with erosion evidences (Fig. 1). Soil profiles were determined at each sampling spot to ensure sampling of representative areas. In total, 40 topsoil samples of the wa-tershed were analyzed. Additionally, an algae sample of each
site, six manure samples close to site B and C, and 5 riverbed sediment samples from the upper most accessible reach of the river were collected. No surface water ran at the upper most accessible reach of the river during dry periods, which allowed sediment sampling with a simple corer. It is assumed that these sediments represent mainly the original bedrock molasse. Downstream riverbed sediments were not sampled, as those samples would possibly represent a mixture of the other four sources. Source samples that are not independent would complicate the modeling results.
Water level at the three sites was measured every 15 s with pressure transmitter probes (STS Sensore Technik, Sirnach) and logged at 10 min intervals. Air temperature und precipi-tation was measured near site B at the town Hergiswil (Fig. 1) by a private company (KELAG K¨unzli Elektonik AG) in 5 min intervals on behalf of the Canton of Lucerne. Air tem-perature for site A and C was calculated from these data by assuming an increase of mean air temperature by 0.6◦ per 100 m in altitude (Leser et al., 2005).
2.1.2 Sample analyses
Soil and sediment samples were dried at 40◦C. Grain size distributions of the IS and SS were assessed with the stan-dardized sieve techniques, grains with a diameter <32 µm with a sedigraph (Micrometrics 100, Coulter Electronics, Germany). Grain size fractions were classified according to the German soil taxonomy: Clay: <2 µm, silt: 2–63 µm and sand: 63 µm–2 mm (Sponagel et al., 2005). Organic and total carbon (Corg and Ctot) of the IS was measured
by a Leco RC612 multiphase analyzer. Corg, Ctot, total
ni-trogen (TN) and C and N isotopes of SS and soil sam-ples were measured with a continuous flow isotope ratio mass spectrometer (Thermo Finnigan, Germany) in line with a FLASH Elemental Analyzer 1112 (Thermo Finnigan, Italy) following standard processing techniques. For Corg
analy-ses, inorganic carbon was eliminated with HCl vapor. Sta-ble isotope ratios are reported as δ values per mil (‰) as:δX= [(Rsample/Rstandard)−1] ×1000 whereXis13C or 15N andR=13C/12C or15N/14N. Standard reference
ma-terials are PDB limestone for C and air for N. The sam-ples were corrected to internal standards EDTA (δ13C= −30.3 ‰,δ15N= −1.1 ‰) and AO-1, ammonium oxalate (δ13C= −17.0 ‰ and δ15N=32.7 ‰). The precision re-ported for δ13C and δ15N analyzes was 0.1 ‰. DOC was measured with a TOC-Analyzer 5000A (Shimadzu Corpo-ration), nitrate with an ion chromatograph with a Metrosep A Supp 5 column (Metrohm AG).
2.1.3 Data interpretation
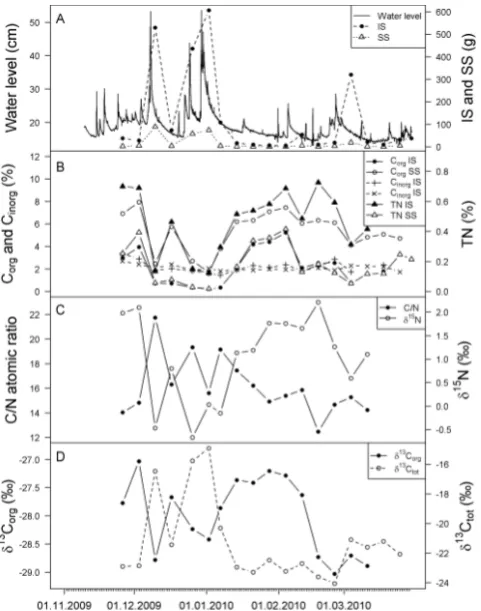
Fig. 2. Sediment, nutrient and isotope composition dynamics during
the field period. Plotted are mean values of all samples from all three sites. (A) Water level at site B, the weekly infiltration of sediment
<2 mm (IS) and the weekly suspended sediment (SS); (B) Corgand
TN of IS and SS; (C) C/Na andδ15N of SS; (D)δ13C of Corgand
Ctotof the SS.
variable was assessed by linear regression models, back-ward stepwise linear regression models were used with sev-eral possible predictor variables. Relationships of data which were not normally distributed were tested with the Spearman rank correlation test. Significance level for all statistical anal-yses was set at 0.05.
The visual basic program IsoSource was used to quan-tify soil and sediment source contribution to SS (Phillips and Gregg, 2003). This program is available free at http://www.epa.gov/wed/pages/models/stableIsotopes/ isosource/isosource.htm and has been successfully applied in different studies (e.g. Phillips et al., 2005; Gibbs, 2008; Phillips and Gregg, 2003). The program examines all pos-sible combinations of each source contribution (0–100 %) in user-defined increment steps. Combinations that sum up to the measured isotopic compositions within a specified tolerance are considered to be feasible solutions from which the range of potential source contributions can be determined. Reporting the mean of the feasible solutions would only lead to misinterpretation of the results since every feasible solution may be the correct one (Phillips and
Gregg, 2003). Thus, the means of the possible solutions with standard deviations are reported in this study. Source increments of 1 % and mass balance tolerance levels of ±0.1 ‰ were defined. In few cases, where no solution was found with these defaults, mass balance tolerance level was set to 1 ‰.
3 Results and discussion
3.1 Spatial and temporal dynamics of Corgin sediments
and of DOC
Corg concentrations of the IS samples were significantly
smallest at the upstream site A (mean=1.7±1.3 %). The highest mean Corg concentration in IS was found at site B
(3.0±2.5 %). IS at the most downstream site C had a mean Corgconcentration of 2.3±1.8 % (Table 1). Overall, the
as-sessed Corgconcentrations of the IS are relatively low. Sear
et al. (2008) reported in a review organic matter concentra-tions of infiltrated fine sediment from 13 rivers in Europe. Concentrations ranged from 3.4 % to 24.5 % with a mean of 13 %. Heywood and Walling (2007) measured 15 % Corg in
infiltrated fine sediment.
Corgconcentration of the SS showed a similar spatial
pat-tern as Corgconcentration of the IS: the smallest
concentra-tions were assessed at site A with a mean of 5.1 %, site B and C had significant higher concentrations with means of 6.6 and 6.5 %, respectively (Table 1). Again, these concen-trations are relatively low. Acornley and Sear (1999) assessed 25 to 40 % Corgin the SS during low flows in summer and 15
to 20 % during high flows in autumn in two rivers in Hamp-shire, England, which were also brown trout spawning habi-tats. The relatively low Corg concentrations could partly be
due to an instrumental bias of the SS samplers. Phillips et al. (2000) reported that SS samplers underestimate smallest SS particles to some extent. This would also include the light weighted organic material. They concluded, however, that the mean grain size does not statistically differ from point samples and that SS samplers collect statistically represen-tative samples. The weekly assessed Corg concentrations of
the SS are about four times higher than the concentrations in IS. This is probably due to the low specific gravity of or-ganic material, holding it longer in suspension than inoror-ganic material (Sear et al., 2008). The degradation of Corgis
con-sidered to be negligible (see Sect. 3.3). The increase of Corg
in IS and SS from up to downstream can be explained by the higher percentage of agriculturally exploited land down-stream of the watershed. Site A is surrounded by forest and pasture, while dominant land use at site B and C are arable farm land and pasture, which were both regularly manured.
Corg concentrations and the total amount of IS and SS
showed remarkable inverse dynamics (Fig. 2). IS and SS gen-erally increased with increasing water levels. Corg
Table 1. Mean values and standard deviation at the three sites sampled of organic and inorganic carbon (Corg and Cinorg) in infiltrated
sediment (IS) and suspended sediment (SS), dissolved organic carbon (DOC) in the river and the interstitial (int.), total nitrogen (TN) in IS and SS, nitrate in the river and interstitial, C/Na,δ13Corg,δ13Ctotandδ15N of SS. The sample numbers are given in parentheses.
Site A Site B Site C
CorgIS (%) 1.7±1.3 (29)* 3.0±2.5 (30)* 2.3±1.8 (27)
CinorgIS (%) 2.1±0.4 (29) 2.4±0.8 (30) 2.1±0.9 (27) CorgSS (%) 5.1±1.9 (29) 6.6±2.7 (16) 6.5±1.7 (27)
CinorgSS (%) 2.1±0.3 (29) 2.3±0.7 (16) 2.0±0.4 (27)
DOC river (mg l−1) 2.1±0.6 (6) 1.8±0.8 (7) 3.2±1.7 (7)* DOC int. (mg l−1) 2.0±0.6 (36)* 2.5±1.1 (27) 2.5±1.0 (29) TN IS (%) 0.2±0.1 (17) 0.2±0.2 (15) 0.2±0.1 (14) TN SS (%) 0.4±0.1 (18)* 0.5±0.3 (16) 0.5±0.2 (12) Nitrate river (mg l−1) 5.2±0.7 (7)* 8.9±0.6 (7)* 9.0±1.2 (7)* Nitrate int. (mg l−1) 4.9±0.6 (34)* 8.9±0.5 (27)* 9.0±0.6 (29)* C/N atomic IS 14.2±2.0 (17) 16.8±3.7 (15) 14.8±2.9 (14) C/N atomic SS 16.7±2.1 (18) 15.3±3.1 (16) 15.8±2.1 (12)
δ13CorgSS (‰) −28.0±0.5 (18) −28.1±0.9 (16) −27.8±0.9 (15) δ13CtotSS (‰) −20.1±2.8 (18)* −21.8±2.6 (16) −22.9±3.0 (12)* δ15N SS (‰) −0.4±0.9 (18)* 2.0±1.1 (16)* 1.8±0.6 (12)
* Differs significantly from the two other sites (ANOVA,p <0.05).
with water level and total IS and SS (Fig. 3a, b). Lowest Corg
concentrations in IS (about 0.1 %) were measured during high flows in January and peak concentrations during base flows in February (about 6 to 8 %; Fig. 2a). Minimum Corg
concentrations of the SS were also measured in January and were around 1.5 % and maximum at the end of February with concentrations around 10 % (Figs. 2b and 3b). A decrease of particulate organic carbon with increasing SS is reported in studies worldwide (Onstad et al., 2000; Meybeck, 1982; Gao et al., 2007; Zhang et al., 2009). The pattern can be explained by a dilution of Corg during high sediment loads with
min-eral matter derived from terrigenous soil erosion or remobi-lizing of mineral matter of the riverbed (Zhang et al., 2009). Corghas a very low specific gravity holding it longer in
sus-pension than inorganic material, thus during base flow, the Corgproportion increases compared to heavier inorganic
ma-terial. The significant relationship between the concentration of Corgin IS and SS and the silt and clay fraction (sediment
<63 µm) of IS and SS support this assumption (Fig. 3c). Silt and clay are also held in suspension more easily than sedi-ment in the sand fraction.
It is assumed that the concentrations of Corgin the IS and
SS are low enough that they do not have negative effects on the developing brown trout embryos in the river Enziwigger. Only during long periods of low flow with enhanced Corg
concentrations in the SS and IS, Corgmight induce a negative
environments for the brown trout embryos. A high concentra-tion of Corgcan additionally block interstitial pore spaces,
re-duce gravel permeability and promote the growth of biofilms, leading to a decrease of oxygen availability (Greig et al., 2005).
The mean values of the measured DOC concentrations of the river and interstitial water samples were around 2 mg l−1 at all sites (Table 1). No significant differences in DOC con-centrations in the river water and the interstitial water close to the brown trout eggs were assessed. DOC values around 2 mg l−1 represent a good mean water quality during the measured winter period in terms of DOC classified with the Swiss modular stepwise procedure for chemistry (Liechti, 2010). DOC values of the measured samples at site A never exceeded 4 mg l−1; thus, they were always in the category “good water quality” (Liechti, 2010). DOC values in river and interstitial water at site B and C exceeded 4 mg l−1 at
Fig. 3. Relationship between Corgand (A) total IS<2 mm; (B) total SS; (C) clay and silt fraction of sediment<2 mm and (D) TN. Solid circles and solid lines: Infiltrated sediment, stars and dotted lines: SS. Dashed lines in (A) and (B) are the 95 % confidence intervals.
3.2 Spatial and temporal dynamics of TN in sediments and of nitrate
TN increased similar to Corgfrom the upstream site A to the
two downstream sites B and C (Table 1), most probably due to the increased sediment input from manured arable land and pasture. The increase of TN in the SS from site A with a mean of 0.4 % to site B and C with means around 0.5 % was significant (Table 1). The percentage of TN in SS was about 4 times higher than in the IS, thus showing the same pattern as Corg. The temporal dynamic of TN concentrations
of IS and SS showed the same characteristics as the Corg
dy-namic (Fig. 2b): low levels at high discharge and high iment yield and high levels at low discharge and low sed-iment yields (see previous section for explanation of this pattern). Overall, a highly significant relationship between TN and Corgconcentration of captured sediments was found
(Fig. 3d). The linear regressions between Corgand TN gives
ay-intercept for IS of 0.09 (±0.08) and for SS of 1.0±0.2 (Fig. 3d). These small intercepts indicate mainly organic TN in these samples (Onstad et al., 2000).
Nitrate concentrations in the river and the interstitial water increased significantly from site A with a mean of 5.2 and 4.9 mg l−1, respectively, to site B and C with means for river and interstitial water of 8.9 and 9.0 mg l−1(Table 1). Nitrate concentrations for the two arable sites B and C did not differ significantly. A nitrate concentration below 5.6 mg l−1 repre-sents a “good” water quality with respect to nitrate
accord-ing to the Swiss modular stepwise procedure for chemistry (Liechti, 2010). All but one measurement at site A was below this threshold concentration. The only sample exceeding this concentration was taken at high flow. This indicates nitrate leaching during high flow from the nearby pasture. Nitrogen leaching during storm events was described by other authors (e.g. Inamdar et al., 2004; Wagner et al., 2008). All sam-ples at site B and C exceeded the concentration of 5.6 mg l−1 and two and three out of seven samples, respectively, even exceeded 8.4 mg l−1. 8.4 mg l−1 is set as threshold concen-tration between the category “moderate” and “unsatisfying” water quality in terms of nitrate (Liechti, 2010). Thus, the ni-trate concentrations of the river and interstitial water are too high, which is most probably due to manuring of the arable land and pasture at the two downstream sites. Nitrate concen-trations in the interstitial water at the depth of brown trout eggs were not significantly different from nitrate concentra-tions in the river water. The lack of chemical gradients might indicate strong river water flux to the brown trout eggs (Mal-colm et al., 2003).
3.3 Spatial and temporal dynamic of C/Na
Mean C/Na of SS are between 12.5 and 21.8 (Fig. 2c). C/Na generally decrease with increasing decomposition while δ15N values increase (Conen et al., 2008). The correlation between mean C/Na and meanδ15N of SS is significantly negative (ρ= −0.8). This inverse relationship can also be seen in Fig. 2c.
C/Na of the IS do not differ significantly from C/Na of the SS. Mean C/Na were between 14.2 and 16.8 for IS and SS at all three sites (Table 1). Values are similar to data re-ported for worldwide rivers (Meybeck, 1982), continental US rivers (Onstad et al., 2000), and in the Zhujiang River, China (Zhang et al., 2009). Mean C/Na of arable land, pas-ture and forest soil samples were between 10.7 and 16.8 (Ta-ble 2). C/Na of the analyzed algae as autochthonous sources of organic matter were significantly smaller with a mean of 9.1±0.8. The highest concentration of autochthonous or-ganic matter would most likely occur during low flow con-ditions. No significant correlations between C/Na and SS or IS and between C/Na and water level at the sites were found. Consequently, the measured C/Na of IS and SS pointed to an allochthonous origin (e.g. soil or litter) of the organic mat-ter in sediment. C/Na were excluded from further sediment tracer modeling because of the missing significant relation-ships between C/Na of the SS and water levels at the sites.
3.4 Spatial and temporal dynamics of Cinorgin
sediments
IS and SS had a Cinorgconcentration around 2 % at all sites
(Table 1, Fig. 2b) due to carbonaceous bedrocks in the area. No significant differences between Cinorg concentrations of
Table 2. Range (mean) of C/Na,δ13Corg,δ13Ctotandδ15N values of algae, manure, and riverbed sediment (riverbed S) as well as of forest,
pasture and arable land soils of the watershed.
C/Na δ13Corg(‰) δ13Ctot(‰) δ15N (‰)
Algae (n=4) 7.9–9.6 (9.1)* −41.4–−31.1 (−35.0)* −40.1–16.7 (−24.3) −0.7–3.5 (2.1)* Manure (n=6) 14.6–34.9 (20.8)* −28.7–−25.3 (−27.9) −29.0–−25.7 (−27.9) 7.4–11.9 (8.9)* Riverbed S (n=5) 12.1–25.5 (17.8) −28.1–−26.7 (−27.3) −3.2–−0.7 (−1.9)* −5.9–−3.44 (−4.7)* Forest (n=14) 13.4–31.8 (16.8) −28.4–−26.8 (−27.5)* −28.7–−11.0 (−23.0) −4.0–4.7 (−0.8)* Pasture (n=12) 11.4–26.1 (13.9) −29.2–−27.8 (−28.6) −29.5–−20.7 (−27.6)* −1.0–6.4 (3.0) Arable land (n=8) 9.5–11.3 (10.7)* −28.5–−27.1 (−27.8) −28.3–−19.9 (−25.9) 4.3–7.7 (6.0)*
* Differs significantly from the five other potential sources (ANOVA,p <0.05)
which is consistent with a steady pH value of the river wa-ter around 8.2 at all site. The Cinorg concentrations varied
only marginally during the season and no correlation be-tween Cinorgconcentrations and the total IS, SS and the
maxi-mal water level during the week was assessed (Fig. 2b). Con-sequently, the concentration of Cinorgof IS and SS can not be
used to draw any conclusions about the origin of the sedi-ments.
3.5 Carbon and nitrogen isotopes for tracing suspended sediment sources
δ13Corg values of SS were around −28.0±0.9 ‰ and did
not differ significantly between the three sites (Table 1). δ13Corgvalues of soil and sediment samples from the
catch-ment were in the same range (Table 2). Algae were highly depleted in13Corgresulting inδ13Corgvalues between −41
and−31 ‰. Thus,13Corgisotopes indicate an allochthonous
origin of the organic matter in SS, supporting the conclusion drawn from C/Na.δ13Ctot values of the SS decreased
sig-nificantly from upstream (mean site A:−20.0 ‰) to down-stream (mean site C:−22.9 ‰), indicating different source contributions to the sediments (Table 1). The significantly higherδ15N values at sites B and C with means of 2.0±1.1 and 1.8±0.6 ‰, respectively, support this assumption (δ15N mean of site A= −0.4±0.9 ‰, Table 1).
SS isotope compositions varied highly during the brown trout spawning season.δ13Ctot values increased with higher
water level and higher amount of SS whileδ13Corgandδ15N
values decreased (Fig. 2c, d). This indicates different SS sources related to the discharge pattern. Linear regression models showed significant relationships for all three sites between water level andδ13Ctot values (R2=0.51 to 0.95)
and between water level andδ15N values (R2=0.51 to 0.66, Fig. 4). No significant relationship was found between wa-ter level andδ13Corg. The relatively small range ofδ13Corg
values (−29.9 to −26.5 ‰) compared toδ13Ctot (−25.6 to −13.8 ‰) andδ15N (−2.2 to 3.6 ‰) might be a reason for this missing significance. For this reason only, Ctot and N
isotope compositions were used for further tracer modeling andδ13Corgvalues were excluded.
Riverbed sediment in the upper watershed hadδ13Ctot
val-ues as high as −0.7 ‰ due to enrichment with carbonate. The carbonate contents of the sediment were between 2.2 and 3.4 %. In parallel,15N was depleted resulting inδ15N values around−5 ‰ (Table 2, Fig. 5). These low values indicate young, poorly-decomposed material (Conen et al., 2008). The riverbed sediment probably originates mainly from the bedrock molasse. Very low Corgconcentrations with a mean
of 0.2 % support this assumption.δ13Ctot of the forest soils
varied highly (Table 2). Two of the six forest samples above site A had carbonate contents around 1.5 %. Those two soils were enriched in 13Ctot resulting in δ13Ctot values around −14 ‰. The remaining forest soil samples contained no car-bonate resulting inδ13Ctotsimilar toδ13Corgaround−28 ‰
(Fig. 5).13Ctotvalues of the forest soils upstream of site B
and C were around−26 ‰. Again, carbonated soils (Cinorg
around 0.3 %) were enriched in13Ctotcompared to
decarbon-ated soils. Meanδ15N of the forest soil samples above site A was−2.5 ‰. The downstream forest soil samples around site B and C were enriched with15N (meanδ15N=1.5 ‰). A decrease ofδ15N with increasing elevation and declining temperature has been assessed in several studies (for a review see Amundson et al., 2003) and can be explained by poorly-decomposed material. The steep slopes of the forests above site A can have an additional influence on the lowδ15N val-ues. The soil residence time decreases with increasing slope and thereforeδ15N values decrease (Amundson et al., 2003). δ13Ctotvalues of pasture and arable land soil samples were
between−19.9 and−29.5 % at all sites (Table 2, Fig. 5). Dif-ferences between sites and between pasture and arable land inδ13Ctotwere not significant. Again, higherδ13Ctot values
● ● ● ●● ● ● ● ● ●●● ● ● ● ● −25 −20 −15
Water level (cm)
δ
13
Cto
t
(‰)
R2=0.79 p <0.05 Site A ● ● ● ● ● ● ● ● ● ● ● ● ● ●
Water level (cm) R2=0.51 p <0.05 Site B ● ● ● ● ●● ● ● ● ● ● ●
Water level (cm) R2=0.95 p <0.05 Site C ● ● ● ●● ● ● ● ● ● ● ● ● ●
5 10 15 20
−2 −1 0 1 2 3 4
Water level (cm)
δ
15
N
(‰)
R2=0.66 p <0.05
Site A ●
● ● ● ● ● ● ● ● ● ● ● ● ●
10 20 30 40 50
Water level (cm) Water level (cm) R2=0.51
p <0.05
Site B ● ● ● ● ● ● ● ●● ● ● ●
10 20 30 40 50
Water level (cm) R2=0.54
p< 0.05
[image:8.595.129.468.62.287.2]Site C
Fig. 4. Relationship between maximal mean daily water level of a week andδ13Ctotandδ15N values of the weekly captured SS at the three
sites. Dashed lines are the 95 % confidence intervals.
These findings lead to the assumption that during high flow and high SS loads with highδ13Ctot and low δ15N values
(Fig. 4), SS source is mainly the riverbed sediment in the up-per watershed. During low flow and low SS loads with lower δ13Ctotand higherδ15N values (Fig. 4), SS sources are soils
of forests, pasture and arable land (Fig. 5). The IsoSource program was used to quantify the proportion of the different sources (Phillips and Gregg, 2003). While interpreting the results, it is recommended to concentrate on the distribution of the feasible solutions rather than focus on a single value such as the mean to avoid misrepresenting the uniqueness of the results (Phillips and Gregg, 2003).
Algae samples were excluded from the modeling because C/Na and δ13Corg values indicated none or minimal
au-tochthonous C contributions. As described in Sect. 2.1.1, riverbed sediment samples were only taken in the upper most accessible reach of the river. Fox et al. (2010) noted that transformation of nitrogen could occur during tempo-rary storage of sediments in the streambed, thus potentially masking their provenance. The sediment study in the Enzi-wigger was only conducted during winter time when biolog-ical activity is low. Consequently, it is assumed that N and Ctot isotopic compositions would not significantly change
during the temporary storage in the river. With biotic frac-tionation, higher isotope values and lower C/Na values with less organic concentrations are expected. The opposite was measured: With less organic material in the sediments,δ15N values decreased and C/Na increased (Fig. 2). Addition-ally, decomposition processes triggered higher isotope values with smaller grain sizes since larger soil particles break into smaller particle sizes during these decomposition processes
(e.g. Fox and Papanicolaou, 2007). This was not the case for δ13Ctot, but it did apply toδ15N. This is, however, probably
not attributable to physical fractionation but due to the fact that the mean sediment size as well as the source contribu-tions varied in dependence of the water level.
SS at site A can possibly originate from forest and pas-ture soils or from riverbed sediment of the upper water-shed.δ13Ctot andδ15N values of the three possible sources
are clearly distinguishable (Fig. 5), resulting in well-defined
IsoSource outcomes (Fig. 6). During base flow, the majority
Table 3. Mean (range and standard deviation) source contribution (%) to the suspended sediment at the three sites. Riverbed S = riverbed
sediment.
Source Site A Site B Site C
Riverbed S 27.0 (11.0±0.7–52.8±0.8) 18.3 (3.1±2.0–41.2±1.5) 12.1 (2.0±1.5–48.2±0.8) Forest 16.0 (0±1.7–45±2.2) 16.8 (2.5±1.9–49.1±18.5) 26.4 (3.6±3.1–40.9±12.4) Pasture 56.9 (28.4±1.7–75±1.0) 25.1 (3.8±3.4–64.0±14.6) 38.0 (6.7±4.6–56.0±20.7) Arable land 39.9 (11.7±5.1–70.4±2.4) 23.5 (7.2±4.5–45.8±7.7)
−30 −25 −20 −15 −10 −5 0
−6 −4 −2 0 2 4 6
δ15N(‰)
δ
13
Cto
t
(‰) Site A
●
●
Suspended sediment Riverbed sediment Forest Pasture Arable land
R2=0.7 p<0.05 ●
●
● ●
−30 −25 −20 −15 −10 −5 0
δ
13
Cto
t
(‰)
Site B
R2=0.4 p<0.05 ●
●
● ●
−30 −25 −20 −15 −10 −5 0
δ
13
Cto
t
(‰)
Site C
R2=0.5 p<0.05 ●
●
● ●
Fig. 5.δ13Ctot andδ15N values of SS and soil samples collected
above each sites (average±sd). Dashed line: SS regression line.
Arable land represents an additional possible source for SS at sites B and C. The modeling results of these sites have higher uncertainty as there are four (n+2) possible sources for the downstream sites with two (n) isotope groups and thus, an under-determined equation system. In addition, the distinction of the isotopic compositions of the possible sources was not as clear as at site A (Fig. 5). Nevertheless, some general conclusions were possible.
[image:9.595.52.317.103.535.2]During base flow conditions, SS at site B originated mainly from arable land followed by pasture and forest soils
Fig. 6. Total suspended sediment (SS) per week at the three sites
and soil source contribution from the three/four possible sources to SS at the three sites, determined with the dual isotope mixing model IsoSource. Air temperature was measured close to site B in Hergiswil.
variables (F4,91=20.1, p <0.05):
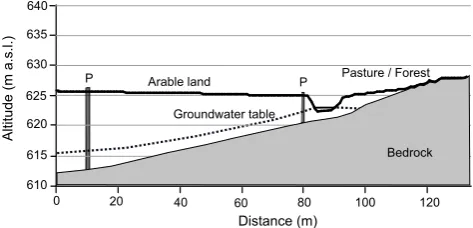
SS from arable land=29.7+4.5 Temp−0.35 Temp2 −0.5 Rain+0.002 Rain2 (1) These results indicate erosion processes on the fallow fields during rainy periods when the fields were neither snow-covered nor frozen. During high flow conditions, riverbed sediment of the upper watershed was the main source of SS, resulting in a significant positive correlation between SS with riverbed sediment origin and water level (ρ=0.56). The fea-sible contributions of forest and pasture soils to SS often overlapped, making the distinction between their contribu-tions impossible. Consequently, the mean contribution val-ues in Table 3 have to be regarded with caution. For this rea-son, statistics were conducted with the sum of the SS frac-tion originating from forest and from pasture soils. Spear-man correlations indicate a significant decrease of SS origi-nating from forest and pasture soils with increasing temper-ature (ρ= −0.31) and precipitation (ρ= −0.21). This in-crease of forest and pasture soils sediment contributions dur-ing drier and colder periods might indicate a transportation of SS with percolating water during snow-covered periods. Forest and pasture areas upstream to site B are mainly lo-cated on the hillside on the right side of the river where the bedrock is relatively close to the surface (Fig. 7). This proba-bly triggers a relatively fast subsurface flow. Moist soil in the warmer season and ice formation during the winter on the right side of the channeled riverbed support the assumption that subsurface water and groundwater is draining from the hillside to the river. Arable land is located on the flat planes on the left side of the river. Groundwater modeling as well as observations of riverine groundwater (head, temperature and electric conductivity) indicate infiltration processes on the left-sided river board dominating the local groundwater flow regime (Huber et al., 2012) (Fig. 7). Thus, forest and pasture soils represent the main sediment sources at site B during undisturbed conditions. Thus, forest and pasture soils represent basically the main sediment sources at site B dur-ing undisturbed conditions. Sediments originatdur-ing in arable land predominate, however, these natural processes due to erosion.
The majority of the SS during base flow conditions at site C came from pasture (29±17 to 56±20 %) and for-est soils (21±12 to 41±12 %; Fig. 6). Both fractions in-creased significantly during colder and drier periods (Spear-man rank correlations, pasture vs. precipitationρ= −0.39, pasture vs. temperatureρ= −0.37, forest vs. precipitation ρ= −0.41 and forest vs. temperature ρ= −0.61.) Multi-ple regression models with maximal daily precipitation and mean daily temperature of a week could explain 58 % of the SS originating from pasture and 61 % of the SS originat-ing from forest (p <0.05). This indicates again a transporta-tion of SS through percolating water from the hillside during snow-covered periods. The percentage of SS deriving from arable land was between 7.2±4.5 and 45.8±7.7 % with
in-640 635 630 625
120 100 80 60 40 20 0
P 620 615 610
P
Arable land Pasture / Forest Groundwater table
Bedrock Bedrock
A
lti
tu
de
(
m
a
.s
.l.
)
[image:10.595.309.546.63.177.2]Distance (m)
Fig. 7. Schematic view of the groundwater table and bedrock at
site B with the installed piezometers (P).
creasing values with higher temperature (linear regression, R2=0.49, p <0.05) and precipitation (linear regression, R2=0.36,p <0.05; Table 3). Maximum daily precipitation and maximum daily mean temperature of a week together explain 74 % of the amount of SS originated from arable land (multiple regression,p <0.05). Unfortunately, only one sample from an extreme flow event was assessed due to the loss of SS samplers. Nevertheless, the mean percentage of SS deriving from the upper watershed riverbed sediment de-pended significantly on the maximal daily mean water level (linear regression,R2=0.95). During low flow conditions, riverbed sediment accounted for only 2±1.5 % of the SS, during high flow for 48.2±0.8 % (Table 3).
These observations have important implications for arable land management strategies. Anticipated warmer winters with more frequent heavy rain events (IPPC, 2007) are likely to enhance the SS delivery from arable land at site B and C as well as DOC and nitrate input to the river. Besides the negative effects on the arable land (loss of soil and organic material to the river), brown trout eggs can be negatively impacted by the enhanced input of SS and organic material (Greig et al., 2005, 2007b). A possible adaption could be a wider protecting strip next to the river with natural vegetation or greening of the arable fields during the winter.
4 Conclusions
The concentration of Corg as well as TN in the IS and SS
pasture and arable land. C/Na and δ13Corg values indicate
an allochthonous source of the organic matter in the SS dur-ing the brown trout spawndur-ing season. Ctot and N isotopes
were used to trace the source of SS in respect to time and space using the visual basic program IsoSource. The frac-tion of SS originating from the riverbed sediment of the upper watershed increased at all sites during high flow. At site A, these fractions were the highest with values between 11.0±0.7 % to 52.8±0.8 % (mean=27.0 %). Smallest con-tributions from the riverbed sediment were detected at site C. The SS source contributions varied between sites during base flow conditions: at site A SS mainly originated from pasture, at site B mainly from arable land and pasture, and at site C from pasture and forest. Increasing winter temperatures and precipitation lead to a higher contribution of SS from arable land at both downstream sites, indicating soil erosion from the bare fields during snow-free and snow-melting periods. The increased DOC and nitrate concentration during high flow support these IsoSource calculations. These data indi-cate an increase of soil erosion processes on snow-free pas-ture and arable land during the anticipated warmer winter with more frequent torrential rain events (IPPC, 2007). An increase of SS and of organic matter concentration in the SS during the brown trout spawning season is a probable con-sequence. Both of these affect brown trout eggs negatively (Greig et al., 2005, 2007b).
Acknowledgements. This study was funded by the Swiss national
foundation (SNFK-32K1-32K1-120486/1). We would like to thank Torsten Vennemann and three anonymous reviewers for the constructive comments. They were a great help towards improving the manuscript. We thank Christian Michel, Sandra Rudolf and Bastian Brun for their help in the field, Mark Rollog, Marianne Ca-roni and Ruth Strunk for laboratory assistance and measurements and Claude Schneider for technical support. DOC and nitrate values were kindly provided by Bastian Brun from his bachelor thesis.
Edited by: X. Wang
References
Acornley, R. M. and Sear, D. A.: Sediment transport and siltation of brown trout (Salmo trutta L.) spawning gravels in chalk streams, Hydrol. Processes, 13, 447–458, 1999.
Alewell, C., Meusburger, K., Brodbeck, M., and Ban-ninger, D.: Methods to describe and predict soil erosion in mountain regions, Landscape Urban Plan., 88, 46–53, doi:10.1016/j.landurbplan.2008.08.007, 2008.
Amundson, R., Austin, A. T., Schuur, E. A. G., Yoo, K., Matzek, V., Kendall, C., Uebersax, A., Brenner, D., and Bais-den, W. T.: Global patterns of the isotopic composition of soil and plant nitrogen, Glob. Biogeochem. Cy., 17, 1031, doi:10.1029/2002gb001903, 2003.
Asselman, N. E. M., Middelkoop, H., and van Dijk, P. M.: The im-pact of changes in climate and land use on soil erosion, transport
and deposition of suspended sediment in the River Rhine, Hy-drol. Processes, 17, 3225–3244, doi:10.1002/hyp.1384, 2003. Baxter, C., Hauer, F. R., and Woessner, W. W.: Measuring
groundwater-stream water exchange: New techniques for in-stalling minipiezometers and estimating hydraulic conductivity, T. Am. Fish. Soc., 132, 493–502, 2003.
Bilotta, G. S. and Brazier, R. E.: Understanding the influence of suspended solids on water quality and aquatic biota, Water Res., 42, 2849–2861, doi:10.1016/j.watres.2008.03.018, 2008. Conen, F., Zimmermann, M., Leifeld, J., Seth, B., and Alewell, C.:
Relative stability of soil carbon revealed by shifts inδ15N and C:N ratio, Biogeosciences, 5, 123–128, doi:10.5194/bg-5-123-2008, 2008.
Dawson, J. J. C., Soulsby, C., Tetzlaff, D., Hrachowitz, M., Dunn, S. M., and Malcolm, I. A.: Influence of hydrology and seasonality on DOC exports from three contrasting upland catch-ments, Biogeochemistry, 90, 93–113, doi:10.1007/s10533-008-9234-3, 2008.
Dawson, J. J. C., Tetzlaff, D., Speed, M., Hrachowitz, M., and Soulsby, C.: Seasonal controls on DOC dynamics in nested up-land catchments in NE Scotup-land, Hydrol. Processes, 25, 1647– 1658, doi:10.1002/hyp.7925, 2010.
EBP-WSB-Agrofutura: Ganzheitliche Gew¨asserplanung im Einzugsgebiet Wiggertal, Bau- und Umwelt und Wirtschaftsde-partement des Kantons Luzern und BaudeWirtschaftsde-partement des Kantons Aargau, 2005.
Fox, J. F. and Papanicolaou, A. N.: The use of carbon and nitrogen isotopes to study watershed erosion processes, J. Am. Water Resour. As., 43, 1047–1064, doi:10.1111/j.1752-1688.2007.00087.x, 2007.
Fox, J. F., Davis, C. M., and Martin, D. K.: Sediment source as-sessment in a lowland watershed using nitrogen stable isotopes, J. Am. Water Resour. As., 46, 1192–1204, doi:10.1111/j.1752-1688.2010.00485.x, 2010.
Gao, Q. Z., Tao, Z., Yao, G. R., Ding, J., Liu, Z. F., and Liu, K. X.: Elemental and isotopic signatures of particulate organic carbon in the Zengjiang River, Southern China, Hydrol. Processes, 21, 1318–1327, doi:10.1002/hyp.6358, 2007.
Gibbs, M. M.: Identifying source soils in contemporary estuarine sediments: a new compound-specific isotope method, Estuaries Coasts, 31, 344–359, doi:10.1007/s12237-007-9012-9, 2008. Greig, S. M., Sear, D. A., and Carling, P. A.: The impact of fine
sediment accumulation on the survival of incubating salmon progeny: implications for sediment management, Sci. Total Env-iron., 344, 241–258, doi:10.1016/j.scitotenv.2005.02.010, 2005. Greig, S., Sear, D., and Carling, P.: A field-based assessment of
oxygen supply to incubating Atlantic salmon (Salmo salar) em-bryos, Hydrol. Processes, 21, 3087–3100, doi:10.1002/hyp.6635, 2007a.
Greig, S. M., Sear, D. A., and Carling, P. A.: A review of fac-tors influencing the availability of dissolved oxygen to in-cubating salmonid embryos, Hydrol. Processes, 21, 323–334, doi:10.1002/hyp.6188, 2007b.
Hornberger, G. M., Bencala, K. E., and McKnight, D. M.: Hydro-logical controls on dissolved organic carbon during snowmelt in the Snake River near Montezuma, Colorado, Biogeochemistry, 25, 147–165, doi:10.1007/bf00024390, 1994.
Huber, E., Huggenberger, P., Epting, J., and Schindler Wildhaber, Y.: Zeitliche und r¨aumliche Skalen der Fluss-Grundwasser In-teraktion: Ein multidimensionaler Untersuchungsansatz – Spa-tiotemporal scales of river-groundwater interaction: A multi-dimensional investigation approach, Grundwasser, submitted, 2012.
H¨utte, M. and Niederhauser, P.: ¨Okomorphologie Stufe F. Metho-den zur Untersuchung und Beurteilung der Fliessgw¨asser in der Schweiz, Bundesamt f¨ur Umwelt, Wald und Landschaft, Mit-teilungen zum Gew¨asserschutz, 27, 1998.
Inamdar, S. P., Christopher, S. F., Mitchell, M. J.: Export mecha-nisms for dissolved organic carbon and nitrate during summer storm events in a glaciated forested catchment in New York, USA, Hydrol. Processes, 18, 2651–2661, doi:10.1002/hyp.5572, 2004.
IPPC: Climate Change 2007: The Physical Science Basis, Summary for Policymakers, Intergovernmental panel on climate change, 2007.
IUSS: World reference base for soil resources, Tech. rep., FAO, 2006.
Kendall, C. (Ed.): Isotope Tracer in Catchment Hydrology, Elsevier, Amsterdam, 1998.
Leser, H., Haas, H.-D., Meier, S., Mosimann, T., and Paesler, R.: DIERCKE W¨orterbuch Allgemeine Geographie, Deutscher Taschenbuchverlag, M¨unchen, 2005.
Liechti, P.: Methoden zur Untersuchung und Beurteilung der Fliess-gew¨asser, Chemisch-physikalische Erhebungen, N¨ahrstoffe, Umwelt-Vollzug Nr. 1005, Bundesamt f¨ur Umwelt, Bern, 2010. Malcolm, I. A., Soulsby, C., Youngson, A. F., and Petry, J.:
Het-erogeneity in ground water-surface water interactions in the hy-porheic zone of a salmonid spawning stream, Hydrol. Processes, 17, 601–617, doi:10.1002/hyp.1156, 2003.
McConnachie, J. L. and Petticrew, E. L.: Tracing organic matter sources in riverine suspended sediment: implica-tions for fine sediment transfers, Geomorphology, 79, 13–26, doi:10.1016/j.geomorph.2005.09.011, 2006.
Meybeck, M.: Carbon, nitrogen, and phosphorus transport by world rivers, Am. J. Sci., 282, 401–450, 1982.
Newcombe, C. and Jensen, J.: Channel suspended sediment and fisheries: a synthesis for quantitative assessment of risk and im-pact, N. Am. J. Fish. Manage., 16, 693–727, 1996.
Onstad, G. D., Canfield, D. E., Quay, P. D., and Hedges, J. I.: Sources of particulate organic matter in rivers from the continen-tal USA: lignin phenol and stable carbon isotope compositions, Geochim. Cosmochim. Ac., 64, 3539–3546, 2000.
Owens, P. N., Batalla, R. J., Collins, A. J., Gomez, B., Hicks, D. M., Horowitz, A. J., Kondolf, G. M., Marden, M., Page, M. J., Pea-cock, D. H., Petticrew, E. L., Salomons, W., and Trustrum, N. A.: Fine-grained sediment in river systems: environmental signifi-cance and management issues, River Res. Appl., 21, 693–717, doi:10.1002/rra.878, 2005.
Phillips, D. L. and Gregg, J. W.: Uncertainty in source par-titioning using stable isotopes, Oecologia, 127, 171–179, doi:10.1007/s004420000578, 2001.
Phillips, D. L. and Gregg, J. W.: Source partitioning using stable isotopes: coping with too many sources, Oecologia, 136, 261– 269, doi:10.1007/s00442-003-1218-3, 2003.
Phillips, D. L., Newsome, S. D., and Gregg, J. W.: Combin-ing sources in stable isotope mixCombin-ing models: alternative meth-ods, Oecologia, 144, 520–527, doi:10.1007/s00442-004-1816-8, 2005.
Phillips, J. M., Russell, M. A., and Walling, D. E.: Time-integrated sampling of fluvial suspended sediment: a simple methodology for small catchments, Hydrol. Processes, 14, 2589–2602, 2000. Pimentel, D. and Kounang, N.: Ecology of soil erosion in
ecosys-tems, Ecosysecosys-tems, 1, 416–426, doi:10.1007/s100219900035, 1998.
Ryan, P. A.: Environmental-effects of sediment on New Zealand streams – a Review, New Zeal. J. Mar. Fresh., 25, 207–221, 1991. Sch¨alchli, U.: Basic equations for siltation of riverbeds, J. Hydraul.
Eng.-Asce, 121, 274–287, 1995.
Schindler Wildhaber, Y., Michel, C., Burkhardt-Holm, P., B¨anninger, D., and Alewell, C.: Measurement of spatial and temporal fine sediment dynamics in a small river, Hydrol. Earth Syst. Sci., 16, 1501–1515, doi:10.5194/hess-16-1501-2012, 2012.
Sear, D. A., Frostick, L., Rollinson, G., and Lisle, T.: The signif-icance and mechanics of fine-sediment infiltration and accumu-lation in gravel spawning beds, Am. Fish. S. S., 65, 149–173, 2008.
Sponagel, H., Grottenthaler, W., Hartmann, K.-J., Hartwich, R., Janetzko, P., Joisten, H., Kuhn, D., Sabel, K.-J., and Traidl, R.: Bodenkundliche Kartieranleitung, Bundesanstalt f¨ur Geowis-senschaften und Rohstoffe, Hannover, 2005.
Wagner, L. E., Vidon, P., Tedesco, L. P., and Gray, M.: Stream ni-trate and DOC dynamics during three spring storms across land uses in glaciated landscapes of the Midwest, J. Hydrol., 362, 177–190, doi:10.1016/j.jhydrol.2008.08.013, 2008.
Zhang, S., Lu, X. X., Sun, H. Q., Han, J. T., and Higgitt, D. L.: Geochemical characteristics and fluxes of organic carbon in a human-disturbed mountainous river (the Luodingjiang River) of the Zhujiang (Pearl River), China, Sci. Total Environ., 407, 815– 825, doi:10.1016/j.scitotenv.2008.09.022, 2009.