Detailed estimation of desalination system cost using computerized cost
projection tools
Robert P. Huehmer
CH2M HILL, Desalination Global Technology Leader, Englewood, Colorado, USA
Abstract
For planners of new desalination plants, evaluating the potential capital and operating costs associated with the plant is a major concern. There exists a large volume of empirical data in the published literature. This data possesses significant scatter in terms of the costs of on a regional, capacity and year of construction. Several commercially available and/or non-proprietary desalination cost models currently exist in the desalination market. The cost models most frequently quoted in the grey literature are WTCost© and cost curves contained in the USBR publication entitled “Desalting Handbook for Planners”. Other models include Global Water Intelligence Desalination SWRO Cost Estimator, Desalination Economic Evaluation Program (DEEP), AUDESSY, WRA models and the Kawamura model. In this paper, the authors conduct a comparison of the results of WTCost II, GWI SWRO Cost Estimator and CH2M HILL’s proprietary cost model to identify the similarities, weaknesses and strengths of the models. The capital cost of several recent desalination plants, over a range of capacities, are compared to the cost projects made by the models. In general, the authors conclude that the models are adequate for a Class 5 cost estimate as defined by the Association for the Advancement of Cost Estimating (AACE). The author also presents insights into the future of cost estimating.
1. Introduction
[image:1.595.70.522.562.714.2]In developing business cases for desalination, project planners and desalination engineers are required to provide cost estimates on a regular basis.There is signific-ant variability in the costs provided, depending upon the approach utilized. Of particular concern, is the lack of standardization in the reporting of both CAPEX and OPEX associated with seawater desalination plants. In the generation of capital cost estimates, one of several approaches is typically utilized, as illustrated in Table 1.
Table 1. Cost Estimating Approaches utilized in seawater desalination
The “swag” – a value provided by a knowledgeable individual. Often surprisingly accurate, it is based upon experience and historical costs.
Type Tool
“The Swag” Call an expert
Empirical Models
Desalination Handbook for Planners Literature Cost Curves
Cost data bases Parametric Models
GWITM WT Cost IITM
CH2M HILL CPESTM
Factored Cost Models Material take-offs for major items, with factors applied
Material Take-Off Detailed material take-off of design drawings using Timberline TM
Empirical Cost Models – Empirical cost models are based on statistical analysis and curve-fitting of historical data, typically with capacity utilized as the key variable.
Parametric Cost Models – A parametric model utilizes a number of variables to provide, using typically a multivariate empirical or hybrid empirical/factored approached, to provide greater specificity for various applications than a parametric cost model.
Factored Cost Models – A factored cost model typically utilizes capital cost estimates for the major equipment, and then adds factors to account for the remainder of the capital costs.Very commonly used in water treatment and in oil and gas sectors. Requires some design development in order to conduct, and typically requires vendor quotations.
Material Take-off – Once significant design activity has occurred, estimators can begin counting components and provide schedules of materials, along with typical costs or quotations for each line item on the schedules. While most accurate, the design must be well developed. Most commonly used in early stage development are empirical and parametric models. The Association for the Advancement of Cost Engineering (AACE) provides recommendations on the level of accuracy that may be assigned to an estimate at any given stage of a project. Figure 1 provides details of estimate uncertainty, as well as the typical level of design detail provided.
1.1 Estimating Desalination Cost
There are three types of costs associated with desalination typically mentioned in the literature. These include the capital cost (CAPEX), operating cost (OPEX) and the Total Water Cost (TWC). Each are described below:
1.1.1 Capital Cost
Often referred to as Capital Expenditure or CAPEX, it describes the capital expenditures required to complete the project. Capital costs for a desalination plant typically are associated with the construction of the over-all infrastructure, and include the following cost components:
• Intake construction (may include wells, open intakes, sub-surface intakes)
• Brine disposal (may include outfall, injection wells, blending, evaporation ponds) • Raw water conveyance
• Pretreatment
• Desalination (including pumping, membrane racks, energy recovery etc.) • Post-treatment
• Pretreatment residuals management • Water storage and conveyance • Procurement of land
• Obtaining right-of-ways • Permitting
• Engineering • Escalation
Fig. 1. Construction Cost Estimate Accuracy Ranges (adapted from [1]).
1.1.2 Operating Cost
Operating costs, which are recurring costs, typically on an annual- or annual allotment-basis include, but are not limited to, the following cost components
• Operating and Maintenance (O&M) Labor • Energy Consumption
• Chemicals for pre-treatment, scale inhibitors, cleaning etc. • Maintenance parts
• Insurance
• Membrane replacement (typically annualized) • Cartridge filter replacement
• Laboratory analysis and monitoring • Regulatory compliance
1.1.3 Total Water Cost
2. Desalination cost modelling
2.1 Seawater desalination
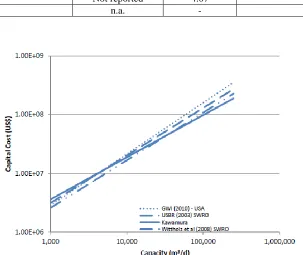
Numerous researchers have published capital cost figures for seawater desalination plants with associated empirical cost models. These figures are typic-ally used to develop empirical cost estimates typically utilized during the planning stage of a project. One of the most commonly cited cost models was developed as part of United States Bureau of Reclamation funding and is reported on by Watson et al. [2]. The model, published in the “Desalting Handbook for Planners” provides cost curves for nanofiltration, brackish reverse osmosis and seawater reverse osmosis desalination systems, based on historical data. Additionally, the model contains empirical curves for thermal processes. A number of alternative empirical cost models have been reported in the literature [3], [4], [5] and [6]. These models generally use either a polynomial equation, log-log or semi-log model for the regression analysis.
Wittholz et al. [4] analyzed desalination cost data collected from a wide variety of sources including surveys, reports, and published journals spanning a period of 35 years. Cost data was normalized to 2006 using cost indices. Using 90 sets of BWRO data and 112 sets of SWRO data, linear regression using least squares was completed to fit data to power law. The resulted empirical correlation is shown in Equation 1.
ln ( Capital cost) = m x ln (Capacity) + constant Equation 1
Other researchers have used similar regression analyses to evaluate costs of reverse osmosis desalination plants. Zhou and Tol [3] used regression analysis to construct a total water cost (TWC) model from 2,514 data points.The model derived was in general form:
F(Unit Cost) = G(Capacity, Year, Type) Equation 2
Both log-log and semi-log forms were analyzed. For a log-log model, the regression analysis accomplished a fit with a R2 of 0.72. The final model form developed was:
ln(cost) = alpha x ln(capacity) + constant + dummies Equation 3
Kawamura [5] has developed a series of cost correlations for estimating capital cost of various water treatment processes, including desalination. The cost figures utilize simple correlations based upon historical data. A capital and construction cost curves are provided for SWRO; O&M cost curves. The source of the data is not detailed by the author, but is understood to represent his personal experience. Dore [6] used an auto-aggressive integrated moving average model (ARIMA) to forecast the change in desalination unit costs over time. The model was applied to historical desalination unit cost data. It was concluded that the 2004 total water cost for desalinated water is between $0.25/m3 and $0.71/m3. A comparison of these models is presented in Table 2.
Table 2. Empirical Capital Cost Models for Reverse Osmosis.
Zhou and Tol [3] (Seawater)
Watson et al [2] (SWRO)
Wittholz et al. [4] (SWRO)
Dore [6] Kawamura
[5]
Type Log-log Power Log-log ARIMA Power
Year 2005 2003 2008 2005 2009
Equation
ln(cost) = m x ln(capacity) + constant + dummies
Cost = M(capacity)B
ln(cost) = m x ln(capacity) +
constant
(1 – B)Yi = - 0.31149899 + vi – 0.80700050 vi-1
Cost =
M(capacity)B
Units
m3/d m3/d m3/d m3/d MGD
N 1514 Not reported 112
R2 n.a. 0.907 n.a.
M Not reported 0.81
Constant Not reported 4.07
B n.a. -
Fig. 2. Capital Cost Curves for Seawater Reverse Osmosis Plants.
2.3 Total Water Cost Estimates
[image:5.595.132.435.259.514.2]A recent analysis, conducted using data published in Water Desalination Report, was conducted.
Table 3. Total Water Cost (TWC) for seawater desalination facilities [8]. Total Water Cost Capacity
Plant Year $/m3 $/kgal m3/d mgd Process
Santa Barbara California 1991 $1.22 $4.62 25,360 6.7 SWRO Bahamas 1996 $1.28 $4.84 9,840 2.6 SWRO Dhekelia Cyprus 1997 $1.19 $4.50 40,000 10.6 SWRO Larnaca Cyprus 1999 $0.76 $2.88 54,000 14.3 SWRO Taweelah C UAE 2000 $0.72 $2.73 325,000 85.9 SWRO Ashkelon Israel 2001 $0.52 $1.97 326,144 86.2 SWRO Carboneras Spain 2002 $0.57 $2.16 120,000 31.7 SWRO Point Lisas Trinidad 2002 $0.71 $2.69 119,000 31.4 SWRO Tuas Singapore 2003 $0.48 $1.82 136,360 36 SWRO Tampa Bay Florida 2004 $0.55 $2.08 95,000 25.1 SWRO Arzew Algeria 2005 $0.90 $3.41 86,000 22.7 SWRO Beni Saf Algeria 2005 $0.70 $2.65 150,000 39.6 SWRO Cap Djinet Algeria 2005 $0.73 $2.76 100,000 26.4 SWRO Douaouda Algeria 2005 $0.75 $2.84 120,000 31.7 SWRO Fukuoka Japan 2005 $1.84 $6.96 50,000 13.2 SWRO Hamma Algeria 2005 $0.82 $3.10 200,000 52.8 SWRO Los Angeles California 2005 $0.82 $3.10 94,625 25 SWRO Palmachim Israel 2005 $0.78 $2.95 110,000 29.1 SWRO Skikda Algeria 2005 $0.74 $2.80 100,000 26.4 SWRO West Basin California 2005 $0.64 $2.42 37,850 10 SWRO Blue Hills Bahamas 2006 $1.30 $4.92 27,250 7.2 SWRO Perth Australia 2006 $0.75 $2.84 143,700 38 SWRO Shuqaiq Saudi Arabia 2006 $1.03 $3.90 213,475 56.4 SWRO Tampa Bay Florida 2006 $0.84 $3.18 95,000 25.1 SWRO Carlsbad California 2007 $0.77 $2.91 189,250 50 SWRO Chennai India 2007 $1.10 $4.16 100,000 26.4 SWRO Dhekelia Cyprus 2007 $0.88 $3.33 40,000 10.6 SWRO Gold Coast Australia 2007 $1.09 $4.13 133,000 35.1 SWRO Santa Barbara California 1991 $1.22 $4.62 25,360 6.7 SWRO Hadera Israel 2007 $0.60 $2.27 330,000 87.2 SWRO Malta 2007 $0.72 $2.73 20,000 5.3 SWRO Sur Oman 2007 $1.20 $4.54 80,200 21.2 SWRO Tianjin China 2007 $0.95 $3.60 150,000 39.6 SWRO Ad Dur Bahrain 2008 $0.93 $3.52 218,000 57.6 SWRO Ashkelon Israel 2008 $0.78 $2.95 326,144 86.2 SWRO El Tarf Algeria 2008 $0.89 $3.37 50,000 13.2 SWRO Hadera Israel 2008 $0.86 $3.26 330,000 87.2 SWRO Jeddah Barge Saudi Arabia 2008 $2.27 $8.59 52,000 13.7 SWRO Mactaa Algeria 2008 $0.56 $2.12 500,000 132.1 SWRO Oued Sebt Algeria 2008 $0.68 $2.57 100,000 26.4 SWRO Palmachim Israel 2008 $0.86 $3.26 83,270 22 SWRO Ras Azzour Saudi Arabia 2008 $1.09 $4.13 1,000,000 264.2 Hybrid Taunton Massachusetts 2008 $1.53 $5.79 18,925 5 SWRO Tenes Algeria 2008 $0.59 $2.23 200,000 52.8 SWRO Tuas Singapore 2008 $0.57 $2.16 136,360 36 SWRO
Fig. 3. Unit Total Water Cost upon published data in [8].
3. Parametric cost estimating
3.1 Commercially Available Desalination Cost Estimating Models
Several commercially available and/or non-proprietary desalination cost models currently exist in the market place. The cost models most frequently quoted in the grey literature are WTCost© and cost curves contained in the USBR publication entitled “Desalting Handbook for Planners”. Other models include Global Water Intelligence Desalination SWRO Cost Estimator, Desalination Economic Evaluation Program (DEEP), AUDESSY, WRA models and the Kawamura model. Additionally, USEPA is currently working on new cost estimating guidelines to replace the guidelines developed in 1979 and updated in 1992; it has not yet been released to the public. This section focuses on capital cost comparisons between WTCost II, GWI SWRO Cost Estimator and CH2M HILL’s proprietary cost model
WTCost II is based upon research funding provided by the United States Bureau of Reclamation, where a desalination cost model was developed using Microsoft Excel as the platform. The model was subsequently commercialized as WTCost II, by I. Moch & Associates, in conjunction with W. R. Querns & Associates and Boulder Research Enterprises. The model permits the evaluation and comparison of processes employing reverse osmosis/nanofiltration, multi stage flash evaporation, multi-effect distillation, vapor compression, microfiltration/ ultrafiltration, electrodialysis and ion exchange. This program, utilizing proprietary code is, according to USBR documentation, based upon 1979 USEPA water treatment cost estimates (1978 dollars) and the 1992 Quasim updates to the 1979 costs as the basis. Processes not included in the 1979 or 1992 updates are estimated from the authors’ experience and manufacturers’ estimates. The majority of the program is based on applicable flows between 1 and 200 MGD. There has been some recent work incorporating smaller flows of 2,500 gpd to 1 MGD.
model uses the following user inputs seawater TDS, seawater temperature, degree of pretreatment required, intake/outfall requirements, second pass, remineralization, permitting effort and country.
GWI reports that it is valid over a range of flows between 250 m3/d to 250,000 m3/d. No representation is made regarding the confidence interval for the capital cost estimate.
CH2M HILL has developed a model known as CH2M HILL Parametric Cost Estimating System or CPES. The model consists of a mass balance tool and series of approximately 60 different unit process parametric models. The outputs of the appropriate parametric models and then utilized in a factored approach to develop the final capital cost values.
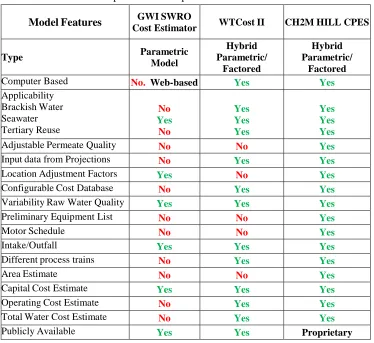
A comparison of the functionality of the models is contained in Table 4. While all three models are capable of providing CAPEX estimates, greater functionality is provided by WTCost II and CPES over the GWI SWRO Cost Estimator.
On order to compare the cost estimating tools, cost estimates for a 30,000 m3/d seawater desalination plants using beach-wells and waste injection wells were prepared. Prior to beginning the estimate, the cost databases for WTCost II and CPES were updated for the latest Engineering News Record indices. Table 5 summarizes the results. The values range between $1066 to $1400 per metre cubed of capacity.
On review of the key differences in the model, GWI Cost Estimator does not provide estimates for wells, and instead assumes open intakes and outfalls. As a result, it does not provide accurate costs for pretreatment, and likely underestimates the cost of the injection wells in particular. These values seem to offset each other. While the model remains a black-box housed on the GWI servers, it is difficult to determine the specifics of the estimate. Likewise, as no materials list is provided by WTCost II, it is difficult to delve into the specific details of the cost estimate. Nor does the model allow us to readily adjust costs for location factors etc. The costs associated with well development do appear to be low which may result in the low cost estimate. CPES generates detailed piping calculations, layout and materials lists, permitting estimating professionals the ability to check and confirm the bottom up cost estimate as design progresses.
Table 4. Comparison of Computerized Cost Model Features.
Model Features Cost Estimator GWI SWRO WTCost II CH2M HILL CPES
Type Parametric
Model Hybrid Parametric/ Factored Hybrid Parametric/ Factored Computer Based No. Web-based Yes Yes
Applicability Brackish Water Seawater Tertiary Reuse No Yes No Yes Yes Yes Yes Yes Yes
Adjustable Permeate Quality No No Yes Input data from Projections No Yes Yes
Location Adjustment Factors Yes No Yes Configurable Cost Database No Yes Yes
Variability Raw Water Quality Yes Yes Yes
Preliminary Equipment List No No Yes
Motor Schedule No No Yes
Intake/Outfall Yes Yes Yes
Different process trains No Yes Yes
Area Estimate No No Yes
Capital Cost Estimate Yes Yes Yes
Operating Cost Estimate No Yes Yes
Total Water Cost Estimate No Yes Yes
[image:9.595.112.486.73.416.2]Publicly Available Yes Yes Proprietary
Table 5. Comparison of CAPEX estimates using computerized Cost Estimating Tools. GW
I
WTCost II CH2M HILL CPES
Capacity 30,000 30,000 30,000
CAPEX ($) $41,000,000 $32,000,000 $42,000,000
Unit Cost ($/m3) $1366/m3 $1066/m3 $1400/m3
Platform Web-based MS Access w/VB MS Excel w/VB
4. CH2M HILL Parametric Cost Estimating System (CPES)
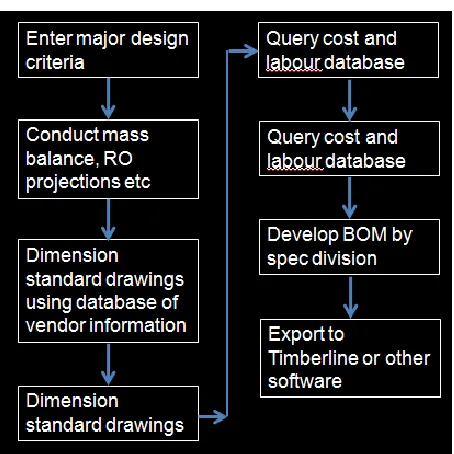
CPES is a cost estimating system that interfaces reverse osmosis projection software, mass-balance generator, cost data base and Computer Aided Design (CAD) software into a system to provide conceptual cost estimates. Based on an EXCEL platform, users set-up the basic plant configuration and conduct RO projections using the embedded Visual Basic code, which includes modules for energy recovery devices. The resultant mass-balances and design criteria are used for the basis of generating a high-level material take-off and cost estimates. A basic schematic of the work-flow is shown in Figure 4.
Fig. 4. Flow-chart for the CPES estimating system.
Fig. 5. Plant layout for a Reverse Osmosis system generated by CPES.
Fig. 6. Isometric drawing for a Reverse Osmosis system generated by CPES.
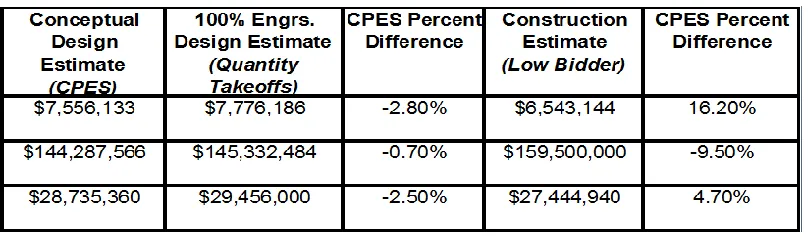
[image:10.595.91.505.318.438.2] [image:10.595.88.506.463.633.2]Table 6. Comparison of CAPEX estimates using CPES versus bid prices.
5. Design Driven Cost Estimating System
The development and accuracy of CPES provides insight into the total power of future cost estimating systems. A number of companies have developed internal proprietary programs for the rapid design development of water treatment systems. USFILTER created an early prototype of a mass balance solution that selected standard equipment from their product line to incorporate into their process.
While this program could not conduct balance of plant cost estimating, it did incorporate RO projection capability and permit rapid development of costs for major process/mechanical equipment.
Developed independently of USFilter, Glegg Water Conditioning created the Reference Design program in the 1990s. This program included the functionality of USFilter’s program, but also was able to automatically generate process & instrumentation drawings, process mechanical drawings and create accurate material take-offs.
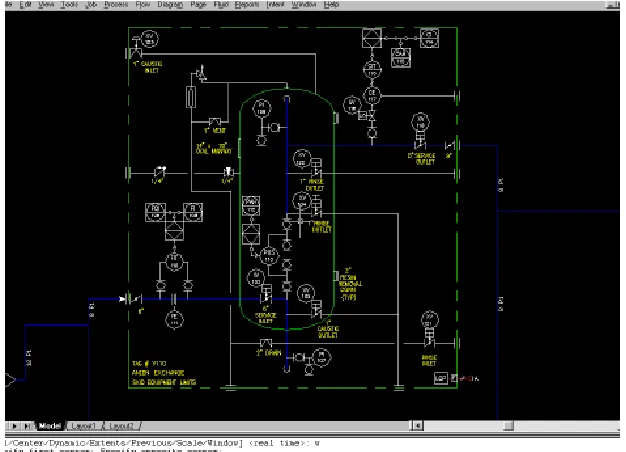
Such tools were developed within the platforms of the era. Figures 7 through 9 shows a system developed within an AutoCAD platform. Using the tool, very rapid development of a custom engineered process could be developed. Figure 6 shows a typical input page for an ion exchange vessel.
Fig. 7. Input page for an ion exchange vessel as part of an ultrapure water solution.
Fig. 8. P&ID automatically developed from user inputs and system modelling. References
[1] AACE 18-R-87 accessed 8/8/2011 http://www.aacei.org/
[2] Watson et al. (2003). “Desalting Handbook for Planners, 3rd Edition” U.S. Department of the Interior, Bureau of Reclamation Technical Service Center Water Treatment Engineering and Research Group Cooperative Assistance Agreement Number: 98-PG-81-0366, Desalination Research and Development Program Report No. 72 http://www.usbr.gov/pmts/water/media/pdfs/report072.pdf
[3] Zhou, Y., and R. S. J. Tol (2005), Evaluating the costs of desalination and water transport, Water Resour. Res., 41, W03003, doi:10.1029/2004WR003749
[4] Wittholz, M.K., B.K. O'Neill, et al. (2008). "Estimating the cost of desalination plants using a cost database." Desalination 229(1-3): 10-20.
[5] Kawamura, S and McGivney, W (2008). Cost Estimating Manual for Water Treatment Facilities. Wiley. [6] Dore, M.H.I. (2005). "Forecasting the economic costs of desalination technology." Desalination 172(3): 207-214
[7] Nicot et al (2005) A Desalination Database for Texas Prepared for Texas Water Development Board Under Contract No. 2004-483-021 Jean-Philippe Nicot, Steven Walden1, Lauren Greenlee2, and John Els
[image:12.595.134.447.323.549.2]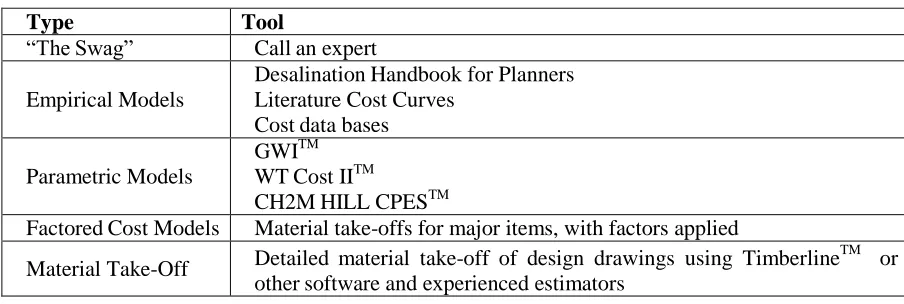
![Fig. 1. Construction Cost Estimate Accuracy Ranges (adapted from [1]).](https://thumb-us.123doks.com/thumbv2/123dok_us/8132508.242679/3.595.99.492.76.370/fig-construction-cost-estimate-accuracy-ranges-adapted.webp)
![Table 3. Total Water Cost (TWC) for seawater desalination facilities [8].](https://thumb-us.123doks.com/thumbv2/123dok_us/8132508.242679/6.595.111.487.124.713/table-total-water-cost-twc-seawater-desalination-facilities.webp)
![Fig. 3. Unit Total Water Cost upon published data in [8].](https://thumb-us.123doks.com/thumbv2/123dok_us/8132508.242679/7.595.149.453.68.232/fig-unit-total-water-cost-published-data.webp)