Physics and Astronomy Publications
Physics and Astronomy
2-2007
Fluctuations and patterns in nanoscale surface
reaction systems: Influence of reactant phase
separation during CO oxidation
Da-Jiang Liu
Ames Laboratory, [email protected]
James W. Evans
Iowa State University, [email protected]
Follow this and additional works at:
http://lib.dr.iastate.edu/physastro_pubs
Part of the
Mathematics Commons
, and the
Physical Chemistry Commons
The complete bibliographic information for this item can be found athttp://lib.dr.iastate.edu/physastro_pubs/204. For information on how to cite this item, please visithttp://lib.dr.iastate.edu/howtocite.html.
Fluctuations and patterns in nanoscale surface reaction systems: Influence
of reactant phase separation during CO oxidation
Abstract
A realistic atomistic model is used to assess spatiotemporal behavior in nanoscale CO oxidation systems at
higher pressures than for traditional ultrahigh vacuum studies. The strong influence of adspecies interactions
in this regime of high reactant coverages leads to phase separation between oxygen-rich and CO-rich reactive
states. Time-series studies reveal fluctuation-induced transitions between these states, as well as transitions
between reactive and inactive states. In addition, we observe flickering spatial patterns with sharp boundaries.
Disciplines
Mathematics | Physical Chemistry
Comments
This article is from
Physical Review B
75 (2007): 073401, doi:
10.1103/PhysRevB.75.073401
. Posted with
permission.
Fluctuations and patterns in nanoscale surface reaction systems: Influence of reactant phase
separation during CO oxidation
Da-Jiang Liu1and J. W. Evans1,2
1Ames Laboratory–USDOE, Iowa State University, Ames, Iowa 50011, USA 2Department of Mathematics, Iowa State University, Ames, Iowa 50011, USA
共Received 30 November 2006; published 2 February 2007兲
A realistic atomistic model is used to assess spatiotemporal behavior in nanoscale CO oxidation systems at higher pressures than for traditional ultrahigh vacuum studies. The strong influence of adspecies interactions in this regime of high reactant coverages leads to phase separation between oxygen-rich and CO-rich reactive states. Time-series studies reveal fluctuation-induced transitions between these states, as well as transitions between reactive and inactive states. In addition, we observe flickering spatial patterns with sharp boundaries.
DOI:10.1103/PhysRevB.75.073401 PACS number共s兲: 82.40.Np, 68.43.Jk, 82.65.⫹r
Catalytic reactions have been studied extensively by the surface science community mainly on extended single-crystal surfaces. However, recent interest has turned to analysis of reactions in nanoscale systems, e.g., on supported metal clusters1 or on metal field emitter tips 共FET’s兲 with
facet linear dimensions of⬃10 nm.2In these systems,
fluc-tuation effects occur specifically due to their small size. For example, CO oxidation on extended surfaces typically exhib-its robust bistability. Stable reactive and near-CO-poisoned inactive states coexist in some region of the 共P,T兲-plane, where P denotes a suitable partial pressure and T denotes surface temperature. This bistability derives from the nonlin-ear Langmuir-Hinshelwood kinetics together with long-range spatial coupling due to facile CO surface diffusion.3,4
How-ever, experimental studies for nanoscale systems suggest a loss of bistability due to noise-induced transitions between stable branches.1,2One might also anticipate the occurrence
of nonequilibrium critical phenomena near the cusp point which terminates the bistable region.3,5
At lowerPor higherT, the high mobility, low coverages, and weak effective interactions for reactant adspecies imply that mean-field-type dynamics is operative. Nanoscale fluc-tuation behavior in this regime has been analyzed by 共i兲 mean-field birth-death-type master equations and corre-sponding stochastic Gillespie-type simulations for the evolu-tion of numbers of reactant adspecies; and共ii兲kinetic Monte Carlo共KMC兲simulation of hybrid models with a mean-field treatment of infinitely mobile CO and a lattice-gas treatment of oxygen incorporating minimal adspecies interactions.2,5–8
Such analyses reveal that the rate of transitions between stable branches decreases exponentially with system size 共surface area兲. These analyses also quantify the enhancement of transitions near the cusp point.6
However, field-ion or field-emission microscopy studies of fluctuations in reactions on metal FET’s are often per-formed at lowerTdown to 300 K.2,9–11In reaction studies on
supported nanoclusters where fluctuation effects are also important,1 the ultimate goal is to elucidate behavior at
higherPcloser to industrial conditions.12In such regimes of
higher P or lower T, the effect of adspecies interactions within the higher-coverage reactant adlayers will generally produce additional strongly non-mean-field phenomena which can only be described by more complex and realistic atomistic modeling. The example on which we focus here is
the occurrence and experimental ramification of equilibrium-type phase transitions corresponding to phase separation of reactants into oxygen-rich and intermixed reactive states.
In this paper, we use a realistic atomistic multisite lattice-gas model to explore CO oxidation in nanoscale systems at higher Por lower T. KMC simulations of the model reveal the existence of reactant phase separation, and are used to assess its influence on both fluctuation behavior and spatial pattern formation. First, time series for coverages are shown to display well-defined fluctuation-induced transitions be-tween two phase-separated reactive states. These transitions, which appear similar to those observed in studies on metal FET’s, have distinct characters from transitions in mean-field-type models. Second, strong adspecies interactions pro-duce fluctuating spatial patterns which are sharp on the atomic scale. This contrasts reaction-diffusion patterns on extended surfaces under typical low-pressure conditions which are smeared on the scale of microns.3
The atomistic lattice-gas model utilized in this study has been constructed to provide a realistic description of CO oxi-dation on unreconstructed metal共100兲 substrates.13 In
addi-tion to an appropriate descripaddi-tion of CO adsorpaddi-tion- adsorption-desorption kinetics, and dissociative adsorption kinetics for O2, the selected adspecies interactions are chosen to recover observed adlayer ordering. However, just as significant for the current study is the feature that adsorbates can reside on different types of sites. This latter feature together with the inclusion of appropriate short-range exclusion or repulsion between CO and O facilitates reactant phase separation at sufficiently high adspecies coverages. Parameters in our modeling are chosen for CO + O / Pd共100兲:13O sits on hollow
sites; CO sits on bridge sites at lower coverage and hollow sites at higher coverages 共especially under reaction condi-tions兲; the model recovers the observed c共2
冑
2 ⫻冑
2兲R45° -CO ordering, andp共2⫻2兲-O andc共2⫻2兲-O or-dering, as well as temperature-programmed desorption spec-tra; reaction configurations and activation barriers were based on density functional theory predictions. However, we remark that the basic feature of the model of interest here, specifically reactant phase separation, should be somewhat generic.In presenting results below, for convenience we define effective partial pressuresP˜ for CO and O2 as the impinge-ment rate times the low-coverage sticking coefficient of CO
PHYSICAL REVIEW B75, 073401共2007兲
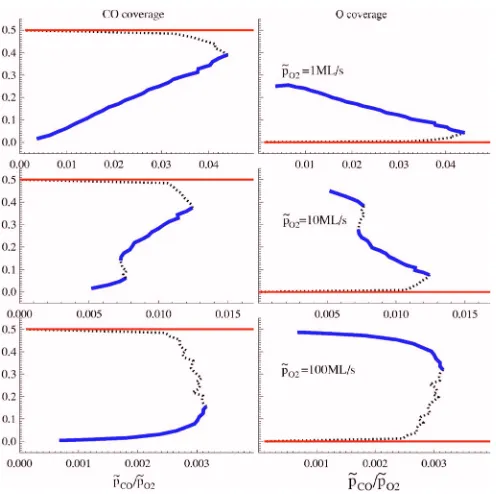
and O2on a clean surface. Figure1shows the dependence on the ratio of effective partial pressures of the steady-state cov-erages for the reaction at 350 K for a “perfect” 32⫻32 site system with periodic boundary conditions. Results were ob-tained from constant CO-coverage simulations14 which can
access both stable and unstable steady states. For low P˜O 2
= 1 ML/ s, the coverage displays the traditional S shape for a bistable system with a stable inactive state 共with high CO coverage CO⬇0.5 ML兲 and a stable reactive state 共with lowerCO兲. However, increasing P˜O2 to 10 ML/ s, a discon-tinuous jump develops in the reactive branch of the
steady-state coverages. This is indicative of equilibrium-like phase separation between two reactive states. The first is a c共2 ⫻2兲-O ordered state with low CO and high O, and the second is a disordered state with moderateCOandO. See Fig.2. Further increasingP˜COto 100 ML/ s, this discontinu-ity expands towards the inactive state, and the second reac-tive phase becomes unstable.
As an aside, we note that our simulations were performed with CO hop rates below physical values to enhance compu-tational efficiency. These hop rates must be far above other rates to correctly describe local adlayer equilibration. We typically usehCO= 103– 104s−1 for hopping of isolated CO.
Studies on FET’s have the major advantage over other techniques in that one can monitorin situin real-time fluc-tuations in quantities related to reactant coverages. Thus, we next present in Fig.2simulated time series for the CO cov-erage at 350 K with˜PO2= 10 ML/ s 共noting that similar be-havior is exhibited by the O coverage and other quantities兲. We choose ˜PCO/˜PO= 0.076 corresponding to the value for phase separation. Then, well-defined transitions caused by internal fluctuations can be observed between the two reac-tive phases. The resulting CO-coverage distribution has a bimodal distribution where the two peaks have roughly equal weight. As P˜CO/P˜O deviates slightly from this value, the distribution quickly becomes very skewed towards the true stable reactive state共the other being at best metastable兲.
One should also expect this model to produce distinct spontaneous transitions between the reactive and near-CO-poisoned phases. This should result in an associated bimodal coverage distribution with roughly equal weighted peaks near the appropriate equistability pressure 共P˜CO/P˜CO ⬇0.011 for P˜O
[image:4.612.51.299.53.300.2]2= 10 ML/ s at T= 350 K兲. However, at T= 350 K, CO desorption is strongly inhibited and the near-CO-poisoned phase with almost perfectc共2
冑
2⫻冑
2兲R45° or-dering is practically an absorbing state implying a very long residence time between transitions. To observe these transi-tions in a reasonable time frame, one can either introduceFIG. 1.共Color online兲Steady state coverage of CO and oxygen for CO oxidation on Pd共100兲 at T= 350 K. Blue lines represent stable reactive states, and red lines represent the stable CO-poisoned state. Dotted lines represent the unstable state.
FIG. 2. Top left: fluctua-tions in CO coverage for CO oxi-dation in a 16⫻16 site system at
T= 350 K withP˜O2= 10 ML/ s and P
˜
CO= 0.076 ML/ s. Top right: the
corresponding CO coverage distri-bution. Bottom: state of the ad-layer at different times共indicated兲 corresponding to oxygen-rich and CO-rich reactive states. CO: closed circles, oxygen: open circle.
BRIEF REPORTS PHYSICAL REVIEW B75, 073401共2007兲
[image:4.612.51.366.510.744.2]“defects” or reduce the system size or increase the tempera-ture closer to the cusp point. Figure3shows the steady-state coverage versus partial pressure for higher T= 440 K with
P ˜
O2= 10 ML. Also shown are transitions in the CO coverage
between the reactive and inactive states as well as the corre-sponding coverage bimodal distribution choosing P˜CO/P˜CO close to the shifted equistability point.
Next, we provide a more detailed picture of the transitions discussed above. In a mean-field analysis of transitions in a perfect共defect free兲bistable reaction system, transitions oc-cur “homogeneously” as a result of coverage fluctuations. The mean-field kinetics produces an effective potential bar-rier per unit area, ␦Veff, to transitions which vanishes ap-proaching the bistability cusp. The rate of transitions is given by k⬃exp共−Eeff兲, with Eeff=L2␦Veff, and thus decreases strongly with system size.6 This picture applies for
transi-tions between reactive and inactive states. In contrast, tran-sitions associated with reactant phase separation are not ho-mogeneous. Patches of the O-rich reactive phase can nucleate within the intermixed reactive phase separated by a sharp phase boundary共and visa versa兲. In an extended sys-tem, these droplets would eventually shrink and disappear due to the effects of interface tension. However, in a nanos-cale system they are likely to grow共randomly兲and take over the entire system corresponding to an observed transition. In this scenario, one has Eeff⬃L scaling with phase boundary length, so the transition rate does not decrease as quickly with increasing system size, a feature consistent with our simulated time series.
Some important aspects of experimental studies on FET’s not addressed above are considered below. Often hysteresis analyses are performed in FET or conventional surface reac-tion studies where either temperature or a suitable partial pressure is swept back and forth across the bistable region. The resulting hysteresis loop is used to map out the bound-aries of the bistable region, an approach which assumes both
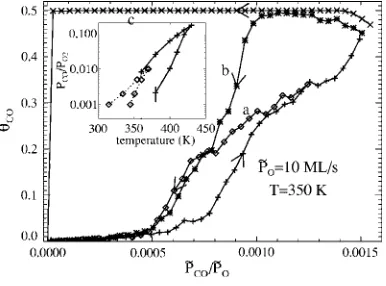
robust bistability and facile relaxation to stable states共on the time scale of sweeping兲. Figure 4 shows CO-coverage be-havior atT= 350 K obtained by sweepingP˜CO共starting from 0兲 for fixedP˜O
2= 10 ML/ s. If one letsCOincrease to only
[image:5.612.52.373.54.309.2]0.35 ML so that the system is far from CO poisoned, one obtains a hysteresis loop associated with reactant phase sepa-ration whose width reflects slow relaxation on the time scale of sweeping. The lower branch 共pluses兲 is characterized by long range c共2⫻2兲-O layers, mixed with small amount of CO. The upper branch共a: diamonds兲is characterized by in-termingled CO and O patches with local ordering. In con-trast, if one letsCOincrease near its inactive state value of 0.5 ML, then the upper branch 共c: crosses兲 corresponds to near-perfect c共2
冑
2⫻冑
2兲R45° -CO ordering and persists to near P˜CO= 0. The hysteresis loop then does reflect reactionFIG. 4. Hysteresis analysis at 350 K withP˜O2= 10 ML/ s for a
[image:5.612.342.535.504.647.2]32⫻32 site system with each data point averaged over 40 s. The three branches for the reverse sweep start from the stable reactive phase共a兲; the CO-poisoned phase with共b兲and without共c兲domain boundaries. Inset, bifurcation diagrams obtained from sweeps of type共c兲corresponding to typical “reaction bistability”共solid lines兲, and of type共a兲reflecting phase separation of the reactive state共 dot-ted lines兲.
FIG. 3. 共Color online兲 Top: steady-state coverage of CO and oxygen for CO oxidation at T
= 440 K with˜PO2= 10 ML/ s.
Bot-tom: fluctuations in CO coverage for CO oxidation in a 16⫻16 site system under the above conditions with˜PCO= 3.7 ML/ s.
BRIEF REPORTS PHYSICAL REVIEW B75, 073401共2007兲
bistability, and repeating this scan for different conditions allows one to map the bistability region共inset of Fig.4兲.
If during the hysteresis sweep, the system is unable to reach the near perfectc共2
冑
2⫻冑
2兲R45° -CO ordered inactive state共either due to some persistent domain boundary, or due to model modification to include “defect sites” inhibiting such ordering兲, then a narrower hysteresis loop results. Be-havior for a domain boundary关共b兲asterisks兴is also shown in Fig.4. Indeed, more generally, we find that introduction of various types of defects significantly shrinks the bistability region, consistent with experimental observations.1Finally, we comment on two specific aspects of the ex-perimental time-series studies of fluctuation-induced transi-tions and associated bimodal distributransi-tions. First, these stud-ies can be coupled with a hysteresis analysis to conveniently identify regions of parameter space where a bimodal distri-butions will be observed 共i.e., the middle of the hyster-esis loop兲.2Without the hysteresis data, it is difficult to
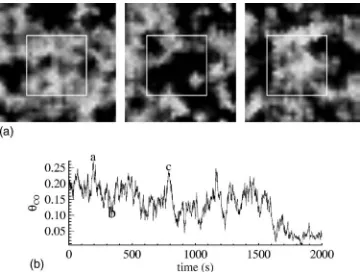
de-termine the 共P,T兲 parameters producing such distributions. Second, in experimental studies, the time-series data often correspond not to coverage behavior on an entire nanofacet, but rather on a subwindow of such a facet. This introduces additional nuances to time-series interpretation. To illustrate these issues, we perform additional hysteresis simulations on a 32⫻32 site system with T= 350 K and P˜O
2= 10 ML/ s
and extract real-space configurations for the entire system and time series for the CO coverage in a 16⫻16 site sub-window over a time interval which includes sweeping across the equilibrium phase transition 共˜PCO/˜PO decreasing from 0.007 to 0.005兲. The time-series displays large transitionlike fluctuations, but their characterization is rather distinct from above.
From Fig.5, one can see that the system is characterized by interconnected CO and oxygen rich patches roughly cor-responding to the two coexisting reactive states. During the time shown in Fig.5, patches “flicker” in and out of exis-tence from the subwindow, leading to strong fluctuations in CO coverage. The “flickering” has two components: reaction which causes the patches to grow or shrink and interconvert; diffusion which causes the patches to move around in and out of the window. The former drives the transitions
dis-cussed in Fig.2, but the latter can dominate behavior when time series come from a subwindow and can also potentially produce transitions on a much shorter time scale.
It should be emphasized that this picture relies on the coexistence of nanometer-sized patches of different types separated by atomically sharp boundaries or interfaces. Most studies of reaction-diffusion systems have considered the mean-field regime of higherTor lowerP where boundaries between coexisting states are diffuse 共on the scale of mi-crons兲. The occurrence of sharp boundaries in our studies reflects the different conditions where interactions are strong and phase separation can occur.
In summary, fluctuation behavior and pattern formation is shown to be more complex in nanoscale reaction systems at higher P than in previous mean-field reaction modeling. However, with application of a realistic atomistic model, we can capture behavior which derives from reactant phase separation.
This work was supported by the Division of Chemi-cal Sciences, USDOE-BES. It was performed at Ames Laboratory, operated for the USDOE by ISU under Contract No. W-7405-Eng-82.
1V. Johánek, M. Laurin, A. W. Grant, B. Kasemo, C. R. Henry, and
J. Libuda, Science 304, 1639共2004兲.
2Y. Suchorski, J. Beben, E. W. James, J. W. Evans, and R. Imbihl,
Phys. Rev. Lett. 82, 1907共1999兲.
3R. Imbihl and G. Ertl, Chem. Rev.共Washington, D.C.兲 95, 697
共1995兲.
4J. W. Evans, D.-J. Liu, and M. Tammaro, Chaos 12, 131共2002兲.
5D.-J. Liu, N. Pavlenko, and J. W. Evans, J. Stat. Phys. 114, 101
共2004兲.
6D.-J. Liu and J. W. Evans, J. Chem. Phys. 117, 7319共2002兲.
7V. P. Zhdanov and B. Kasemo, Surf. Sci. Rep. 39, 25共2000兲.
8M. Pineda, R. Imbihl, L. Schimansky-Geir, and C. Zülicke,
J. Chem. Phys. 124, 044701共2006兲.
9M. F. H. van Tol, A. Gielbert, and B. E. Nieuwenhuys, Catal.
Lett. 16, 297共1992兲.
10V. Gorodetskii, J. H. Block, W. Drachsel, and M. Ehsasi, Appl.
Surf. Sci. 67, 198共1993兲.
11V. V. Gorodetskii, V. I. Elokhin, J. W. Bakker, and B. E.
Nieu-wenhuys, Catal. Today 105, 183共2005兲.
12J. Libuda and H.-J. Freund, Surf. Sci. Rep. 57, 157共2005兲.
13D.-J. Liu and J. W. Evans, J. Chem. Phys. 124, 154705共2006兲.
[image:6.612.347.527.56.192.2]14R. M. Ziff and B. J. Brosilow, Phys. Rev. A 46, 4630共1992兲.
FIG. 5. Top: snapshots from a hysteresis simulation of CO oxi-dation in a 32⫻32 site system at three different times labeled bya,
b, andcin the bottom frame. Lighter color means higher CO cov-erage. Bottom: CO coverage for the 16⫻16 site subsystem indi-cated by a white square.
BRIEF REPORTS PHYSICAL REVIEW B75, 073401共2007兲