Ann. Geophys., 32, 1223–1231, 2014 www.ann-geophys.net/32/1223/2014/ doi:10.5194/angeo-32-1223-2014
© Author(s) 2014. CC Attribution 3.0 License.
E layer dominated ionosphere observed by EISCAT/ESR radars
during solar minimum
Hongtao Cai1,2, Fei Li1,2, Ge Shen1,2, Weijia Zhan1,2, Kangjun Zhou1,2, Ian Willian McCrea3, and Shuying Ma1,2 1Department of Space Physics, School of Electronic Information, Wuhan University, Wuhan, 430072, China
2Key Laboratory of Geospace Environment and Geodesy, Ministry of Education of PRC, Wuhan, 430072, China 3Space Science and Technique Department, Rutherford Appleton Laboratory, Chilton, Oxfordshire, OX11 0QX, UK Correspondence to: Hongtao Cai ([email protected])
Received: 3 January 2014 – Revised: 22 July 2014 – Accepted: 8 September 2014 – Published: 10 October 2014
Abstract. According to the study by Mayer and Jakowski (2009), periods of E layer dominated iono-sphere (ELDI) are defined as being characterized by vertical electron density profiles having a maximum density at E layer altitudes. In this paper, characteristics of ELDI intervals have been investigated, focusing on their temporal variations, using field-aligned measurements from the EIS-CAT and ESR radars during the interval 2009–2011. ELDI events were identified using simple but reasonable criteria, in which a minimal duration was required to exclude possible “fake” events induced by random errors in measurements. It was found that ELDIs were observed more often in winter and earlier spring than other seasons, especially in the auroral zone. The occurrence of ELDI intervals peaks around geomagnetic midnight at auroral latitudes, while it reaches a maximum around geomagnetic local noon at the latitude of the ESR. Our results imply that ELDI intervals appear to be a sporadic rather than a regular phenomenon, in disagreement with previous results inferred from radio occultation measurements. The discrepancy between the typical durations of ELDI events observed by the two radars is remarkable, being 30 min on average at Tromsø but about a half of this at Svalbard. During intervals of ELDI, the mean thicknesses of the E layer are quite close at the two sites, as are the values of HmE and the ratio of NmE/NmF2. Case studies confirm that either extra E layer ionization or F layer density depletion alone could lead to the presence of ELDIs. Based on a careful check on ELDI intervals of various types, however, we suggest that both of them play a critical role in ELDI formation.
Keywords. Ionosphere (ionospheric irregularities; polar ionosphere)
1 Introduction
The terrestrial ionosphere is formed by the ionization of the atmosphere, due to solar EUV and X-ray radiations and, mainly at high-latitudes, by energetic particles impinging on the atmosphere from the magnetosphere. The ionosphere is coupled closely with both the magnetosphere and the ther-mosphere in which it is immersed. This leads the ionosphere to vary significantly and a number of anomalies have been reported. Some of these anomalies arise mainly due to tem-poral variations, such as the winter anomaly and the semi-annual anomaly (e.g. Yonezawa and Arima, 1959; Yonezawa, 1971; Cai et al., 2007). There are also some phenomena re-lated to ionospheric spatial structure, including the equatorial anomaly (e.g. Liang, 1947), sporadic E (Es)(e.g. Mathews, 1998) and spread F (e.g. Farley et al., 1970). Recently, Mayer and Jakowski (2009) found that ionospheric profiles in the polar region sometimes have their maximum density at E layer altitude, which was identified as another class of anomaly: E layer dominant ionosphere (ELDI). Esformation or other types of ionization were not distinguished in the con-cept of ELDI. Investigations of these ionospheric anomalies are not only of basic importance in understanding and fore-casting space weather, but also have significant applications in radio propagation and communication.
occurrence was distributed symmetrically around the mag-netic pole and that the shape of the spatial distribution could be approximated by an ellipse. The contribution of geomag-netic activity to ELDI occurrence was found to be significant, especially during nighttime.
Four years later, Wu et al. (2013) extended the work by comparing the spatial distributions of ELDIs in the Arctic and Antarctic during solar minimum. Four-year RO mea-surements from COSMIC in winter during the period 2007– 2010 were used. It was found that the spatial distribution of ELDI coincided with the location of the auroral oval for both hemispheres. The authors claimed that these observed ELDIs were mainly caused by energetic particle precipitation in the auroral zone. Based on RO measurements, Wu et al. (2013) found that ELDI occurrence was up to 90 % in the nighttime auroral zone, whilst Mayer and Jakowski (2009) claimed that ELDI was a regular phenomenon in darkness.
Previous reports about ELDIs have mainly focused on their spatial distribution, whilst their temporal variations are poorly understood. Because of the way that satellite data are sampled, temporal resolution at a fixed point is rather low and it is hard to gain a clear picture of the process from the appearance to the disappearance of an ELDI from RO mea-surements alone. In addition, the seasonal and diurnal varia-tions of ELDIs are still not clear, though these are important for understanding the formation mechanism of ELDIs.
Ground-based incoherent scatter (IS) radar can provide successive electron density vertical profiles with rather high time resolution. The European Incoherent Scatter (EISCAT; 69.6◦N, 19.2◦E) radar is located beneath the auroral oval for an extended interval, whilst the EISCAT Svalbard radar (ESR; 78◦N, 16◦E) crosses the cusp during the daytime and
lies within the polar cap during the nighttime (e.g. Cai et al., 2007). Both of the radars are designed to regularly probe ionospheric properties, including electron density and tem-perature, along the local geomagnetic field line, with about 2-minute resolution. The operating modes of the two radars thus make it possible for us to investigate the characteristics of ELDIs from a new viewpoint, focusing on their seasonal variation, diurnal variation and duration.
In this paper, a survey of ELDI characteristics is carried out with help of field-aligned measurements from the EIS-CAT UHF radar at Tromsø and the ESR 42 m dish at Sval-bard. Our work reveals some novel features and sheds more light on the possible formation mechanism of ELDIs. The data set used in the present work and the criteria used to de-fine ELDI are introduced in Sect. 2. Detailed results are pre-sented in Sect. 3 and discussed in Sect. 4, followed by a brief summary.
2 Data analysis
Field-aligned measurements made by the EISCAT/ESR radars during 2009–2011 are used in the present work.
Figure 1. Distribution of field-aligned measurements from
EISCAT/ESR radars with (a) year, (b) month and (c) UT
(LT≈UT+1 h, MLT≈UT+3 h).
Figure 1 displays numbers of EISCAT/ESR observation pe-riods, which have been used in present study, broken down by year (panel a), month (panel b) and UT (panel c), re-spectively. Only time sequences of successive radar measure-ments with lengths between 4 h and 1 day are included. There are far fewer field-aligned observations available for April, June and July from the ESR site. For Tromsø, however, there are more than 20 days of field-aligned measurements in most months, with only April having fewer than 10 days (Fig. 1b). This data set provides us a good opportunity to figure out the seasonal variation of ELDI occurrence. Most of the ob-servations were made under geomagnetic quiet conditions and only 3 days of measurements from the EISCAT radar were accomplished during days with a Dst index lower than
−101 nT.
Figure 1c shows the number of observation intervals as a function of UT for both radars. It is easy to calculate the ap-proximate magnetic local time from MLT≈UT+3 h and the local time from LT≈UT+1 h. The diurnal coverage of radar measurements, while somewhat variable for both radars, is sufficient even for a study of this kind. For most universal times, there are more than 50 days of radar measurements. For the EISCAT radar, the number of observations mini-mizes at 07:00 UT (10:00 MLT) and has a peak of 160 days at 13:00 UT (16:00 MLT). At the ESR site, the peak num-ber of radar observations appears slightly earlier, at around 10:00 UT (13:00 MLT) and the minimum is around 03:00 UT (06:00 MLT).
Hongtao Cai et al.: E layer dominated ionosphere observed by EISCAT/ESR radars 1225
3σ were also removed in order to avoid possible mistakes in identifying the density peaks of the E layer and F layer.
In present work, an ELDI event was identified from suc-cessive time series of electron density profiles, provided that all of the following conditions were met:
1. Peak density of the E layer (NmE) is larger than that of the F layer (NmF2).
2. Peak height of the E layer (HmE) is in the range of 90– 140 km.
3. Duration of the event is no shorter than 6 min.
The first two criteria are basically similar to those adopted by Mayer and Jakowski (2009) and Wu et al. (2013), whilst the last one has been applied to exclude possible “fake” events induced by random errors in observations. Compared to radio occultation measurements, the advantage of ground-based instrument observations is their capability to determine the duration of an ELDI event. The time resolution of the radar measurements is 2 min. The minimal ELDI duration of 6 min was adopted somewhat arbitrarily, although it did a good job in practice, as we will show in the following sections.
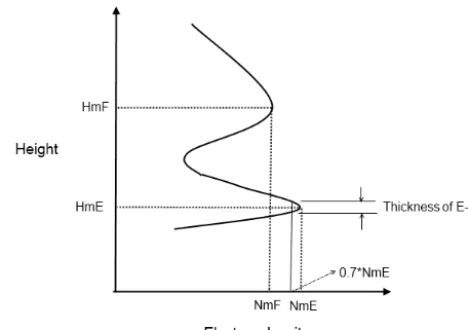
Once an ELDI event was identified, some important prop-erties were measured and recorded for further analysis. Fig-ure 2 shows an illustration of an ELDI profile. The peak den-sities (NmF2and NmE) and peak heights (HmF2 and HmE) are defined as usual. The thickness of the E layer is defined as being the difference between the two altitudes at which the electron density firstly drops to 70 percent of NmE, upwards and downwards. In addition, we define the ratio of NmE and NmF2during an ELDI event:
rEF=
NmE NmF2
. (1)
According to the definition of ELDI, the value ofrEFshould be larger than one. To some extent, the parameterrEF quan-tifies the magnitude of an ELDI.
3 Observations
We identified 428 and 164 valid ELDI events from the field-aligned measurements during 2009–2011 of the EISCAT UHF and ESR radars, respectively. Effects from geomagnetic activity are negligible, since this period covers a prolonged solar minimum, and only 8 ELDI events were detected by EISCAT radar during 3 days with a Dst index lower than
−101 nT. Individual checks of these storm-time ELDIs re-vealed no remarkable difference from the others. The num-ber of ELDI intervals over Svalbard is far less than that at Tromsø, partly owing to the smaller number of observations from the ESR site (Fig. 1a).
[image:3.612.312.546.66.231.2]In the following subsections, a survey of these ELDI events and their properties is presented.
Figure 2. An illustration of some characteristics parameters during
the presence of ELDI. See text for details.
3.1 Occurrence of ELDI
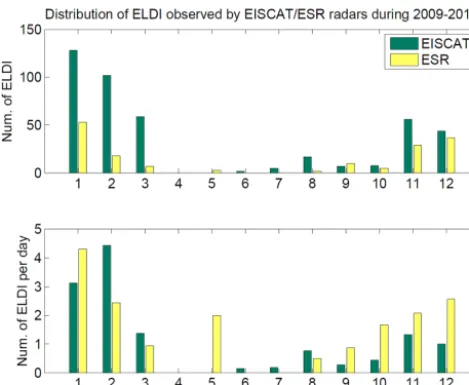
The number of ELDIs in each month observed by EIS-CAT/ESR radars is displayed in Fig. 3a. Generally, more ELDI events were recorded by the EISCAT mainland radar. Readers must keep in mind that the numbers of field-aligned measurements available in each month are somewhat vari-able between the two radars (Fig. 1b).
The relative number of ELDIs per day in each month is de-picted in Fig. 3b. This has been deduced by normalizing the number of ELDIs (Fig. 3a) by the available radar observa-tions (Fig. 1b). To some extent, it could be regarded as a good indicator of the seasonal variation of ELDI occurrence in the auroral zone, bearing in mind that the field-aligned measure-ments of EISCAT radar have a fairly good coverage during most months (Fig. 1b).
From Fig. 3b, it is clear that there is a relatively higher ELDI occurrence in winter and earlier spring, namely in November, December, January, February and March, for both radars. It seems, however, that ELDIs have a much lower occurrence rate in the remaining months. There ap-pears to be an exception in May for ESR observations, but careful checking suggests that this may be an unreliable re-sult due to the low number of ESR observations available during that month (Fig. 1b). Indeed, the apparent seasonal variation of ELDI at ESR site should be interpreted with cau-tion, because of quite poor observational coverage from April to August (Fig. 1b).
Figure 3. Distribution of ELDI observed by EISCAT/ESR radars
during 2009–2011. The top panel denotes for absolute number of ELDI detected by radars and the bottom panel for normalized num-ber of ELDIs with observations in Fig. 1b.
3.2 Duration of ELDI
The top panel of Fig. 4 shows the duration of each ELDI event observed by the EISCAT UHF radar at Tromsø during the period from November to March. It can be seen that the typical duration of these events varies from a couple of min-utes to hours. The variation in duration is very similar for the ESR site (not shown here).
The distribution of ELDI duration is displayed in the bot-tom panel of Fig. 4 for both radars, using 2-minute bins. The bin size of 2 minutes was chosen to match the time resolution of the radar measurements. About one-third of the ELDI events observed by both radars last for an inter-val just above the lower threshold of 6 minutes. The other two-thirds last for a longer period, though most of them fall into bins no longer than 30 min. A number of the ELDI inter-vals detected by the EISCAT mainland radar have durations longer than an hour. Detailed checks indicate that most of these long-lasting ELDIs were observed in December, Jan-uary and FebrJan-uary around geomagnetic midnight (18:00– 02:00 UT, 21:00–05:00 MLT).
Overall, the average duration of ELDIs is 30 min at Tromsø and 14 min at Svalbard, respectively, which is more than twice the threshold introduced in our criteria for iden-tifying an ELDI. This suggests that our definition of this threshold is reasonable in practice.
3.3 E layer thickness of and HmE during ELDI
During the presence of ELDI, E layer thickness and HmE were evaluated for each of the measured profiles and then av-eraged for the event. The distribution of E layer thicknesses
27
0 50 100 150 200 250 300 350 400
0 100 200 300
Number of ELDI
D
u
ra
ti
o
n
o
f
E
L
D
I
(m
in
)
Duration of ELDI events observed by EISCAT radar during Jan.-Mar. Nov. and Dec.
6 8 10 12 14 16 18 20 22 24 26 28 30 32 34 36 38 40 42 44 46 48 50 52 54 56 >58
0 20 40 60 80
Duration (min)
N
u
m
.
o
f
E
L
D
I
Distribution of ELDI duration observed by EISCAT/ESR radars during Jan.-Mar., Nov. and Dec.
EISCAT ESR
490
Figure 4. Variation of ELDI duration inferred from EISCAT radar measurements (the 491
upper panel) and distributon from both radars (the bottom panel). 492
493
Figure 4. Variation of ELDI duration inferred from EISCAT radar
measurements (the upper panel) and distribution from both radars (the bottom panel).
during ELDI events is displayed in the top panel of Fig. 5. The bin size in these distributions is 3 km, which matches the altitude resolution of the radar measurements in the E region. Solid lines, showing a fitted Gaussian distribution, are super-posed for reference, with residuals in form of error bars. Ac-cording to the fitting results, the E layer thickness has a peak value of 21 km at the EISCAT mainland radar, compared to 17.8 km at the ESR. The values of parameter cin the top panel indicate that the E layer thickness detected by the ESR almost matches that for the EISCAT mainland observations, within the one sigma confidence interval. Considering the al-titude resolution of 3 km in radar measurements, it seems that the mean values of E layer thickness during ELDI events are effectively indistinguishable between the two sites.
The bottom panel of Fig. 5 shows the distribution of HmE during ELDI events. Once again, the step size is 3 km and lines of Gaussian fitting are displayed for reference. The predominant value of HmE inferred from EISCAT mainland measurements is quite clear, being 114.7 km, with standard deviation of 11.2 km. The peak heights of the ELDIs ob-served by ESR radar, however, are widely scattered through-out the plotted range, with a weak peak at around 110.4 km. The difference in the two distributions may be partly ex-plained by the comparatively smaller number of ESR obser-vations, resulting in many fewer ELDI events being available for analysis.
3.4 rEFduring ELDI
[image:4.612.310.547.65.215.2]Hongtao Cai et al.: E layer dominated ionosphere observed by EISCAT/ESR radars 1227
Figure 5. Distribution of ELDI with E layer thickness (the top
panel) and HmE (the bottom panel). Gaussian fitting lines of the
distributions are also superposed, with residuals as error bars.
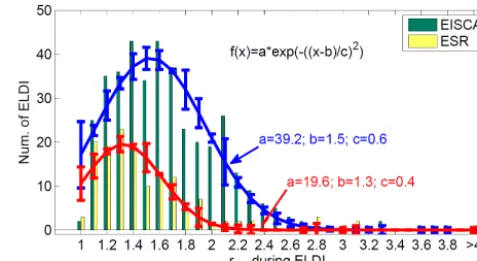
The fitting curves exhibit a predominant peak atrEF=1.5 for the EISCAT mainland radar, compared to 1.3 for the ESR. The standard deviations of the fitted curves are 0.6 and 0.4, respectively, suggesting that the dominant value for rEF is basically similar for the two sites, within the one sigma con-fidence interval.
The values of parameterbin the figure would also tend to suggest that the abnormal vertical structure of density pro-files during the presence of ELDIs is quite clear, as will be shown later in Fig. 9, with NmE being up to 50 % higher than NmF2.
4 Discussions
4.1 Diurnal variation of ELDI occurrence
Based on 4 years of radio occultation measurements from COSMIC, Wu et al. (2013) found that the occurrence of ELDI was higher on the nightside and was rare during the period 12:00–15:00 MLT in the dayside sector. The diurnal variation of ELDI occurrence observed by the EISCAT/ESR radars is depicted in the top panel of Fig. 7, whilst the nor-malized occurrence of ELDI as a function of time is also shown in the bottom panel. This was achieved by normaliz-ing number of ELDIs to the number of observations in every hour (Fig. 1c). The average number displayed in the bottom panel, therefore, can be understood as the diurnal variation of ELDI occurrence. The figure is plotted as a function of uni-versal time (UT) for both radars. It is easy to get approximate magnetic local time, using the formula MLT≈UT+3 h and local time with the formula LT≈UT+1 h.
[image:5.612.310.549.67.197.2]It is clear that the peak occurrence times of ELDIs ob-served by the EISCAT mainland and ESR radars are quite
Figure 6. Distribution of ELDI counts withrEFobserved by EIS-CAT/ESR radars. Gaussian fitting lines were superposed for refer-ence.
different. In the auroral zone (i.e. at the EISCAT mainland site), ELDI intervals are most frequently observed during the interval from 20:00 to 02:00 UT (23:00 to 05:00 MLT). This agrees with the results reported by Wu et al. (2013). For ESR measurements, however, the maximum is around MLT noon (08:00 UT, 11:00 MLT), with a hint of a secondary peak in the pmidnight sector (19:00 UT, 22:00 MLT). This re-sult disagrees with the rere-sults inferred from radio occultation measurements (Wu et al., 2013).
An understanding of particle precipitation in the polar re-gion helps us to make sense of the results. Under geomag-netic quiet conditions, the ESR radar is in the cusp region around noon and in the polar cap on the nightside, whilst the EISCAT mainland radar is within the auroral zone during most times of the day. During the interval in which the radar site is located under the auroral oval, precipitating particles of magnetospheric origin would cause additional ionization at E layer altitudes, thus favouring the formation of an ELDI. It is also interesting to mention that there is a gap of ELDI occurrence in 08:00–15:00 UT (11:00–18:00 MLT) for the EISCAT mainland radars, during which period the maximum of radar observations appears (Fig. 1c).
Our results suggest that the characteristic diurnal tions of ELDI occurrence exhibit remarkable spatial varia-tions, implying that ELDIs are likely to be local rather than global in nature.
4.2 Is ELDI a regular phenomenon in a dark polar region?
Figure 7. Diurnal variation of ELDIs observed by EISCAT/ESR
radars (the top panel). In the bottom panel, numbers of ELDI were normalized according to observation as in Fig. 1c (LT≈UT+1 h,
MLT≈UT+3 h).
Ground-based IS radars measurements showed, however, that typically around three ELDIs were recorded during each 24 h in the auroral zone (the bottom panel of Fig. 3). In February, up to four events were caught per day on average. As far as diurnal variation is concerned (the bottom panel of Fig. 7), the maximum occurrence of ELDIs is around 40 % for both sites. During most local times on the nightside, ELDI occurrence is not higher than 30 % for the EISCAT main-land radar. It is much lower at ESR, being only 5 % in the polar cap. Additionally, ELDIs are rare in the auroral zone around geomagnetic local noon (08:00–14:00 UT, 11:00– 17:00 MLT), during which period the availability of field-aligned observations maximizes (Fig. 1c). Ground-based IS radar measurements, therefore, strongly suggest that ELDIs appear sporadically, rather than regularly, in the polar region. Based on this data set, the contribution of geomagnetic ac-tivity to ELDI occurrence appears negligible. Only 8 of the 428 ELDIs were detected by EISCAT radar during storms, namely 5 ELDIs in March, 2 in August and 1 in November. Six of the storm-time ELDIs were seen during the interval 15:00–17:00 UT (18:00–20:00 MLT) and the remaining two were detected at dawn (00:00–02:00 UT, 03:00–05:00 MLT). None of these storm-time ELDIs showed any significantly different characteristics from the others.
It is worth reminding the reader that a minimal duration of ELDI was adopted in our work, so that profiles with transient signature of ELDI were excluded from our results. The du-ration of ELDI events was not considered in previous reports (Mayer and Jakowski, 2009; Wu et al., 2013) since tempo-ral resolution in satellite measurements is rather poor for any fixed point. The requirement for a minimum event duration would, to some extent, lower the number of ELDIs identi-fied from radar measurements and thus may also change the occurrence statistics of ELDIs.
31 522
10-10
10-9
10-8
10-7
10-6
10-5
10-4
10-3
10-2
Q / cm-3s-1
80 100 120 140 160 180 200
H
/
k
m
1 keV
2 keV
5 keV
10 keV 20 keV 50 keV
[image:6.612.337.515.68.241.2]523
Figure 8. Ionization rate caused by incident monoenergy auroral electrons in polar 524
upper atmosphere (from Cai and Ma, 2007). 525
Figure 8. Ionization rate caused by incident monoenergy auroral
electrons in polar upper atmosphere (from Cai and Ma, 2007).
4.3 Possible causes for presence of ELDI
The electron continuity equation can be written as
∂Ne
∂t =qsolar+qhp−div(Ne·v)−Le, (2)
in which qsolar represents ionization caused by solar UV/EUV radiations andqhp the additional ionization from particle precipitation. The third term on the right-hand side corresponds to electron density variations induced by trans-port, whilst the last item represents the loss due to chemical processes. During the winter, the EISCAT mainland and ESR radars are in darkness during most of the time. Thus the con-tribution from solar radiation can be reasonably neglected. In the polar region, transport processes, including ambipolar diffusion, wind-induced drifts along the field lines and elec-trodynamic drifts cross the magnetic field, are important in the F layer, but could be ignored in the E layer (Cai and Ma, 2007).
Hongtao Cai et al.: E layer dominated ionosphere observed by EISCAT/ESR radars 1229
Figure 9. Electron density median profiles (blue lines) observed by EISCAT/ESR radars during the presence of three types of ELDIs. Ne
profiles around presence of the ELDI (magenta lines) are superposed for reference. The standard deviations of these profiles are presented as error bars.
Maxwellian distributions (e.g. Strickland et al., 1989). Ac-cording to the theory of Rees (1963), incident electrons with a flux peak around 5 keV would induce extra ionization in the E layer at around 110 km altitude, which coincides with the mean values of ELDI HmE, shown in Fig. 5. This type of electron precipitation is frequently observed in the auro-ral zone (e.g. Burch et al., 1976), and is widely accepted to be accelerated by a field-aligned electric field (e.g. Hultqvist et al., 1999). Provided that the aforementioned auroral pre-cipitation is intense enough, the presence of ELDI would be expected.
ELDIs caused by particle precipitation were indeed ob-served by the EISCAT radars, and are called type 1 ELDI in this paper. An example, detected in the nighttime auroral region, is displayed in Fig. 9a. The blue line represents the median electron density profile measured during the ELDI and the magenta line indicates the background profile just be-fore or after the ELDI. The background density is determined by the median of a series of profiles during a period with the same time span as the ELDI duration. Standard deviations are superposed as error bars. An enhancement of over 100 % in NmE was detected, while the NmF2remained almost con-stant during the presence of the ELDI. It is clear that ELDIs of this type are formed mainly due to the abrupt enhancement of NmE, in agreement with the hypothesis proposed by Wu et al. (2013).
For a typical electron density profile in the polar region, NmF2 dominates the ionosphere and is usually far greater than NmE (e.g. Cai et al., 2007). For this initial condition, ELDI formation requires either:
1. reduction in NmF2 2. enhancement in NmE or 3. combination of (1) and (2).
In theory, therefore, enhancement of NmE might not always be the predominant mechanism for ELDI formation.
[image:7.612.346.511.278.322.2]The EISCAT mainland and ESR radars also detected EL-DIs with different features, as shown in panels b and c of
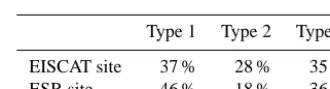
Table 1. Distributions of three types of ELDIs during 2009–2011.
Type 1 Type 2 Type 3
EISCAT site 37 % 28 % 35 %
ESR site 46 % 18 % 36 %
Fig. 9, in which the colours of the lines have the same mean-ing as in panel a. In contrast to the profiles in panel a, NmE in panel b shows no remarkable variations, whilst the den-sity drop in the F layer is clear. This exemplifies the fact that NmF2 depletion alone can also account for presence of ELDI, and such events are regarded as type 2. Panel c shows the third type of ELDI, during the formation of which an en-hancement of 35 % in NmE was accompanied by a reduction of 25 % in NmF2. The most likely explanation for such an event thus seems to be the combination of (1) and (2).
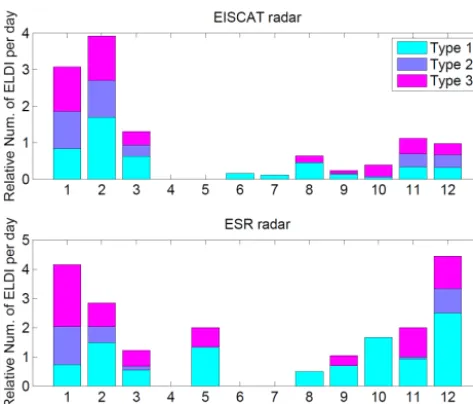
Figure 10. Number of ELDIs of various types in each month at
EISCAT/ESR sites during 2009–2011.
ionospheric F region. This is probably the reason why EL-DIs of type 2 are least frequently detected at ESR site.
The relative numbers of the three types of ELDIs for each month and hour are displayed in Figs. 10 and 11, respec-tively. These distributions were obtained by normalizing the numbers of the various types of ELDIs to the number of ob-servations in Fig. 1b and c for both radars, respectively. From Fig. 10, ELDIs of type 1 and 2 exhibit quite similar seasonal variations at the EISCAT mainland site, with type 2 being somewhat more likely to be detected in December and Jan-uary at the ESR latitude.
As far as diurnal variation is concerned (Fig. 11), ELDIs of the three types show slight but detectable differences in their occurrence statistics. In the auroral oval (top panel), ELDIs of type 2 are more often observed before geomag-netic midnight (21:00 UT), whilst the occurrence of type 1 exhibits a peak before and after midnight, respectively. On the nightside, moreover, the occurrence of type 2 ELDI peaks at 19:00 UT (22:00 MLT), being slightly earlier than that of type 1 (which maximizes during periods from 20:00 to 21:00 UT and 23:00 to 01:00 MLT). At ESR latitudes (the bottom panel), however, the diurnal variation of ELDIs is essentially dominated by those of type 1, while these of type 2 are relatively rarely observed on the nightside (16:00– 04:00 UT, 19:00–07:00 MLT).
Average values of NmF2and NmE, observed by the EIS-CAT mainland and ESR radars during periods of presence and absence of ELDI are listed in Table 2, as well as their standard deviations. Densities are expressed as multiples of 1011m−3. One can see that an increase of∼150–250 % in NmE was concurrent with a reduction of about 40–60 % in NmF2during the presence of ELDIs. If NmE or NmF2are as-sumed to be unchanged, ELDIs would not be seen at both
Figure 11. Diurnal variation of various types of ELDIs
at EISCAT/ESR sites during 2009–2011 (LT≈UT+1 h,
[image:8.612.315.538.349.424.2]MLT≈UT+3 h).
Table 2. Average NmF2and NmE during the period of presence and
absence of ELDI observed by EISCAT/ESR radars.
Presence of ELDI Absence of ELDI
EISCAT site NmF2=1.1±0.5∗ NmF2=2.5±0.6
NmE=1.8±0.8 NmE=0.7±0.7
ESR site NmF2=0.9±0.5 NmF2=1.5±0.8
NmE=1.4±0.9 NmE=0.4±0.6
∗with unit of 1011m−3
sites. For example, for a value of NmF2=2.5×10¹¹m−3at EISCAT, the requirement for NmE > NmF2 cannot be met, even if NmE increases from 0.7×10¹¹m−3 up to 1.8× 10¹¹m−3. If NmE is assumed to be 0.7×10¹¹m−3, con-versely, an NmF2depletion down to 1.1×10¹¹m−3cannot meet the requirement either. On average, therefore, neither (1) nor (2) alone could lead to the presence of these observed ELDIs. This could also be inferred from Table 1, in which ELDIs of type 1 are less than 50 % and type 2 are no higher than 30 % of the observed events. This suggests that an in-crease of NmE and a reduction of NmF2can both play a crit-ical role in the formation of ELDI.
5 Summary
Hongtao Cai et al.: E layer dominated ionosphere observed by EISCAT/ESR radars 1231
The occurrence of ELDIs exhibits clear seasonal variations in the auroral oval, with peaks in the winter and early spring. ELDIs are observed most often around geomagnetic local midnight at auroral latitudes, and around local noon at the ESR site. Our results also reveal that ELDI appears to be a sporadic rather than a regular phenomenon in the dark polar region.
The duration of ELDI events exhibits remarkable spa-tial variations, being about 30 min at Tromsø on average, but only about a half of this at Svalbard. The thickness of the E layer, however, as well as HmE and the ratio of NmE/NmF2exhibit similar distribution at both sites. Curve fitting suggests that the means of these parameters at the two sites are quite close during the presence of ELDIs, showing no significant spatial variations.
Case-by-case analysis confirms that either ionization en-hancements in the E layer or density depletions in the F layer alone can lead to the presence of ELDI, whilst events of type 1 are more frequently observed than type 2 at both sites. The occurrences of ELDI events of the various types exhibit slight but detectable difference between the two sites. We suggest that both E region enhancement and F region den-sity depletion play a critical role in ELDI formation in polar region.
Acknowledgements. We are grateful to the director and staff of the
EISCAT Scientific Association for providing the radar facilities and assistance with making the observations. EISCAT is an international scientific association funded by the research councils of China, Fin-land, Germany, Japan, Norway, Sweden and the UK. This work was jointly supported by Natural Sciences Foundation of China (No. 41374159; 41221003; 41431073) and Specialized Research Fund for Key Laboratory of Polar Science of the State Oceanic Adminis-tration (No. KP201002).
Topical Editor S. Milan thanks A. Kavanagh and one anony-mous referee for their help in evaluating this paper.
References
Burch, J. L., Lennartsson, W., Hanson, W. B., Heelis, R. A., Hoff-man, J. H., and HoffHoff-man, R. A.: Properties of spikelike shear flow reversals observed in the auroral plasma by Atmosphere Explorer C, J. Geophys. Res., 81, 3886–3896, 1976.
Cai, H. T. and Ma, S. Y.: Initial study of inversion method for estimating energy spectra of auroral precipitating particle from ground-based IS radar observations, Chinese J. Geophys.-Ch., 50, 10–17, 2007 (in Chinese).
Cai, H. T., Ma, S. Y., Fan, Y., Liu, Y. C., and Schlegel, K.: Climato-logical features of electron density in the polar ionosphere from long-term observations of EISCAT/ESR radar, Ann. Geophys., 25, 2561–2569, doi:10.5194/angeo-25-2561-2007, 2007. Farley, D. T., Balsey, B. B., Woodman, R. F., and McClure, J. P.:
Equatorial spread F: Implications of VHF radar observations, J. Geophys. Res., 75, 7199–7216, 1970.
Hultqvist, B., Øieroset, M., Paschmann, G., and Treumann, R.: Processes leading to plasma losses into the high-latitude atmo-sphere, in: Magnetospheric Plasma Sources and Losses, edited by: Hultqvist, B., Øieroset, M., Paschmann, G., and Treumann, R., Space Sciences Series of ISSI, Springer Netherlands, 1999. Liang, P. H.: F2 ionization and geomagnetic latitudes, Nature, 160,
642–643, 1947.
Mathews, J. D.: Sporadic E: current views and recent progress, J. Atmos. Sol.-Terr. Phy., 60, 413–435, 1998.
Mayer, C. and Jakowski, N.: Enhanced E-layer ionization in the au-roral zones observed by radio occultation measurements onboard CHAMP and Formosat-3/COSMIC, Ann. Geophys., 27, 1207– 1212, doi:10.5194/angeo-27-1207-2009, 2009.
Rees, M. H.: Auroral Ionization and Excitation by Incident Ener-getic Electrons, Planet Space Sci., 11, 1209–1218, 1963. Strickland, D. J., Meier, R. R., Hecht, J. H., and Christensen, A.
B.: Deducing composition and incident electron spectra from ground-based auroral optical measurement, J. Geophys. Res., 94, 13541–13552, 1989.
Wu, Y. W., Liu, R. Y., Zhang, B. C., Wu, Z. S., Xu, S., and Liu, J. M.: Characteris of the E layer dominated ionosphere in the polar regions during polar nights, Chinese Journal of Polar Research, 25, 132–141, 2013.
Yonezawa, T.: The solar-activity and latitudinal characteristics of the seasonal, non-seasonal and semi-annual variations in the peak electron densities of the F2-layer at noon and at midnight in mid-dle and low latitudes, J. Atmos. Terr. Phy., 33, 889–907, 1971. Yonezawa, T. and Arima, Y.: On the seasonal and non-seasonal