in the population sciences published by the Max Planck Institute for Demographic Research Konrad-Zuse Str. 1, D-18057 Rostock · GERMANY www.demographic-research.org
DEMOGRAPHIC RESEARCH
VOLUME 14, ARTICLE 16, PAGES 381-404
PUBLISHED 12 MAY 2006
http://www.demographic-research.org/Volumes/Vol14/16/ DOI: 10.4054/DemRes.2006.14.16
Research Article
Educational attainment and ultimate fertility
among Swedish women born in 1955-59
Jan M. Hoem
Gerda Neyer
Gunnar Andersson
1.1 Swedish family policies 383
1.2 Main assumptions 384
2 Data and method of analysis 386
2.1 The register data 386
2.2 Method of analysis 387
3 Some main results 387
4 The role of motherhood 389
4.1 Ultimate fertility vs. childlessness 389
4.2 The ultimate fertility of mothers 390
5 The role of marriage 392
5.1 Ultimate fertility vs. per cent never married 392
5.2 Ultimate fertility for the ever-married and for the never-married 394
6 Dynamics of the educational system 396
7 Reflections on our main findings 398
8 Acknowledgements 400
References 401
Educational attainment and ultimate fertility
among Swedish women born in 1955-59
Jan M. Hoem 1
Gerda Neyer 2
Gunnar Andersson 3
Abstract
This is the second of two companion papers addressing the association between educa-tional attainment and fertility for some sixty educaeduca-tional groups of Swedish women, defined according to field of education as well as level of education. The first paper is about childlessness and education, the present one about the mean number of children ever born. We find that ultimate fertility decreases somewhat with an increasing educational level, but its dependence on the field of education is much more impressive. In general, educational groups with relatively little childlessness also have relatively high ultimate fertility, and educational groups with much childlessness have relatively low ultimate fertility. In particular, women educated for the teaching or health-care professions have less childlessness and a higher ultimate fertility than others. Conversely, women with an education for esthetic or (non-teacher) humanist occupations have unusually high fractions childless and low ultimate fertility. Women with religious educations stand out by having very high fractions childless but quite ordinary mean ultimate fertility nevertheless; such women have very little childbearing outside of marriage. Women with research degrees have remarkably ordinary child-bearing behavior; they do not forego motherhood to the extent that some theories would predict.
1 Max Planck Institute for Demographic Research, Konrad-Zuse-Str. 1, 18057 Rostock, Germany.Tel.: +49-381-2081-190, E-mail: [email protected]
2 Max Planck Institute for Demographic Research, Konrad-Zuse-Str. 1, 18057 Rostock, Germany.Tel.: +49-381-2081-151, E-mail: [email protected]
1. Introduction
This paper is the second report from a project about the mutual influence between educational attainment and fertility, using Sweden as a representative of the Nordic countries. In a previous report (Hoem, Neyer, and Andersson, 2006, hereafter called HNA1), we focused on the association between education and permanent childlessness. We now concentrate on ultimate fertility, defined as the mean number of children ever born to women in a given educational group. Our empirical results are based mostly on data for the cohorts born in 1955-59.
As we spelled out in our companion paper, we believe that the field of education serves as an indicator of a woman’s potential reproductive behavior better than the mere level. We gave two main reasons for this. First, the field of education mirrors several structural factors intrinsic and extrinsic to an educational system, such as its gender structure and the manner in which education is hooked up to the labor market. A person’s field of education therefore reflects some of what determines her or his pro-fessional environment during the formative years and subsequently during the further life course, both of which impact on childbearing behavior. Second, the field of education can serve as an indicator of a person’s preference and life-course orientation regarding her future occupation and family life, and it may also better reflect social norms regarding family formation prevalent among different educational and occupational groups.
As in our companion paper, we regard education and childbearing as dynamically interactive processes that mutually determine each other. In the Nordic countries, with their flexible educational systems,4 exits from and entries into education are common features of a person’s life course. Educational attainment is not simply a pre-set determinant of subsequent childbearing, and one cannot simply study childbearing as a consequence of education taken in early years. In fact, a particular education may even be the consequence of previous childbearing. One needs to take such features into account. In this paper, we recognize this reality by comparing the type and level of education attained at the end of a woman’s childbearing years (ages 39-43) with the type and level of education attained at age 35-39, and consider its association with the ultimate number of children. This provides a better impression of the dynamics of childbearing and education.
The dynamics of childbearing and education are mediated through public policies. We take this into account in the present paper by explicitly considering welfare-state setups and family policies. Although at this stage of our research we are not really able to test the effect of public policies on childbearing dynamics across different
educational groups and orientations, we maintain that both processes (education and fertility), as well as the relationship between them, are shaped by the configuration of the welfare state. It may create an environment that enhances or reduces the opportunity costs and the financial and care burdens of having children. Such policies signal how difficult or easy it is to raise children, to combine employment and childrearing, and to maintain the standard of living after entry into parenthood. They may thus influence the level of childlessness, and they are even more important with regard to ultimate fertility because they shape the actual experience of parenting and thus create an incentive or disincentive to have a further child.
1.1 Swedish family policies
Since the 1960s, Sweden has geared its labor-market policies, family policies, gender policies, and childcare policies towards securing the labor-force participation of parents, relieving parents of care obligations, and reducing adverse economic and social consequences that may result from having children. Here is a thumb-nail sketch of the main points of the Swedish parental-leave system; we concentrate on the regulations that are relevant for “our” cohort born in 1955-59.5
In line with its general policy to support women’s labor-force participation and to promote gender equality, Sweden introduced individual taxation in 1971 and then gradually uncoupled social-security entitlements from marital and/or partnership status. In 1974, Sweden extended previous regulations concerning mothers and granted both parents the right to a job-protected leave of up to 180 days after the birth of a child. The parental leave could be taken in one go, piecemeal, or part-time, and it could be organized and shared by the parents as they wanted. Parents received a parental-leave benefit of 90% of their previous earnings. Women and men without prior employment received a flat-rate benefit. To take care of sick children, a care leave of 10 days was introduced; parents on care leave received sick-leave benefit (which also amounted to 90% of their earned income).
Parental leave and child-sickness leave have been expanded gradually since.6 In 1980, for example, when “our” cohort was between 21 and 26 years old, parental leave lasted up to 12 months, six of which could be postponed and taken until the child was 8 years old. Parental-leave benefit amounted to 90% of the former gross income for 9 months, and a flat rate for the remaining 3 months. Parents of children below age 8 had
5 We omit regulations concerning pregnancies, post-natal illnesses, or illnesses of newly born. For more detailed descriptions of the history of fertility related family policies see, for example, Haas 1992; Hiilamo 2002; Kolbe 2002; Haas and Hwang 1999; Leira 1992; Bergqvist et al. 1999; Rønsen and Sundström 2002.
the right to reduce their working time. Parents of children below age 12 had the right to up to 60 days of paid care leave per child and per year to take care of their sick child. In 1989 the parental-leave period was extended to 15 months, 12 of which were paid at a 90% income-replacement level. During the economic crisis of the 1990s, childbearing and care related benefits were reduced to 80% (and for the year 1996 even to 75%) of the former income. As mentioned in our companion paper (HNA1), the public sector sometimes offers additional payments to reduce the difference between the legal benefit level and previous income. This feature is important for our reflections on the importance of educations that frequently lead to a job in the public sector.
In 1980 Sweden formalized a regulation that allowed women to retain the level of their parental-leave benefit if they got their second or subsequent child within 24 months after their previous birth.7 The period was extended to 36 months in 1986. In both cases, the “speed premium” led to a shortening of birth spacing and an increase in second and subsequent birth risks which contributed to the overall increase in fertility during the 1980s (Hoem 1990, Andersson 1999, Andersson, Hoem, and Duvander 2006).
From the late 1960s on, Sweden intensified its efforts to increase public childcare services for children of all ages. In 1975 about 16% of the children aged 1-2 years were in public childcare. By 1980 their share had risen to 31%, and it continued to increase to about 45% in 1990, and to about 60% in 1999. Of the children aged 3-6, only about 17% had a place in public childcare in 1975. During the 1980s the percentage of such children in public childcare facilities rose from 38% (1980) to 64% (1990) and to about 80% at the end of the 1990s (Nyberg 2000:16, Bergqvist and Nyberg 2002:289,293). During the 1970s and 1980s the parental contributions to the cost of public childcare amounted to about 10% of the total childcare costs (Bergqvist and Nyberg 2002:290). Until 2001, except for pre-school childcare for the 5 to 6 year olds, the right to childcare places was largely restricted to children of employed parents or to parents in education (Bergqvist and Lindblom 2003:396,399).
1.2 Main assumptions
Sweden has thus implemented child support, parental-leave, and childcare policies that should reduce the opportunity costs of having children for women at all educational levels. The speed premium should furthermore work as an incentive to have another child relatively fast. Since it encourages having children closely spaced it may even contribute to increase the ultimate fertility among women who start childbearing late in
their lives. We would therefore expect that the Swedish family policies diminish differences in ultimate fertility among women with different educational levels. Since the parental-leave benefits and the access to childcare are closely linked to a person’s employment, we expect, however, differences among women of different educational groups. In the Swedish context, women with an education that leads to rather unstable employment careers or to professions with comparatively high economic insecurity should have lower ultimate fertility than women with an education that offers stable employment prospects. Likewise, we would expect that women with an education that frequently leads to employment in the public sector should have higher ultimate fertility than women who choose other educational lines, because the public sectors offers more stable employment possibilities.
As we outlined in our companion paper (HNA1), the dynamic selection process and the structural realities of educational and occupational life will reinforce each other and will work toward differentials in fertility levels among groups with different educational orientations. In particular, we would expect to find more childbearing on average among women who choose an education that leads them to be teachers or to work in the health sector, both of which are client-oriented occupations in the public sector. Conversely, we would expect fewer children than the average among women whose education leads them into typically male occupations (engineering, police work), or where the education is less obviously attached to clear occupational streams (work as an artist, liberal arts without teaching qualifications).
Individual preferences and social norms attached to specific education (and corresponding occupations) play also a role. Teachers and women in the caring professions may have more children than women in a technical profession, partly because their closer orientation toward other people as pupils or patients is associated with a closer orientation toward family life as well, and partly because socialization during education and working conditions in their occupations are both conducive to family formation. Likewise, artists and humanists may have fewer children than women with a teaching degree in arts or humanities because their work-style, their life-style, and the norms of their social environment may be less compatible with child-raising (Jensen 1973). These various features8 should manifest themselves partly in the extent of permanent childlessness, which we studied in our companion paper, but also in terms of ultimate fertility, which we address in the present work.
At first blush, we would expect low childlessness and high ultimate fertility to be strongly associated with each other, and conversely for both aspects of low fertility. The reason is partly algebraic (in that a high fraction childless in the ultimate-number-of-children-distribution of an educational group is likely to draw the mean ultimate
number downwards, and conversely for a low fraction childless), and partly theoretical (as we have hinted at above and have spelled out more extensively in our companion paper). As we shall see, this expectation is also fulfilled in most cases, religious edu-cation being the single exception, to which we return below.
2. Data and method of analysis
2.1 The register data
For our present investigation we use complete individual-level register data for some 250.000 women born in Sweden in 1955-59 and domiciled in Sweden during the census of 1960 or at any time since. (For a detailed account of the data, the process of data cleaning, and the selection of our cohort, see HNA1, Appendix 1.) We have data about demographic behavior in the years through 2002, extracted from the Swedish central population register. We have also information for the same individuals from the country’s educational register through 1998.9 As we mentioned in our companion paper (HNA1), we have concentrated on the cohort of Swedish women born in 1955-59. We study how ultimate fertility is associated with final educational attainment at the time of data extraction at the end of 1998, by which time this cohort had reached an age around 41 years. We have measured ultimate fertility at the end of 2002, when our cohort is between 43 and 47 years old. Due to quality problems at the initial stages of the Swedish educational register (HNA1, Appendix 1), we are reluctant to use older cohorts, and the next-younger five-year cohort has “only” reached an age around 36 at the same time (HNA1, Table A2). There is considerable educational enrolment between ages 36 and 41 in our cohorts born in 1959 and earlier. In order to check the generality of our findings, at least in Sweden, we have also carried out the analysis for the neighboring cohorts born in 1950-54 and in 1960-64. With some minor exceptions that we allocate to random variation due to the small size of some of our groups, the general patterns that we describe are robust across these cohorts. We have combined the fine-meshed educational codes used in the educational register to get the ca. 60 educational groups that are indicated on our diagrams and in the corresponding Table A2 in our companion paper (HNA1).
2.2 Method of analysis
As we explained in our companion paper, we apply a relatively simple method for our analysis (HNA1, Appendix 1). In statistical terms, our procedure can be interpreted as follows: We face a two-dimensional outcome, with the final number of children born to a woman as one dimension and final educational attainment (defined in terms of both level and direction of the education) as the other. We study the structure of the distribution of the former variable, conditional on the outcome of the latter. We trust that this structure gives us new insights into the underlying dynamics that we are really interested in. It also avoids the fallacy of treating educational attainment as causally prior to childbearing in a situation where the two processes evolve in parallel and influ-ence each other mutually.
3. Some main results
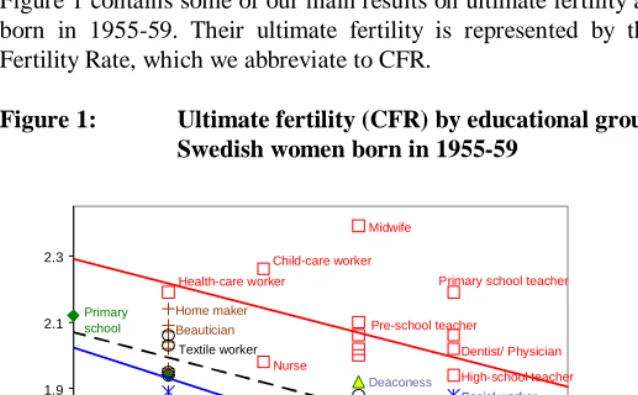
Figure 1 contains some of our main results on ultimate fertility among Swedish women born in 1955-59. Their ultimate fertility is represented by the cohort’s Completed Fertility Rate, which we abbreviate to CFR.
Figure 1: Ultimate fertility (CFR) by educational group;
Swedish women born in 1955-59
1.3 1.5 1.7 1.9 2.1 2.3
2 3 4 5 6 7
Educational level
CF
R
General education Personal service etc.
Arts, humanist, religious
Adm., econ., social science
Industry, crafts, engin., nat. sc.
Teaching and health
Midwife
Humanist Librarian Deaconess
Child-care worker
Primary school teacher
Dentist/ Physician High-school teacher Nurse Pre-school teacher Ph.D.(Med) Health-care worker Theologian
In the diagram, we have indicated the various educational orientations by markers of various forms and colors. As indicated in the diagram legend, we use six orientations, which comprise (i) education for work in personal service, in the post office, and so on; (ii) education for religious and art occupations, etc.; (iii) education for occupations in teaching and health provision; (iv) education in administration, business, economics, social science, and legal professions; (v) education for occupations in industry, trade, engineering, pharmacy, the natural sciences; and finally (vi) general education without any specific occupational orientation. The educational levels are defined in terms of the highest education ever completed and comprise the following levels: compulsory education (level 2), brief secondary education (level 3), long secondary education (level 4), lower secondary education (level 5), upper post-secondary education (level 6), and advanced research degrees (level 7; for details, see HNA1, Section 3.)10
Here briefly are the main features of Figure 1:
(1) For the educational lines that can sensibly be seen as distributed over many educational levels, ultimate fertility decreases with an increasing educational level, as is indicated by the trend-lines included in the diagram. The red trend-line covers education in teaching and health; the black trend-line is for education for jobs in industry, crafts, engineering, and natural sciences; and the blue trend-line is for education aiming at jobs in administration, economics, and the social sciences. Across educational levels the CFR spans from 2.12 for women who have the lowest educational level only, to 1.65 for women with an advanced research degree. The differences between the educational types are, however, more pronounced. As in the case of childlessness, educational orientation is a more important indicator of ultimate fertility than the educational level. A two-way analysis of variance shows that the educational orientation explains more than twice as much of the variation in ultimate fertility than does the educational level (details not shown here).
(2) Women educated for jobs in teaching and health care are in a class of their own, with much higher ultimate fertility (CFR=2.13) than in any other major grouping. It is much more important for the ultimate fertility whether an education belongs to teaching and health care than what level of education the woman has.
(3) Women educated to be librarians, artists, or humanists have much lower ultimate fertility than any other groups. In this connection, humanists (CFR=1.45) are women who have a university education on the B.A. or M.A. level in the liberal arts,
but who have not acquired pedagogical qualifications as high-school teachers. Women with a corresponding background and teaching qualifications are assigned to the group educated to be high-school teachers and are represented by a red square in the swarm of markers for the upper post-secondary level in Figure 1 (CFR=1.95). Unlike librarians (say), artists (CFR=1.56) and non-teaching humanists (CFR=1.45) face a labor market where there are no obvious direct occupational lines for which they have attained qualifications. We believe that such occupational insecurity may be part of the explanation why the latter groups have lower natality than most other groups. Librarians (CFR=1.59) have a more secure and obvious occupational life, and also have a bit higher fertility than those artists and humanists, but librarians still have much lower fertility than many other groups, and the reason why needs further exploration, though their lower income than other similarly well-educated groups may matter.
(4) Women educated for religious occupations are in another class of their own. In our companion study (HNA1) of permanent childlessness, university-level theologians and women with a non-academic religious education11 had unusually high percentages childless, yet with CFRs around 1.8 to 1.9 they cannot be singled out in Figure 1 as having particularly few children on average. By Swedish standards, the ultimate fertility among those of them who ever become mothers is very high, however (CFR=2.77 among the mothers who are deaconesses and CFR=2.52 among the mothers who are fully-fledged theologians). This is a phenomenon that we shall call bifurcation. We return to it below.
4. The role of motherhood
4.1 Ultimate fertility vs. childlessness
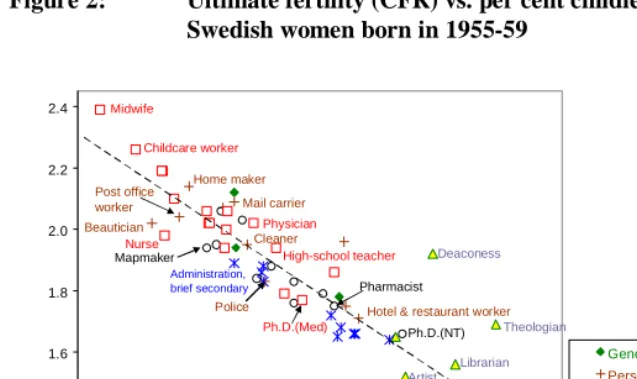
As we mentioned above, one would expect educational groups that have little childlessness to also have a higher total number of children (CFR) than others, and conversely for groups that have much childlessness. This pattern also shows up in the scatter plot of Figure 2, which gives a new angle on ultimate fertility. The two groups of women educated for religious work deviate conspicuously by having high fractions childless but middle-level ultimate fertility. As we noted in our introductory section, these two groups are interesting outliers.
Figure 2: Ultimate fertility (CFR) vs. per cent childless; Swedish women born in 1955-59
1.2 1.4 1.6 1.8 2.0 2.2 2.4
5 10 15 20 25 30 35
Per cent childless
CF
R
General education
Personal service etc. Arts, humanist, religious
Adm., econ., social science
Industry, crafts, engin., nat. sc.
Teaching and health
Midwife Childcare worker Physician High-school teacher Ph.D.(Med) Nurse Deaconess Theologian Librarian Humanist Artist Beautician
Police Hotel & restaurant worker
Pharmacist Ph.D.(NT) Ph.D.(SH) Mail carrier Home maker Cleaner Administration, brief secondary Mapmaker Post office worker
4.2 The ultimate fertility of mothers
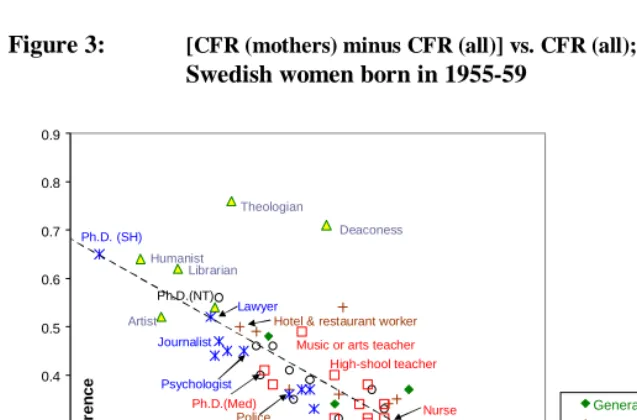
In addition to the CFR for all women in each educational group, we have also computed the mean ultimate number of children for women that have any children on record (see Table A2 in our companion paper). Figure 3 contains a scatter plot for the difference between the two ultimate fertilities, plotted for each group against the CFR for all women in the same group.12 To see the tight association between the two dimensions in the diagram more easily, we have also plotted a least-squares line fit to the data points.
12 Let us concentrate on a given educational group and use N to designate the number of children a given woman in the group ever has. Also let
n
p =P N{ =n} and (for later use)pn+=P N{ ≥n}. Then the per cent childless is p0 and the CFR for all women (in the group) is the
expected value EN. The ultimate fertility for the mothers in the group is CFR*= E N N{ | >0} = CFR/(1−p0). Since trivially
EN= E N N{ | =0} {P N=0} + E N N{ | >0} {P N>0}, we get after some simple re-arrangement that CFR*−CFR =
0 *
Figure 3: [CFR (mothers) minus CFR (all)] vs. CFR (all); Swedish women born in 1955-59
0.1 0.2 0.3 0.4 0.5 0.6 0.7 0.8 0.9
1.3 1.5 1.7 1.9 2.1 2.3
CFR (all) CF R dif fe re n c e General education Personal service etc. Arts, humanist, religious
Adm., econ., social science
Industry, crafts, engin., nat. sc. Teaching and health Theologian Deaconess Humanist Librarian Artist Lawyer Psychologist Ph.D.(NT) Beautician Police
Hotel & restaurant worker
Nurse High-shool teacher Ph.D.(Med) Childcare worker Ph.D. (SH)
Music or arts teacher
Mail office worker Mapmaker
Journalist
We see again that women with a religious education stand out from the others, in that those of them that ever become a mother have some three-quarters of a child more than the average in their own educational group. This is a much larger increment than in any other educational group. We see it as a reflection of the strong bifurcation in childbearing activity among the religiously educated that we have mentioned already.
Otherwise the general pattern shows a higher incremental CFR for mothers in educational groups that have a low ultimate fertility. Typically, women educated for work in esthetic and humanist professions ultimately have something like half a child more in the mean if they ever become mothers than the mean-total for their own educational group. Some of the groups educated for jobs in administration or the economic or social sciences have similar increments. In particular, this is the case for lawyers and Ph.D.s in non-medical sciences. With such educational backgrounds, it seems that women either get no children or they get about as many as everybody else. These features are stable across our three cohorts and are independent of the two cut-points at which we have measured educational attainment (at age 35 and at age 39-43). We see no similar bifurcation13 among women educated for the teaching or health professions.
13 Our concept of bifurcation is a variant of the idea of polarization introduced by Strohmeyer (1993) and Huinink (1995), who claim to find that highly educated West German women tend to either have no children or to have two or more. (In the notation of our previous footnote, p0 and
5. The role of marriage
5.1 Ultimate fertility vs. per cent never married
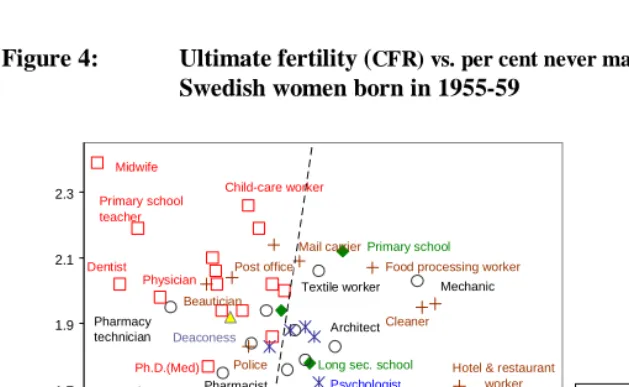
We do not believe that differential marriage formation is much of an explanation of childbearing differentials for most educational groups in Sweden. During the 1980s, the main childbearing years of our cohorts, about half of all newborn in Sweden were to non-married couples (SCB 1994:Table 3.2). Nevertheless we have plotted the mean ultimate fertility in our educational groups against the per cent never married, mostly out of curiosity. Figure 4 does show that the CFR tends to be high in educational groups where many people marry, and conversely for groups with much non-marriage, but other aspects of the figure have attracted more of our attention. We have added a stippled segmenting line to see more clearly how the various educational types group themselves into typical locations. All markers for the teaching and health professions (red squares) lie “northwest” of the segmenting line and most markers for administrative education, economics, and social science lie “southeast” of it. The markers for both groups of religious education lie “west” of the line (and “southerly” as compared to the red squares of the women with teaching or health education) because the corresponding women have such low percentages never married. The markers for women educated for esthetic and humanist professions tend to lie to the “south-east” of even the blue asterisks (for women trained in administration, economics, social science, and legal professions), because relatively few artists, librarians, and non-teaching humanists ever marry.14
Both groups of yellow triangles (for women with a religious education and women with an education in arts and humanities) are outliers on either side of the divide. The markers for women educated for jobs in personal service (like beauticians, waitresses, mail carriers, police women), marked by brown plus signs, are spread out over the whole plane with no visible pattern. In similarity to women educated in arts, religion, humanities, we find a divide among women with training in personal services. One group displays high ultimate fertility and high percentage never married (women educated as cleaners, service personnel, food processors); another group shows high ultimate fertility and high percentage of ever married (women educated as beauticians,
phenomenon should not extend to the less highly educated, and he expects that it should not be present in Swedish data, because it is so much easier for Swedish women to combine a professional life with childbearing. As Table A2 of HNA1 shows, however, there is lots of evidence of polarization in Sweden (p0 > p1 for many educational groups), and it is by no means confined to the highly educated.
hairdresser, mail carriers, postal office workers, home makers). Women educated in industry, crafts, trade, engineering, and the natural sciences (black circles) as well as in administration, economics, social sciences, legal professions, take a middle position with regard to marriage and ultimate fertility, with the exception of women with an education as textile workers or mechanics and engineering. The latter two groups impress us through their high ultimate fertility and their high shares of never-married women. Women with a research degree, the highest possible education in Sweden, do not stick out as a group of their own; they mostly fuse into the pattern that is characteristic for their line of education.
In general it seems that women educated in female-dominated educational lines and/or women with educations that lead to employment in the public sector (teaching, health, care, pharmacy, postal-service work, police work, and other legal professions) are more often married than women who were educated in less female-dominated lines and/or in professions that lead to employment in the private sector. In similarity to our findings regarding childlessness and ultimate fertility, the educational orientation also proves to be a better predictor of whether a woman is ever married than the educational level does. A two-way analysis of variance shows that the educational orientation explains a great part of the variance in marriage behavior, while the educational level hardly contributes anything to it (details not shown here). Educations mostly leading to subsequent employment in the public sector display higher ultimate fertility than similar educations with subsequent employment in the private sector, even if the educational line is not female-dominated (mail carrier, postal office worker, police woman; exception: librarians). Figure 4 furthermore shows that ultimate fertility is highest among women educated in a female-dominated line that leads to employment in female-dominated areas of the public sector (teachers, childcare workers, health care professions). This raises the question whether the gender-segregated labor market in Sweden, the expansion of the teaching and social-care sector since the 1970s, which created work for women, and the sometimes better parental-leave conditions provided by the public sector have also helped produce the fertility pattern that we find. The contrast between (i) the ultimate fertility of women with an education in teaching, health, and care and (ii) that of those with an education in female-dominated areas directed toward the private sector (e.g.: business, administration) suggests such a link, although at this stage of our research we cannot provide more proof of this than what our plots show.
being married and having children is the “order of life” for women with such educations. By contrast, women who take an education in arts, humanities, librarianship, or the social sciences may have planned a life without children and/or marriage; or else their subsequent professions leave less possibilities to have children and the prevailing norms of their professional environment are tied to life-styles that are not similarly compatible with children and marriage.
Figure 4: Ultimate fertility (CFR) vs. per cent never married;
Swedish women born in 1955-59
1.3 1.5 1.7 1.9 2.1 2.3
15 20 25 30 35 40 45
Per cent never married
CF
R
General education
Personal service etc.
Arts, humanist, religious
Adm., econ., social science
Industry, crafts, engin., nat. sc.
Teaching and health Humanist Librarian Artist Theologian Deaconess Midwife Primary school teacher Dentist Physician Child-care worker Ph.D.(Med) Police Beautician
Hotel & restaurant worker
Lawyer Journalist
Ph.D.(NT)
Ph.D.(SH) Architect
Textile worker Mechanic
Post office Mail carrier
Food processing worker
Primary school Cleaner Arts, brief Pharmacist Pharmacy technician Psychologist
Long sec. school
5.2 Ultimate fertility for the ever-married and for the never-married
companion paper once more.) This has produced one of our most revealing results, presented in Figure 5.
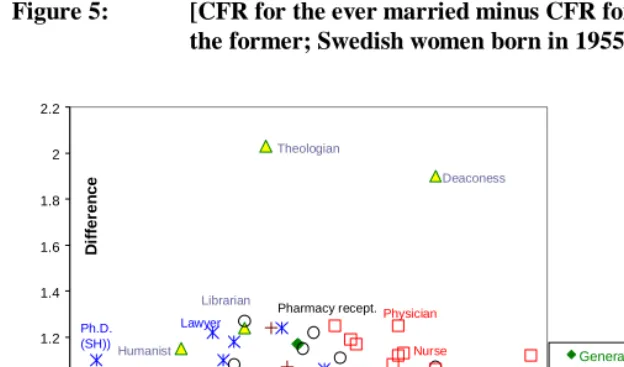
Figure 5: [CFR for the ever married minus CFR for the never married] vs.
the former; Swedish women born in 1955-59
0.6 0.8 1 1.2 1.4 1.6 1.8 2 2.2
1.7 1.9 2.1 2.3 2.5
CFR (ever married)
D iffer e n c e General education Personal service etc.
Arts, humanist, religious
Adm., econ., social science
Industry, crafts, engin., nat. sc.
Teaching and health Deaconess Theologian Humanist Artist Librarian Midwife Nurse Physician Ph.D.(med) Post-office worker Childcare worker Ph.D. (SH))
Hotel & restaurant worker
Beautician
Dental nurse
Pharmacy recept. Lawyer
In Figure 5 the ordinate (set off along the y-axis) is the difference between (i) the CFR for the ever-married in an educational group and (ii) the corresponding CFR for the never-married in the same group. The first of these two CFRs is used as abscissas (along the x-axis). Two features of the scatter diagram and its underlying statistics (see HNA1, Table A2) have struck us as remarkable.
(1) If we disregard random variation, ever-married women have about one child more on average than the corresponding never-married women in most educational groups. This holds regardless of the level of ultimate fertility in the groups.
ever marry have about two children more on average than those who do not. Again we see an extreme case of bifurcation, this time showing up as either (i) marrying and having children or (ii) never marrying and remaining childless (see HNA1, Table A2).
6. Dynamics of the educational system
Most of what we report in our two papers is based on a measurement of women’s educational attainment by the time of extraction of our educational data at the end of 1998, at which time our main cohort (born in 1955-59) had reached ages 39-43. As we have mentioned occasionally already, we have also experimented with their educational attainment at age 35, largely without finding any important differences in the patterns of childbearing behavior reflected by the two definitions of educational attainment. This is quite remarkable in view of the strong dynamics of educational attainment during the six age years on average between the two measuring points. Let us note that the groups recorded with a general (not occupation-related) education up through the gymnasium fell by 7744 individuals (11%) in our main cohort because they acquired further education after age 35 and therefore moved to other groups in our system. Conversely, the large group educated to be primary-school teachers increased by 25%, special-education teachers and teachers of health personnel (typical examples of late educational extension pursued by individuals who already have taken an education) increased by 82% altogether, nurses and midwives increased by 12%, the groups with a university-level degree below the doctorate went up by 11%, and the number of Ph.D.s rose by an 125% (but only from 412 to 929 women out of the quarter-million included in our analysis).
Due to the flexibility of the Swedish educational system, the mean age at first birth is lower than the mean age at which education is completed in quite a few educational groups. We have collected the most striking examples in Table 1. Mail carriers, cleaners, deaconesses, and teachers of children with special needs get their first child some five to six years earlier than they complete their education on average, and their mean age at educational completion is in the high twenties or later. This must reflect a pattern where women go back to take (more) education after childbearing. It illuminates our earlier reflections about disorder in the life-course (HNA1). The health-personnel groups and teachers listed are less extreme cases of the same syndrome. (Note that physicians are not among the groups that finish education after entry into motherhood on average.) These groups work in female-dominated labor-force segments in the public sector. Four different ways may lead to finishing education after entry into motherhood:
First, highly feminized educational lines, like education in teaching, care, and health,
Second, since the public sector provides an environment where parenthood and paid
work are more easily combined than in other segments of the labor market, women with a child (or children) may take a new education that qualifies them for work in the public sector. Third, the education taken after childbearing is an update (or upgrade) of a similar education taken earlier, for example, a qualification to become a special nurse or a higher qualified nurse. Fourth, as we mentioned above, some of the education, like education as a psychologist or as a midwife, require prior education and/or some years of professional activity in specific areas.
Table 1: Educational groups that have mean age at first birth considerably
lower than the mean age at completion of educationa
Educational group
at end of 1998 Group size
Group level
Mean age at first birth
Mean age at completion of education
Difference in years
Ph.D. (SH) 191 7 30.3 36.9 6.6
Special-ed. teacher 823 6 28.3 34.5 6.2
Mail carrier 688 3 23.5 29.2 5.7
Cleaner 524 3 22.6 28.2 5.6
Deaconess 326 5 27.2 32.7 5.5
Ph.D. (Med) 296 7 30.7 35.9 5.2
Midwife 529 5 25.4 29.8 4.4
Social scientist 1401 6 28.8 32.9 4.1
Psychologist 579 6 29.3 32.7 3.4
Ph.D. (NT) 442 7 31.3 34.7 3.4
Pharmacy technician 504 5 28.1 31.3 3.2
Nurse 17539 5 27.3 30.1 2.8
Child-care worker 12673 4 24.2 26.7 2.5
Health-care worker 26456 3 24.1 26.0 1.9
Mechanics, etc. 3574 3 23.9 25.6 1.7
Primary-school teacher 4038 6 27.6 28.4 0.8
Note: a Extracted from Table A2 in HNA1.
Women who continue their education and receive a Ph.D., on average have their first child well before they finish their education. Ph.D.s in Sweden usually require rather long study times; their mean age at completion is in the mid-thirties. However, Ph.D. students usually receive a stipend or are employed during their studies. This must make it easier to have a child before they receive their degree.
7. Reflections on our main findings
Our main contention in the present study is that women’s ultimate fertility depends at least as much on their type of education as on the level attained. We find that on average women educated for jobs in the teaching or health sectors have much higher fertility than women in other lines of education. It is a common expectation that fertility will decrease as educational attainment improves. This is true also in our data, but only within each line of education. Women educated for administrative jobs (at any level) or for work in economics or social science systematically have lower fertility than women educated to be teachers or health personnel. Women with other educational backgrounds fit into suitable locations in this spectrum.
Some educational groups deserve special attention, as follows.
(1) Women educated to work in jobs with a religious association (ministers, deaconesses, missionaries, and so on) are a special class. Despite an unusually high percentage childless they have medium-high ultimate fertility, mostly due to the relatively high fertility of those female theologians who get married and the very low fertility of those who do not. We see this as a manifestation of a selection process, this time geared either to their special attitudinal mind-set or their professional norms. It seems that for women educated in the religious field, childbearing is more closely linked to marriage than for women of other educational backgrounds.
(2) We also assume that there is some dynamic selection process that makes women take an education to become artists, or to take a humanist university education without the security of teaching qualifications, and that women in these groups are marked by their unusual working conditions. Women in these educational groups have much childlessness and very low ultimate fertility. Unusually many of them never marry. Such demographic behavior may be the outcome of their chosen life-style; but it may also reflect an adaptation to their uncertain career possibilities.
and restaurants. We are not sure what leads such women to end up with so unusual demographic outcomes. In fact the demographic behavior of librarians strike us as particularly unexpected, since they should have a reasonably secure career path and mostly work in a part of the public sector that employs many women. All of these features ought to be associated with relatively high childbearing. One special feature of the librarians’ professional life is that on average they are much less well paid than others with an education at the university level,15 but we can only speculate about whether this is a dominant determinant of their childbearing. Much less well-paid groups of women have higher fertility. The demographic behavior of women who are trained to work in the hotel- and restaurant business (i.e., their comparatively low ultimate fertility and low nuptiality, which brings them close to women trained in the arts and humanities), may reflect working conditions that are usually difficult to combine with family life or it may reflect self-selection of women into this field. It also shows that the assumption that a particular demographic behavior is a characteristic of, say, women with university-level education, may actually be misleading.
(4) We are equally surprised to find that women educated for police work have pretty average demographic behavior instead of low fertility. Perhaps this surprise only reflects our own prejudices, since we would have expected that education for a male-dominated job leads to lower fertility.16 However, police education is not particularly unusual among Swedish women, and those who take it work in the public sector and are relatively well paid on average, better than the average (female) high-school teacher, architect, journalist, or dentist in our data.
(5) Finally, we find it interesting that the demographic behavior of women with research degrees does not differ much more from the demographic behavior of other women with the same line of education but a lower level. Women with an advanced post-secondary education end up completing their degrees in their mid-thirties on average, and often after entry into motherhood. Women in each of our three groups with research degrees do tend to have a bit higher fractions childless and somewhat fewer children on average than other women in their line of education, but they have very ordinary percentages never married. All in all, they do not deviate markedly from the pattern of their line of education.
The ultimate fertility of an educational group must be the outcome of many processes that function in interaction with each other. It is evident that we are only beginning to discern some of the explanations. Our analysis pinpoints where one should
15 In fact they are less well paid than many groups with lower educational attainment.
start to look, however, and as a minimum it indicates issues that are open and explanations that are too facile to be of much help. One conclusion is obvious: In studies of the association of education with fertility outcomes, the representation of education needs to reflect much more than just the level attained. Adding educational orientation will at least give us a proxy for underlying features that have a direct influence on entry into motherhood. Studying education as a process that works in interaction with childbearing behavior and embedding both into a context that recognizes the (potential) effects of educational systems, occupational structures, and family policies on demographic behavior should bring us even further.
8. Acknowledgements
References
Andersson, Gunnar (1999). Childbearing trends in Sweden 1961-1997. European
Journal of Population 15, 1-24.
Andersson, Gunnar, Jan Hoem, and Ann-Zofie Duvander (2006). Social differentials in speed-premium effects in childbearing in Sweden. Demographic Research 14(4): 51-70. Available http://www.demographic-research.org/Volumes/ Vol14/4.
Bergqvist, Christina et al. (eds.) (1999). Equal Democracies? Gender and Politics in
the Nordic Countries. Oslo: Scandinavian University Press.
Bergqvist, Christina and Anita Nyberg (2002). Welfare state restructuring and child care in Sweden. In: Michel, Sonya and Rianne Mahon (eds.). Child Care Policy
at the Crossroads. Gender and Welfare State Restructuring. London: Routledge,
287-307.
Bergqvist, Christina and Anders Lindbom (2003). The Swedish welfare state: Neo-liberal challenge and welfare state resilience. Österreichische Zeitschrift für
Politikwissenschaft 4, 389-401.
Haas, Linda (1992). Equal Parenthood and Social Policy. A Study of Parental Leave in
Sweden. Albany: State University of New York Press.
Haas, Linda and Philip Hwang (1999). Parental leave in Sweden. In: Moss, Peter and Fred Deven (eds.). Parental Leave: Progress or Pitfall? The Hague/Brussels: NIDI/CBGS Publications 35, 45-68.
Hiilamo, Heikki (2002). The rise and fall of Nordic family policy? Historical development and changes during the 1990s in Sweden and Finland. Helsinki: STAKES Research Report 125.
Hoem, Jan M. (1990). Social policy and recent fertility change in Sweden. Population
and Development Review 16 (4), 735-748.
Hoem, Jan M. (1993). Public policy as the fuel of fertility: Effects of a policy reform on the pace of childbearing in Sweden in the 1980s. Acta Sociologica 36, 19-31. Hoem, Jan M., Gerda Neyer, and Gunnar Andersson (2006, denoted HNA1). Education
and childlessness. The relationship between educational field, educational level, and childlessness among Swedish women born in 1955-59. Demographic
Research 14(15): 331-380. Available http://www.demographic-research.org/
Huinink, Johannes (1995). Warum noch Familie? Zur Attraktivität von Partnerschaft
und Elternschaft in unserer Gesellschaft. Frankfurt/Main: Campus Verlag.
Jensen, Richard (1973). Family, career, and reform. In: Gordon, Michael (ed.). The
American Family in Social-Historical Perspective. New York: St. Martin’s
Press, 267-280.
Kolbe, Wiebke (2002). Elternschaft im Wohlfahrtsstaat. Schweden und die
Bundesrepublik im Vergleich 1945-2000. Frankfurt/Main: Campus Verlag.
Leira, Arnlaug (1992). Welfare States and Working Mothers. The Scandinavian
Experience. Cambridge: Cambridge University Press.
MISSOC (Mutual Information System on Social Protection in the EU Member States and the EEA) at http://europa.eu.int/comm/employment_social/ social_protection/missoc_tables_en.htm
Neyer, Gerda (2003). Family policies and low fertility in Western Europe. MPIDR Working Paper WP 2003-21. Available: http://www.demogr.mpg.de/ papers/working/wp-2003-021.pdf
Nyberg, Anita (2000). From foster mothers to child care centers: A history of working mothers and child care in Sweden. Feminist Economics 6, 5-20.
Rønsen, Marit and Marianne Sundström (2002). Family policy and after-birth employment among new mothers - a comparison of Finland, Norway, and Sweden. European Journal of Population 18, 121-152.
SCB (Statistiska centralbyrån) (1994). Befolkningsstatistik 1993, del 4. Stockholm: Statistics Sweden.
Appendix
Figure A1: Per cent never married, by education group;
Swedish women born in 1955-59
10 15 20 25 30 35 40 45 50 55
2 3 4 5 6 7
Educational level Per ce n t n ever ma rr ied General education
Personal service etc. Arts, humanist, religious
Adm., econ., social science
Industry, crafts, engin., nat. sc.
Teaching and health
Basic education Brief secondary Midwife Dentist Primary-school teacher Theologian Dental nurse Pharmacy technician Primary school Pre-school teacher Physician Ph.D. (SH) Architect Business, Adm. long sec. Medical secretary Long secondary school Arts, brief Artist Journalist Librarian Humanist Food processing Mechanic
Hotel & restaurant