Print ISSN: 2383-451X Online ISSN: 2383-4501 Web Page: https://jpoll.ut.ac.ir, Email: [email protected]
Verification of IVE Model for SAIPA Co. Fleet Emission
Alipourmohajer, Sh.1, Rashidi, Y.2* and Atabi, F.1
1. Department of Environment Engineering, Faculty of Natural Resources and Environment, Science and Research Branch, Islamic Azad University, Tehran, Iran
2. Environmental Sciences Research Institute, Shahid Beheshti University, Tehran, Iran
Received: 24.03.2018 Accepted: 26.07.2018
ABSTRACT: To determine the amount of air pollutants, produced by Iranian automakers, and compare it with old and retrofitted vehicles have become one of the important tools of urban management. The present research uses International Vehicle Emission (IVE) modeling software in order to verify SAIPA Co. fleet emissions, based on Euro 4 emission standard (SAIPA Co. recognized as a superior Iranian brand in vehicle industry). There has been attempts to determine pollutant emission from Saipa Co.-manufactured cars in the city of Tehran, in accordance with Tehran Driving Cycle along with modeling and lab results which have over 90% conformity with modeling and lab results of New European Driving Cycle. According to ISQI’s 100,000-km test results, the amount of CO2 emission modeling from X100 and Tiba2’s has been about 160 gr/km, which has been within the range, whereas the modeled CO2 emission rate has been 232 gr/km in TDC, i.e., 1.5 times more than laboratory test, due to different driving cycle usage. Significant differences between the values obtained in the emission lab and modeling at New European Driving Cycle, Tehran Driving Cycle, and Tehran Air Quality Control Company report, indicate that relying on hypothetical situation leads to inapplicable emissions value from light vehicles.
Keywords: Vehicle Industry, Tehran Driving Cycle (TDC), New European Driving Cycle (NEDC), Euro 4 Emission Standard.
INTRODUCTION
The relation between the rise of air pollutants and severity of living organisms' diseases has been known for many years, especially in case of people who suffer from heart and respiratory illnesses, related to the air pollution (Rashidi et al., 2012; Katsura, 2012; Lee et al., 2012; Sekhavatjou et al., 2011; Quesada-Rubio et al., 2011; Shafabakhsh, et al., 2018; Wang et al., 2011; Zou et al., 2011). Among the sources of pollutant emissions, the lion's share belongs to mobile sources in large cities, among which internal combustion
*
Corresponding Author Email: [email protected]
control, the European Union formally introduced emissions laws the so-called Euro-Emission Standard in 1992 (The European Parliament and the Council of the European Union, 1992). As for Iran, the Iran's National Standard No. 7328, entitled "Road vehicles – Emissions of pollutants" was introduced in 2004 in accordance with the EU standards (The Iran's National Standard No. 7328, 2004).
There have been various software programs to estimate the amount of emissions from mobile sources, developed and promoted by U.S. Environmental Protection Agency (EPA) or the European Union. Using these software programs makes it possible to verify the results from modeling and laboratory tests, estimate the amount of pollutant emissions based on different driving cycles, and –finally– determine the emission inventories of moving resources, such as Moves, COPERT, and IVE. EPA’s MOtor Vehicle Emission Simulator (MOVES) is a state-of-the-science emission modeling system that estimates emissions from mobile sources at international, national, and project levels for such criteria as air pollutants, greenhouse gases, and air toxics (Shafie-pour et al., 2013). As for COPERT, it is a software tool, used worldwide to calculate air pollutants and greenhouse gas emissions from road transport. Its development has been coordinated by the European Environment Agency within the framework of the activities of European Topic Centre for Air Pollution and Climate Change Mitigation. COPERT has been originally developed for official road transport emission inventory preparation in European Environment Agency (EEA) member countries; however, it is applicable to all relevant research, scientific, and academic applications (Shafie-pour et al., 2013; Fameli & Assimakopoulos, 2015; Kassomenos et al., 2006; Outapa, et al., 2017; Hai Van, et al., 2015; Penwadee Cheewaphongphan, et al.,
2017; Shaddick, et al., 2018). Finally, IVE software has been applied in different countries, like China (Zhang, 2013; Wang et al., 2010; Wang, et al., 2008; Guo et al., 2007), Argentina, Colombia, Chile, Brazil (Gallardo et al., 2011), Iran (Shafie-pour et al., 2013; Shahbazi et al., 2016; Ghadiri et al., 2017), and India (Mishra & Goyal, 2014; Nagpure et al., 2011). All told, the present study aims at the use of International Vehicle Emission modeling software to verify SAIPA Co. fleet emissions, based on the Euro 4 emission standard (SAIPA Co. being recognized as a superior Iranian brand in vehicle industry) as a new fleet. It attempts to determine the emission of pollutants by the Saipa Co. fleet in the city of Tehran, based on Tehran Driving Cycle. It goes without saying that the results from this study will guide the authorities to reduce the amount of air pollutants, related to old and retrofitted vehicles which do not meet Euro 4 emission standard or are not fitted with catalytic converters, as an essential step for the improvement of air quality in Tehran city.
MATERIALS AND METHODS
Tehran, which include limited public transportation alternatives, rapid population growth, and numerous personal car ownership (Naddafi et al., 2012; Shahbazi et al., 2016). The air pollution problem in Tehran gets intensified by complex terrain conditions. Being surrounded by Alborz mountain range on the north and northeast sides, leads to pollution getting dispersed by the winds on the east side of Tehran (Ashrafi, 2012; Sohrabinia & Korshiddoust, 2007; Ghadiri et al., 2017). The number of vehicles has overgrown in Tehran with the total number of registered vehicles having increased more than eight times in the last 13 years. Today, there are about 4.24 million registered vehicles in Tehran city (Shahbazi, 2015), 72% of which belong to personal light-duty vehicles, based on the emission inventory of Tehran, with the rest being composed of taxis, buses, minibuses, pickups, trucks, and motorcycles (Tehran Air Quality Control Company, AQCC, 2015).
The present study uses International Vehicle Emissions (IVE) software program in order to estimate the fleet distribution of Saipa Co. productions, recognized as one of the biggest automakers in Iran. The IVE
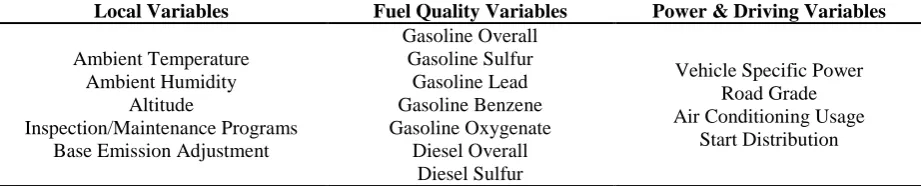
model is a computer program, developed by the Java programming language, which is designed to estimate mobile source emissions. The model predicts local air pollutants, greenhouse gas emissions, and toxic pollutants. The IVE model has been developed as a joint effort of the University of California at Riverside, College of Engineering – Center for Environmental Research and Technology (CE-CERT), Global Sustainable Systems Research (GSSR), and the International Sustainable Systems Research Center (ISSRC). The most important input in IVE is driver-specific factors. This software uses Vehicle Specific Power (VSP) and Engine Stress to gain the mentioned correction factors. The former is a function of instantaneous speed, elevation change, vehicle weight, drag coefficient, and air density. The emission estimation process in IVE model is to multiply the base emission rate for each technology by each of the correction factors, which are defined for each vehicle technology, and the amount of vehicle travel for each technology, to finally arrive at a total amount of emissions produced. The correction factors can be categorized into several categories (Table. 1) (Shafie-pour et al., 2013).
Table 1. Effective Parameters Considered to Calculate Pollution Emissions in IVE Model
In this model, equation (1) is used for light and medium vehicles with good
accuracy:
( / )
VSP kW metric ton
2 1
( (1 ) ) ( )
2 D
i R a w if R
C A
v a g grade g C v v v C g C
m
31.1 9.81 ( tan(sin( ))) 0.132 0.000302
v a a grade v
(1)
Power & Driving Variables Fuel Quality Variables
Local Variables
Vehicle Specific Power Road Grade Air Conditioning Usage
Start Distribution Gasoline Overall
Gasoline Sulfur Gasoline Lead Gasoline Benzene Gasoline Oxygenate
Diesel Overall Diesel Sulfur Ambient Temperature
Ambient Humidity Altitude
where:
(m )
v speed
s
2 (m )
acceleration s
a
( )
mvehicle weight kg
= mass factor, equivalent to the mass of the rotating parts (wheels, gears, shafts, etc.) at power train (without unit). The suffix indicates that depends on gear, tilt, elevation, and landing length.
2 9.8(m )
g gravity acceleration
s
( )
R
C Resistance coefficient without unit
2
( )
D
C Stretch coefficient m
2
1.207 20
a
kg
The density of the outside air is at C m
( )
w m
v Opposite wind direction
s
To determine the engine stress, Equation (2) is also employed:
(0.08 )
Engine Stress RPM Index
ton Preaverage Power
kW
(2)
5 25
( )( )
t sec to Preaverage Power
kW Average VAP
ton
0 ( )
t
RPM Index
Velocity SpeedDivider without unit
0.9
Minimum RPM Index
The speed drive in the above equation is based on the speed and power of the characteristics of the vehicle, all in accordance with the instructions of IVE user guide. This model considers 60 bins for specific power of the vehicle and the engine stress. By specifying these two parameters for each moment over a period of time, the temporal percentages of the vehicle, located either in each of the working phases or between them, can be determined.
The New European Driving Cycle (NEDC) test was performed, using the Regulation No. 83 (The Iran's National Standard No. 7328, 2004), and the results of the time and speed of the tested vehicles
were recorded. Using the above formulas, VSP, Speed Divider, RPM Index, Preaverage Power, and Engine Stress were obtained and the percentage of active bins was determined. The information needed to implement the IVE model is divided into two general categories: (1) fleet specifications, including information about the vehicles and the percentage of various technologies used at the fleet, not to mention the percentage of air conditioning system usage, also specified in the section. The present study considered the percentage of vehicles that used air conditioning to be 60%. Generally, the basis for car emissions, based on the information contained in the IVE database, is determined by the type and capacity of the engine and vehicle technology with the emission levels of vehicles in IVE model being measurable, thanks to the differences in existing vehicles with the default technology in IVE model database, based on emission measurement tests (Shafie-pour et al., 2013). Saipa’s products, investigated in this study, were X100 family (Saipa 131 and Saipa 132) and X200 (Tiba2). The technology options used in the vehicles were selected as follows: Technology Petrol, MPFI
Index Pt: Auto / Sm Tk: Lt: MPFI: EuroIV: PCV / Tank: 80-161km
Table 2. Fuel Characteristics at IVE software
Overall Sulfur(S) Lead Benzene Oxygenate
moderate/premixed low (50ppm) none low (0.50 %) 2.5%
Furthermore, the second category entails (c) start-up and soak time data, which due to the lack of official data on Tehran’s start-up and soak time, it was gathered, based on a questionnaire, indicating the startup pattern and intervals between the two start-ups on the working and non-working days. After completing the information relevant to the Location at the Calculation tab, the concentrations of CO, VOC, VOCevap, SOx, NOx and PM, as well as toxic pollutants and effective gaseous agents in global warming can be estimated in the daily or hourly manner, with the emission results modeled in both start-up and driving modes. Besides, due to the impossibility of transferring soak time of different parts of TDC, only the total TDC and the X100 and TIBA2 were modeled on driving mode. The last aspect of this category is (e) driving information, for which the ECE+EUDC test cycle (also known as the MVEG-A cycle) was used here for EU type approval testing of emissions and fuel consumption from light duty vehicles (EEC Directive 90/C81/01). The test was performed on a chassis dynamometer, with the entire cycle including four ECE segments, repeated without interruption, followed by one EUDC segment. Prior to the test, the vehicle was allowed to soak for at least 6 hours at a test temperature of 20-30°C. It then started and allowed to settle down for 40s. The effective year was 2000. Having eliminated the idling period, the engine started at 0s and the emission sampling began at the same time. This modified cold-start procedure is referred to as NEDC or the MVEG-B test cycle. The full test started with four repetitions of the ECE cycle, with the ECE being an urban driving cycle, also known as UDC. It was devised to represent city driving conditions, e.g. in
Paris or Rome. It was characterized by low vehicle speed, low engine load, and low exhaust gas temperature. EUDC (Extra Urban Driving Cycle) segment was added after the fourth ECE cycle to account for more intensive, high speed driving modes. The maximum speed of the EUDC cycle was 120 km/h. An alternative EUDC cycle for low-powered vehicles had also been defined with a maximum speed limit equal to 90 km/h. Emissions were sampled during the cycle, according to the Constant Volume Sampling (CVS) technique, analyzed and expressed in g/km for each of the pollutants (Iranian National Standard No. 7328, 2004). For measurement of the emission, it was necessary to carry out the standard NEDC tests in the Emission Laboratory of SAIPA Automotive Industry Research and Innovation Center (AIRIC). After settling vehicle on the chassis dynamometer, NEDC standard tests were carried out with the cooperation of the researcher, constantly supervised by technical experts of AIRIC and driver's lab. Test steps were performed with ASR and Driver's Aid software. During the standard NEDC emission test, the car moved 11.02 km in 1176 s, with an average speed of 33.73 km/h. In this paper, the driving data of Tehran city were based on the results of the study done by Fotouhi et al. (2011). Based on the results, four categories of traffic driving cycle were defined in Tehran, which included:
1. Congested driving cycle: In this traffic condition, the average vehicle speed is very low with long stops.
2. Urban driving cycle: In this traffic condition, the average vehicle speed is relatively low, sometimes with long stops.
4. Highway driving cycle: In this traffic condition, the average vehicle speed is high and rarely comes with a stop.
The developed Tehran driving cycle contains 1533 s, with an average speed of 33.83 km/h, while the cars move 14.41 km. In order to validate the test results, the emission tests were carried out in Iran Standard & Quality Inspection Company (ISQI), on Tiba2 and X100 cars, and the results were recorded. In addition, Conformity of Production test (COP) was applied. COP is a means of evidencing the ability to produce a series of products that exactly match the specification, performance and marking requirements, outlined in the type approval documentation. With regard to the components that affect the emission of gaseous and particulate pollutants by the engine, emissions from the crankcase, and evaporative emissions, every vehicle that bear an approval mark under this regulation shall conform to the vehicle type approved (The Iran's National Standard No. 7328,
2004). Table 3 encompasses the differences between three kinds of driving modes.
RESULTS AND DISCUSSION
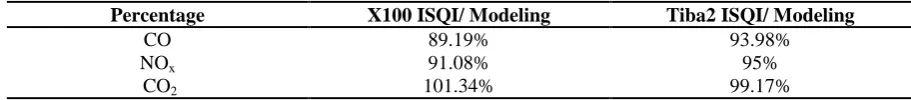
Since only the CO, NOx, and CO2 emissions are measured by the conformity of production test, the percentage of the agreement between measured values of the aforementioned pollutants in COP test and the modeling values (Table. 4) got calculated. As can be seen in Table. 5, the percentage of the agreement stood above 90%. Since emission modeling and measuring with Euro 4 technology have not yet been mentioned in scientific articles, other pollutants were validated based on the percentage of the achieved agreement.
According to the results as well as Figures (1), (2), and (3), CO and NOx emissions were four times less than the On-board diagnostics (OBD) limit, which is an automotive term referring to a vehicle's self-diagnostic and reporting capability (Iranian National Standard No. 7328, 2004).
Table 3. Differences between three kinds of driving modes
Standard Total Time (s) Average Speed (km/h) Total Distance (km)
NEDC 1180 33.35 10.90
AIRIC NEDC test 1176 33.73 11.02
TDC 1533 33.83 14.41
Table 4. Comparison of the results of CO, NOx, and CO2 modeling and COP test
OBD TDC-
Modeling
Tiba2-Modeling Tiba2-ISQI
X100-Modeling
X100-ISQI gr/km
3.2 0.722
0.312 0.332
0.263 0.295
CO
0.6 0.148
0.072 0.076
0.067 0.074
NOx
100,000 km-test TDC-
Modeling
Tiba2-Modeling Tiba2-ISQI
X100-Modeling
X100-ISQI gr/km
159.806 231.626
161.89 163.25
159.867 157.76
CO2
Table 5. Percentage of result conformity of CO, NOx, and CO2 modeling and COP test
Tiba2 ISQI/ Modeling X100 ISQI/ Modeling
Percentage
93.98% 89.19%
CO
95% 91.08%
NOx
99.17% 101.34%
Fig. 1. Comparison of CO emission in ISQI and IVE modeling as well as TDC mode
Fig. 2. Comparison of NOx emission in ISQI and IVE modeling as well as TDC mode
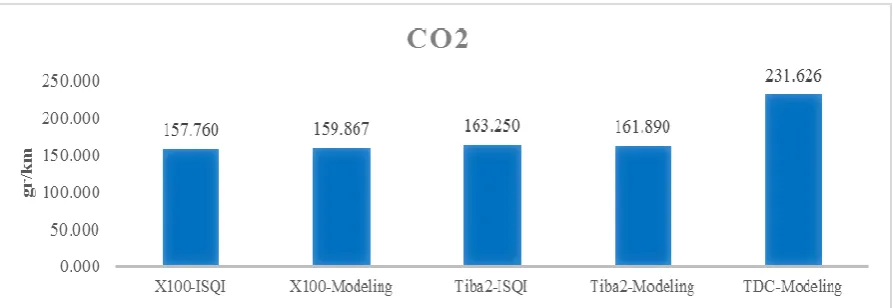
Fig. 3. Comparison of CO2 emission in ISQI and IVE modeling as well as TDC mode
Furthermore, according to the results from ISQI’s 100,000-km test, the amount of CO2 emissions modeling from X100 and Tiba2 was about 160 gr/km that was in the range. While the modeled CO2 emission rate was 232 gr/km in TDC, i.e., 1.5 times
Table 6. Emissions in gr/km, based on modeling at TDC (criteria part)
CO VOC VOCevap. NOx SOx PM
start-up TDC 13.849 1.178 1.178 0.661 0.002 0.017
driving
TDC 0.721 0.023 0.156 0.147 0.004 0.002 Congested 6.495 0.559 7.563 1.558 0.094 0.038 Urban 4.953 0.261 2.914 0.881 0.042 0.018 Extra urban 1.094 0.043 0.370 0.184 0.007 0.003 Highway 0.920 0.024 0.115 0.200 0.004 0.002 X100 0.263 0.019 0.157 0.067 0.003 0.001 Tiba 0.312 0.019 0.153 0.072 0.003 0.001
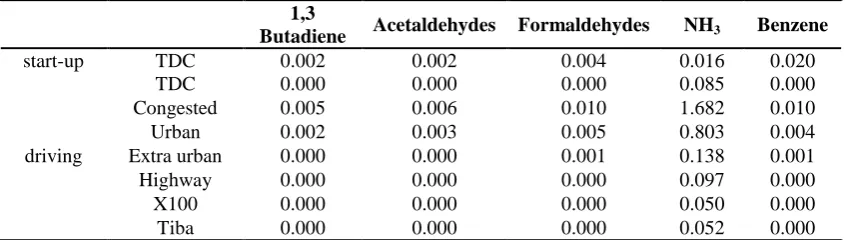
Table 7. Emissions in gr/km, based on modeling at TDC (toxics part)
1,3
Butadiene Acetaldehydes Formaldehydes NH3 Benzene
start-up TDC 0.002 0.002 0.004 0.016 0.020
driving
TDC 0.000 0.000 0.000 0.085 0.000
Congested 0.005 0.006 0.010 1.682 0.010
Urban 0.002 0.003 0.005 0.803 0.004
Extra urban 0.000 0.000 0.001 0.138 0.001
Highway 0.000 0.000 0.000 0.097 0.000
X100 0.000 0.000 0.000 0.050 0.000
Tiba 0.000 0.000 0.000 0.052 0.000
Table 8. Emissions in gr/km, based on modeling at TDC (global warming part)
CO2 N2O CH4
start-up TDC 47.154 0.015 0.236
driving
TDC 231.626 0.003 0.007 Congested 5419.665 0.068 0.160 Urban 2419.540 0.030 0.075 Extra urban 390.151 0.005 0.012 Highway 241.330 0.003 0.007 X100 159.866 0.002 0.005 Tiba 161.890 0.002 0.006
Table 9. Emission rate of air pollutants in kg/year of Saipa fleet in TDC at 20,000 km survey
(kg/year) CO VOC NOx SOx PM CO2
TDC 144.30 4.70 29.49 0.80 0.39 46325.24
Congested 1299.03 111.71 311.56 18.74 7.68 1083933.04
Urban 990.53 52.21 176.15 8.36 3.67 483907.96
Extra urban 218.73 8.53 36.84 1.35 0.63 78030.29
Highway 184.06 4.83 40.01 0.83 0.44 48265.92
X100-LAB 52.61 3.83 13.48 0.55 0.23 31973.30
Tiba-LAB 62.40 3.88 14.43 0.56 0.24 32378.01
Table 10. Personal car emissions in AQCC report for 20,000 Km survey
CO2
(kg/year)
CO (kg/year)
NOx
(kg/year)
VOC (kg/year)
VOCevap.
(kg/year)
SOx
(kg/year)
PM (kg/year)
Considering the Emission Inventory of the Tehran Air Quality Control Co. (AQCC, 2015), personal car emissions were of the highest amounts for CO2, CO, NOx ,VOC, VOCevap., SOx, and PM pollutant agents in Tehran city (Table. 10), results show that Euro 4 Emission Standard plays an important role in reducing the air pollution.
With regard to the 20,000 km/year rate, which indicates average yearly mileage in Tehran city for passenger cars (Hashemian, 2013), Table 9 shows the emission rates of Saipa fleet in Tehran. In case of proper functioning, it meets Euro 4 standard and fits with proper catalytic converters.
Based on the results, significant differences among New European Driving Cycle, Tehran driving Cycle, and Tehran Air Quality Control Company report that expanded traffic conditions from morning traffic peak hour in working day in autumn to all traffic situations, show that relying on hypothetical situation and not taking real situations into consideration, result in inapplicable emissions from light duty vehicle. Nevertheless, due to the evolutions in technology and driving conditions, NECD has become outdated. Thanks to the shortcomings of NEDC, the automotive industry has actively contributed to the development of new global test cycle, known as the Worldwide Harmonized Light Vehicle Test Procedure (WLTP), which came into force in September 2017. The Worldwide harmonized Light vehicles Test Cycles (WLTC) are chassis dynamometer tests to determine emissions and fuel consumption from light-duty vehicles. The tests have been developed by the UN ECE GRPE (Working Party on Pollution and Energy) Group. The WLTC cycles are part of the Worldwide harmonized Light vehicles Test Procedures (WLTP), published as UNECE Global technical regulation No. 15 (GTR 15). While the acronyms WLTP and WLTC are sometimes used interchangeably, the WLTP procedures define a number of
other procedures—in addition to the WLTC test cycles—that are needed to type approve a vehicle (UNECE, European Commission, 2017).
CONCLUSION
Similar to other megacities all around the world, the increasing rate of air pollution is the major issue for urban authorities in Tehran, too. Since the mobile sources are chiefly responsible of all air pollutants emission in Tehran city, it is needed to monitor, assess, control, and reduce the amount of emissions released from mobile sources in the atmosphere. One of the outstanding urban management tools is to determine the amount of air pollutants, produced by Iranian automakers, as a new fleet, compared to others in Tehran. The present research used International Vehicle Emission modeling software to verify SAIPA Co. fleet emissions, based on the Euro 4 emission standard (SAIPA Co. recognized as superior Iranian brand at vehicle industry) as a new fleet. Based on the results, the modeling and lab results of New European Driving Cycle had over 90% conformity. According to the ISQI’s 100,000-km test results, the amount of CO2 emissions modeling from X100 and Tiba2’s was about 160 gr/km, being within the range. On the contrary, the modeled CO2 emission rate was 232 gr/km in TDC, i.e., 1.5 times more than laboratory test, as a result of different driving cycle usages.
ACKNOWLEDGEMENT
This work was supported by Dr. Rashidi and Dr. Atabi. The authors would like to acknowledge SAIPA Automotive Industry Research and Innovation Center, Mega Motor Co., and Saipa Co. for their valuable assistance in conducting relevant tests of emission standard. We gratefully acknowledge International Sustainable Systems Research Center (ISSRC) for providing the IVE model, version 2 (http://www.issrc.org). Also many thanks are given to Dr. Fotouhi for his help on Tehran Driving Cycle Data.
REFERENCES
Amini, H., Taghavi-Shahri, S., Henderson, S., Hosseini, V., Hassankhany, H., Naderi, M., Ahadi, S., Schindler, C., Künzli, N. and Yunesian, M. (2016). Annual and seasonal spatial models for nitrogen oxides in Tehran, Iran. Sci. Rep, 6:32970.
Ashrafi, K. (2012). Determining of spatial distribution patterns and temporal trends of an air pollutant using proper orthogonal decomposition basis functions. Atmos. Environ., 47, 468–476.
Bidokhti, A. and Shariepour, Z. (2010). Upper air meteorological conditions of acute air pollution episodes (case study: Tehran). J. Environ. Stud., 35(52).
Fameli, K. and Assimakopoulos, V. (2015). Development of a road transport emission inventory for Greece and the Greater Athens Area: effects of important parameters. Sci. Total Environ., 505, 770–786.
Fotouhi, A. and Montazeri-Gh, M. (2011). Introduction: Traffic condition recognition using the k-means clustering method. Sci. Iran., 8 (4), 930–937.
Fotouhi, A. and Montazeri-Gh, M. (2011). Tehran driving cycle development using the k-means clustering method. Sci. Iran., 20 (2), 286–293.
Gallardo, L., Jerónimo Escribano, L., Dawidowski, N.R. and Maria de Fátima Andrade, M.O. (2011). Evaluation of vehicle emission inventories for carbon monoxide and nitrogen oxides for Bogotá, Buenos Aires, Santiago, and São Paulo, Atmos. Environ., 47, 12-19.
Ghadiri, Z., Rashidi, Y. and Broomandi, P. (2017). Evaluation Euro IV of effectiveness in transportation systems of Tehran on air quality: Application of IVE model. Pollution, 3(4), 639- 653.
Guo, H., Zhang, Q.Y., Shi, Y. and Wang, D.H. (2007). Evaluation of the International Vehicle Emission (IVE) model with on-road remote sensing measurements. J. Environ. Sci., 19(7), 818–826.
Hai Van, H. and Thi Kim Oanh, N. (2015). Traffic emission inventory for estimation of air quality and climate co-benefits of faster vehicle technology intrusion in Hanoi, Vietnam, J. Carbon Mang., 6(3-4), 117- 128.
Hashemian, S., Mansouri, N. and Morady, M. (2013). Investigating the Impacts of Retrofitted CNG Vehicles on Air Pollutant Emissions in Tehran. Int. J. Environ. Res, 7(3), 669-678.
International Agency for Research on Cancer, Air Pollution and Cancer, (2013), IARC scientific publication No. 161, Geneva, Switzerland.
Iranian National Standards Organization(2004). Road vehicles – Emissions of pollutants, Institute of Standards and Industrial Research of IRAN, The Iran's National standard 7328, Tehran, Iran.
Kassomenos, P., Karakitsios, S. and Papaloukas, C. (2006). Estimation of daily traffic emissions in a South-European urban agglomeration during a workday. Evaluation of several ―what if‖ scenarios. Sci. Total Environ. 370(2–3), 480–490.
Katsura, H. (2012). The Effect of Latitude on Carbon, Nitrogen and Oxygen Stable Isotope Ratios in Foliage and in Nitric- oxide ions of Aerosols. Int. J. Environ. Res., 6 (4), 825-836.
Lee, J. G., Lee, K. H., Choi, H. I., Moon, H. I. and Byeon, S.H. (2012). Total Dust and Asbestos Concentrations during Asbestos-Containing Materials Abatement in Korea. Int. J. Environ. Res., 6 (4), 849-852.
Li, T., Chen, X. and Yan, Z. (2013). Comparison of fine particles emissions of light-duty gasoline vehicles from chassis dynamometer tests and on-road measurements. Atmos. Environ. 68, 82–91.
Mishra, D. and Goyal, P. (2014). Estimation of vehicular emissions using dynamic emission factors: a case study of Delhi. India. Atmos. Environ., 98, 1–7.
Montazeri-Gh, M. and Naghizadeh, M. (2007). Development of the Tehran car driving cycle, Int. J. Enviro. Poll., 30(1), 106 –118.
Naddafi, K. (2012). Health impact assessment of air pollution in megacity of Tehran, Iran. Iran. J. Environ. Health Sci. Eng., 9(1), 1–7.
Pollution is licensed under a "Creative Commons Attribution 4.0 International (CC-BY 4.0)" commercial vehicles. Atmos. Environ., 45(7),
1413–1417.
Outapa, P., Thepanondh, S., Kondo, A. and Pala-En, N. (2017). Development of air pollutant emission factors under real-world truck driving cycle, Int. J. Sus. Trans.
Penwadee Cheewaphongphan, P., Junpen , A., Garivait, S. and Chatani, S. (2017). Emission Inventory of On-Road Transport in Bangkok Metropolitan Region (BMR) Development during 2007 to 2015 Using the GAINS Model. Atmos., 8(9), 167.
Presidency of I.R.I., Plan and Budget Organization, Statistical Center of Iran, Population and Housing Censuses, (2016), CENSUS 2016 report, Tehran, Iran.
Pulkrabek, W.W. (1997). Engineering Fundamentals of the Internal Combustion Engine. (New Jersey: Prentice Hall).
Quesada-Rubio, J. M., Villar-Rubio, E., Mondéjar-Jiménez, J. and Molina-Moreno, V. (2011). Carbon Dioxide Emissions vs. Allocation Rights: Spanish Case Analysis. Int. J. Environ. Res., 5 (2), 469-474.
Rashidi, Z.H., Karbassi, A.R., Ataei, A., Ifaei, P., Samiee- Zafarghandi, R. and Mohammadizadeh, M. J. (2012). Power Plant Design Using Gas Produced by Waste Leachate Treatment Plant. Int. J. Environ. Res., 6 (4), 875-882.
Sekhavatjou, M. S. and Zangeneh, A. (2011). Asbestos Concentrations and Lung Restrictive Patterns. Int. J. Environ. Res., 5 (2), 555-560.
Shaddick, G., Thomas, M.L., Green, A., Brauer, A., Donkelaar, A., Burnett, R., Chang, H.H., Cohen, A., Van Dingenen, R., Dora, C., Gumy, S., Liu, Y., Martin, R., Waller, L.A., West, J., Zidek, J.V. and Prüss‐Ustün, A. (2018). Data integration model for air quality: a hierarchical approach to the global estimation of exposures to ambient air pollution. Appl. Statist. 67 (1), 231–253.
Shafabakhsh, G., Taghizadeh, S. and Mehrabi Kooshki, S. (2018). Investigation and sensitivity analysis of air pollution caused by road transportation at signalized intersections using IVE model in Iran. Eur. Transp. Res. Rev., 10(7).
Shafie-pour, M. and Tavakoli, A. (2013). On Road Vehicle Missions Forecast Using IVE Simulation Model, Int. J. Environ. Res., 7(2), 367- 376.
Shahbazi, H., Reyhanian, M., Hosseini, V. and
Afshin, H. (2016). The Relative Contribution of Mobile Sources to Air Pollution Emissions in Tehran, Iran: An Emission Inventory Approach. Emiss. Control Sci. Technol., 2, 44- 56.
Shahbazi, H., Babaii, M., Afshin, H. and Hosseini, V. (2015). Tehran Air Quality Control Company Report, Emission inventory of Tehran city based on 2013, Tehran, Iran, Part 2. QM/94/04/03//(U)/02.
Sohrabinia, M. and Khorshiddoust, A.M. (2007). Application of satellite data and GIS in studying air pollutants in Tehran. Habitat. Int., 31(2), 268–275.
The United Nations Economic Commission for Europe (UNECE), working party on pollution and energy (GRPE), (2017), Worldwide harmonized Light duty driving Test Cycle and Worldwide harmonized Light duty driving Test Procedure, ECE/TRANS/WP.29/GRPE/2017/10.
UNITED NATIONS, Uniform provisions concerning the approval of vehicles with regard to the emission of pollutants according to engine fuel requirements, (2015), Regulation No. 83, E/ECE/TRANS/505/Rev.1/Add.82/Rev.5.
Wang, H. K., Chen, C. H., Huang, C. and Fu, L. X. (2008). On-road vehicle emission inventory and its uncertainty analysis for Shanghai, China. Sci. Total Environ., 398 (1-3), 60-67.
Wang, K., Lixin, F. and Jinchuan, C. (2010). Developing a High- Resolution Vehicular Emission Inventory by Integrating an Emission Model and a Traffic Model: Part 2-A Case Study in Beijing, J. Air Waste Manage. Assoc., 60(12), 1471-1475.
Wang, P., Zhao, D., Wang, W., Mu, H., Cai, G. and Liao, C. (2011). Thermal Effect on Pollutant Dispersion in an Urban Street Canyon. Int. J. Environ. Res., 5 (3), 813-820.
Zhang, K., Batterman, S. and Dion, F. (2011). Vehicle emissions in congestion: Comparison of work zone, rush hour and free-flow conditions. Atmos. Environ., 45 (11), 1929-1939.
Zhang, Q. (2013). Air pollutant emissions from vehicles in China under various energy scenarios. Sci. Total Environ., 450, 250–258.