DEMOGRAPHIC RESEARCH
VOLUME 29, ARTICLE 13, PAGES 323-354
PUBLISHED 27 AUGUST 2013
http://www.demographic-research.org/Volumes/Vol29/13/ DOI: 10.4054/DemRes.2013.29.13
Research Article
Impact of different mortality forecasting
methods and explicit assumptions on projected
future life expectancy: The case of the
Netherlands
Lenny Stoeldraijer
Coen van Duin
Leo van Wissen
Fanny Janssen
© 2013 Stoeldraijer, van Duin, van Wissen & Janssen.
This open-access work is published under the terms of the Creative Commons Attribution NonCommercial License 2.0 Germany, which permits use, reproduction & distribution in any medium for non-commercial purposes, provided the original author(s) and source are given credit.
1 Introduction 324
2 Data and methods 326
2.1 Methodology 326
2.2 Data 328
2.3 The models in more detail 328
3 Forecasting methods in Europe 330
4 Forecasts for the Netherlands 332
5 Results of different methods for Dutch mortality 335
6 Discussion 339
6.1 Summary of the results 339
6.2 Reflection on the differences in the outcomes 339
6.3 Reflection on the explicit assumptions used 340
6.4 Explanation of the observed projection outcomes 342
6.5 Forecasting considerations 344
7 Overall conclusion 346
Impact of different mortality forecasting methods and explicit
assumptions on projected future life expectancy:
The case of the Netherlands
Lenny Stoeldraijer1,3
Coen van Duin1
Leo van Wissen2,3
Fanny Janssen3,4
Abstract
BACKGROUND
With the rapid aging of the population, mortality forecasting becomes increasingly important, especially for the insurance and pension industries. However, a wide variety of projection methods are in use, both between and within countries, that produce different outcomes.
OBJECTIVE
We review the different mortality forecasting methods and their assumptions in Europe, and assess their impact on projections of future life expectancy for the Netherlands.
METHODS
For the Netherlands, we assess the projections of life expectancy at birth (e0) and at age 65 (e65) up to 2050 resulting from different methods using similar explicit assumptions regarding the historical period and the jump-off rates. We compare direct linear extrapolation, the Lee-Carter model, the Li-Lee model, a cohort model, separate projections of smoking- and non-smoking-related mortality, and the official forecast.
RESULTS
In predicting mortality, statistical offices in Europe mostly use simple linear extrapolation methods. Countries with less linear trends employ other approaches or different assumptions. The approaches used in the Netherlands include explanatory
1 Statistics Netherlands, The Hague, the Netherlands.
2 Netherlands Interdisciplinary Demographic Institute (NIDI), The Hague, the Netherlands. 3 Population Research Centre, Faculty of Spatial Sciences, University of Groningen, the Netherlands. 4
models, the separate projection of smoking- and non-smoking-related mortality, and the projection of the age profile of mortality. There are clear differences in the explicit assumptions used, including assumptions regarding the historical period. The resulting e0 in 2050 varies by approximately six years. Using the same historical period (1970-2009) and the observed jump-off rates, the findings generated by different methods result in a range of 2.1 years for women and of 1.8 years for men. For e65, the range is 1.4 and 1.9 years, respectively.
CONCLUSIONS
As the choice of the explicit assumptions proved to be more important than the choice of the forecasting method, the assumptions should be carefully considered when forecasting mortality.
1. Introduction
With the rapid aging of the population, mortality forecasts have become more important. Recent reforms in the pension systems in Europe—which were necessary to ensure that pensions remain sustainable—have made the link between pensions and changes in life expectancy more apparent than ever. In general, monthly pension payments are based on remaining life expectancy when people retire. But whereas in some countries benefit levels are linked to life expectancy (Germany, Finland, and Portugal), in others the pension age is set to rise with increasing life expectancy (Denmark, the Netherlands), or the contribution period for pensions is set to be extended as people live longer (France) (OECD 2007). The accurate modelling and projection of mortality rates and life expectancy are therefore of growing interest to researchers.
In the past, most methods were relatively simple and were largely based on subjectivity (Pollard 1987). Over time, however, more sophisticated methods that make increasing use of standard statistical methods have been developed and applied (Booth and Tickle 2008). The majority of these methods can be classified as extrapolative approaches, of which the Lee-Carter method has become dominant. This method summarises mortality by age and period for a single population as an overall time trend, an age component, and the extent of change over time by age (Lee and Carter 1992).
One of the strengths of the Lee-Carter method and of extrapolation methods in general is their robustness in situations in which age-specific log mortality rates have linear trends (Booth et al. 2006). However, some countries have less linear trends (e.g., Booth, Maindonald, and Smith 2002 for Australia; Renshaw and Haberman 2006 for England and Wales; Janssen, Kunst, and Mackenbach 2007 for the Netherlands). It is therefore important to debate whether merely ―objective‖ linear extrapolation methods should be employed, despite the non-linearity in the trends, or whether adding information—e.g., by including a cohort effect or trends in other countries, or by using more explanatory models—is preferable, despite the subjectivity this would involve.
One example of a method which includes additional information is coherent forecasting (Li and Lee 2005). This extension of the Lee-Carter model seeks to ensure that the forecasts for related populations maintain certain structural relationships based on commonalities in their historical trends; for example, that forecasts for similar countries are not radically different. The Lee-Carter method has also recently been extended to include a cohort dimension (Renshaw and Haberman 2006), and other stochastic models have been introduced to integrate the cohort dimension in mortality forecasting (see Cairns et al. 2011). Other examples are forecasting methods using valuable medical knowledge and information on behavioural and environmental changes, such as smoking and/or obesity (e.g. Pampel 2005; Olshansky et al. 2005; Bongaarts 2006; Janssen and Kunst 2007; Stewart, Cutler, and Rosen 2009; Wang and Preston 2009; King and Soneji 2011; Janssen, van Wissen, and Kunst 2013). Although these new types of methods have many advantages, the more explanatory methods involve a large element of subjective judgment (see Section 6.5 for a further discussion). Furthermore, as all of the above-mentioned methods are fairly new, the number of times they have been applied is still relatively small.
and Shang, Booth, and Hyndman (2011). Other studies (CMI 2005, 2006, 2007; Cairns et al. 2011) have compared the Lee-Carter model (and its cohort extension) with other extrapolative statistical models, such as P-splines models and the statistical model CBD (see Cairns, Blake and Dowd, 2006). These studies showed that using different assumptions leads to different outcomes, and that comparing different variants and extensions does not automatically result in the identification of a single best method. The historical period used is the main determinant of large differences in outcomes (see also Janssen and Kunst 2007), especially when there is considerable non-linearity in the trends.
Comparison studies of different types of methods, including both extrapolation and explanatory approaches, are not often undertaken. The comparison of outcomes from different studies is hampered by differences in the explicit assumptions; i.e., in the specific choices that must be explicitly stated in a method, such as the choice of the length of the historical period and of the jump-off rates. It would be helpful to examine, however, whether differences in projection outcomes within a country are caused by different methods, or by the use of the explicit assumptions.
The purpose of this study is to review the different mortality forecasting methods and their assumptions in Europe, and to assess their impact on projections of future life expectancy for the Netherlands.
More specifically, (i) we will review the current methods used in official mortality forecasts in Europe; (ii) compare the outcomes and the assumptions of different projection methods within the Netherlands; and (iii) compare the outcomes of different types of methods for the Netherlands using similar explicit assumptions, including the same historical period.
2. Data and methods
2.1 Methodology
After first reviewing the current methods for forecasting mortality used by statistical offices in Europe and the different national and international forecasts/projections that exist for the Netherlands, we will show to what extent different methods applied to Dutch data for the period 1970-2009 lead to different future values of life expectancy up to 2050. For the latter, we look at two outcome measures: life expectancy at birth and, in light of pension reforms, life expectancy at age 65. Moreover, we limit our own calculations to methods based on extrapolating the trends in age-specific death rates.
using the following search words: ―mortality forecasting,‖ ―forecasting,‖ ―mortality projection,‖ ―population projection,‖ and ―projection.‖ Information on the methods is given for Austria, Belgium, Denmark, France, Italy, Ireland, Luxemburg, the Netherlands, Norway, Poland, Portugal, Spain, Sweden, and the UK. Mortality forecasts for the Netherlands are published by Statistics Netherlands, the Actuarial Society, RIVM (National Institute for Public Health and the Environment), Eurostat (EUROPOP2010), and by four research projects: TOPALS (De Beer 2012); UPE (Alders et al. 2007); Janssen, van Wissen, and Kunst (2013); and the European Demographic Datasheet (VID/IIASA/PRB 2012).
The six different methods we applied to the Dutch data for 1970-2009, separately for both sexes, are:
direct linear extrapolation;
the Lee-Carter model (Lee and Carter 1992);
an extension of the Lee-Carter model that includes the mortality experiences of other countries (Li and Lee 2005);
an extension of the Lee-Carter model that includes a cohort dimension (Renshaw and Haberman 2006);
a model in which smoking-related and non-smoking-related mortality is projected separately (Janssen and Kunst 2010; Janssen, van Wissen, and Kunst 2013); and
the method used between 2004 and 2010 in the official forecast by Statistics Netherlands.
Our review showed that these methods—which represent fundamentally different approaches—were among the mortality forecasting methods used most frequently by the statistical offices in Europe, including in the Netherlands. We have chosen to avoid explicitly applying an expectation approach method because of the high degree of dependence on expert opinion in setting the target; e.g., every outcome can be set. We have also decided to ignore other methods that do not specifically extrapolate trends in age-specific death rates. See Section 2.3 for a more detailed description of the applied methods.
2.2 Data
Data on all-cause mortality and population numbers by sex, age (0, 1-4, 5-9, …, 90-94, 95+), and year (1970-2009) were obtained from Statistics Netherlands. For the Li-Lee model, the same data were also obtained for Denmark, England and Wales, Finland, France, Italy, Norway, Spain, Sweden, Switzerland, and West Germany from the Human Mortality Database. Lung cancer mortality data and cause-specific mortality data were obtained from Statistics Netherlands for the separate projection of smoking- and non-smoking-related mortality and for the official forecast, respectively.
2.3 The models in more detail
The direct linear extrapolation model is given by
( ) (1)
where denotes the central mortality rate at age x and year t, indicates the constant age pattern, denotes the set of age-specific constants that describe relative rate of change at any age, and denotes the residual error.
The Lee-Carter model (Lee and Carter 1992) is given by
( ) (2)
where denotes the underlying time development. is set equal to the average over time of . and are found using Singular Value Decomposition under the assumptions ∑ and ∑ . After estimation, we adjusted to fit the observed life expectancy (Lee and Miller 2001) and extrapolated using a random walk with drift.
The Li-Lee method is an extension of the Lee-Carter method, which takes into account the mortality experiences of other populations, such as countries (Li and Lee 2005). Short-term differences in mortality are preserved, but in the long term, the age-specific death rates within the group of countries are limited to a constant ratio to one another. In essence, the Lee-Carter method is applied twice: first to all countries combined ( ) , and then to the residuals
(
resi t x res
i t res
i x t x i x i t
x a BK b k
m,, , ˆ ˆ , , ,,
from the first equation. The estimates are combined into one model for the country concerned:
(3)
The time parameter of the residual ( ) is extrapolated using an autoregressive model (AR(1)). The other specifications are the same as in the Lee-Carter method described above. The mortality experiences of the 10 low-mortality countries surrounding the Netherlands are taken as the experiences of the other populations; i.e., Denmark, England and Wales, Finland, France, Norway, Spain, Sweden, Switzerland, and West Germany.
The cohort model represents an extended version of the Lee-Carter model with an extra parameter which denotes the underlying cohort effect that is a function of the year of birth t - x (Renshaw and Haberman 2006). The model is given by
( ) (4)
Thus, this model includes the age effect, the period effect, and the cohort effect. Because of the inclusion of cohorts, age groups zero and 1-4 are combined so that the age groups are of equal length. Furthermore, cohorts with fewer than four observation years are not taken into account. The parameters are estimated by an iterative process (by maximum likelihood) using the constraints ∑ , ∑ , ∑ and
∑ . After estimation, is adjusted to fit the observed life expectancy and is
extrapolated using a random walk with drift. To avoid unrealistic future mortality patterns, gamma ( ) is set to zero for the cohorts outside the data. We have chosen zero because no clear trend for the cohort parameter was shown in the Dutch data, and its average over the whole period was close to zero. Because of this constraint, caution is warranted when interpreting the outcomes of this cohort model.
Statistics Netherlands publishes a mortality forecast as part of its official population forecast for the Netherlands (Van Duin et al. 2011). Overall mortality is forecast using decomposition by cause of death (Van Duin et al. 2011; De Jong and Van Der Meulen 2005). The probability of dying from a specific cause-of-death group in a specific age interval is projected for selected sample years. The techniques used are extrapolation combined with expert opinion, but epidemiological information (smoking) is also used. The all-cause probability of surviving is calculated by multiplying the probability of surviving for each cause of death. Intermediate years are calculated by interpolation. The Brass-logit method (Brass 1971) is used to calculate specific probabilities from the probabilities per age interval. The smoothed age-specific probabilities of dying of the last two observed years are used as a model curve.
3. Forecasting methods in Europe
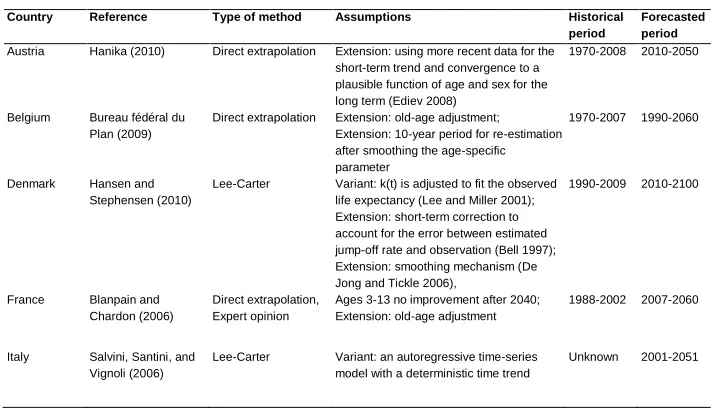
The approaches currently used by statistical offices in Europe to project future mortality vary considerably (see Table 1). Extrapolation methods are used most frequently. These methods are either a direct linear extrapolation of the logarithm of the age-specific mortality rates (Austria, Belgium, France, and Spain), or a variant of the Lee-Carter model (Denmark, Italy, Norway, Portugal, and Sweden). Ireland, Luxembourg, Poland, and the UK use a more subjective target approach. For Poland and Luxembourg, information on trends in other countries is included directly in the projection. Statistics Netherlands projects cause-specific mortality using extrapolation techniques combined with expert opinion (Van Duin et al. 2011; De Jong and Van Der Meulen 2005). This is the only national statistical office in our selection that includes epidemiological information directly in its projection. Portugal, France, Ireland, and the UK also include expert opinion in their mortality forecasts. Indirectly, through the knowledge of the experts, this could include trends in other countries and epidemiological information.
In addition to the differences in the methods used, there are also differences in the variants and the extensions employed. Denmark, Italy, Portugal, and Sweden use different variants of the original Lee-Carter method. Norway and Denmark extend the original method. Belgium and Spain extend the direct extrapolation method with a re-estimation after smoothing the age-specific parameter, but use a different period for the re-estimation. Belgium and France both make some adjustments for old-age mortality. Ireland and the UK make a similar assumption about the target value; namely, a constant improvement rate after some year in the future. The UK includes a cohort approach for the convergence because of the apparent cohort effects in that country.
Denmark, France, Spain, and Sweden use relatively short periods (20, 15, 17, and 13 years, respectively). There is also variation in the length of the forecasted period, ranging from 28 (Poland) to 91 years (Denmark), although this does not seem to correlate with the length of the historical period.
It appears that the observed past trends determine which method and historical period is used. Life expectancy at birth in western Europe has increased by six to 10 years since 1970 (WHO Health Database, Human Mortality Database). All of the countries in western Europe have experienced a rise in life expectancy, albeit at different rates and with periods of stagnation. Countries with a more linear trend (e.g., France and Switzerland) use extrapolation methods with an average historical period, while countries with more non-linear trends (e.g., Denmark, the Netherlands, and Norway) use different approaches in order to take non-linearity into account. Denmark, which has a history of having a less linear trend among women in particular, uses an extrapolation method, but with a short historical period. The Netherlands, which has non-linear trends among both men and women, uses epidemiological information in the forecast. Norway, with a period of stagnation in the 1980s among men, uses a very long period, but includes a quadratic age effect to account for the non-linearity.
Table 1: Methods and assumptions behind mortality forecasting methods of statistical offices in Europe
Country Reference Type of method Assumptions Historical
period
Forecasted period
Austria Hanika (2010) Direct extrapolation Extension: using more recent data for the short-term trend and convergence to a plausible function of age and sex for the long term (Ediev 2008)
1970-2008 2010-2050
Belgium Bureau fédéral du Plan (2009)
Direct extrapolation Extension: old-age adjustment; Extension: 10-year period for re-estimation after smoothing the age-specific parameter
1970-2007 1990-2060
Denmark Hansen and Stephensen (2010)
Lee-Carter Variant: k(t) is adjusted to fit the observed life expectancy (Lee and Miller 2001); Extension: short-term correction to account for the error between estimated jump-off rate and observation (Bell 1997); Extension: smoothing mechanism (De Jong and Tickle 2006),
1990-2009 2010-2100
France Blanpain and Chardon (2006)
Direct extrapolation, Expert opinion
Ages 3-13 no improvement after 2040; Extension: old-age adjustment
1988-2002 2007-2060
Italy Salvini, Santini, and Vignoli (2006)
Lee-Carter Variant: an autoregressive time-series model with a deterministic time trend
Table 1: (Continued)
Country Reference Type of method Assumptions Historical
period
Forecasted period
Ireland Central Statistics Office (2008)
Target value, Expert opinion
Long-term rate of 1.5% per annum from 2031 onwards;
Extension: linear interpolation between mortality declines in 2005 and 2031
1926-2005 2011-2041
Luxembourg STATEC (2005) Target value Assumptions of Eurostat (convergence in 2100 for all EU countries; BMS method (Booth et al. 2002) for total group)
1962-2005 2005-2055
Netherlands Van Duin et al. (2011) Cause of death, Direct extrapolation, Lee-Carter, Expert opinion
Different assumptions per cause of death, depending on historical trend
1970-2009 2010-2060
Norway Keilman and Pham (2005), Brunborg and Texmon (2010)
Lee-Carter Extension: a quadratic age effect 1900-2008 2010-2060
Poland Glówny Urzad Statystyczny (2009)
Target value “Catch-up” with developed countries 21-22 years later
1950-2005 2008-2035
Portugal Instituto Nacional de Estatística (2009)
Lee-Carter, Expert opinion
Variant: Poisson log-bilinear model (Brouhns et al. 2002, Bravo 2007)
1980-2007 2008-2060
Spain Instituto Nacional de Estadistica (2009)
Direct extrapolation 5-year moving average;
Extension: 3-year period for re-estimation after smoothing the age specific parameter
1991-2007 2009-2049
Sweden Statistiska centralbyrån (2005)
Lee-Carter Variant: no correction for time component 1990-2002 2003-2050
United Kingdom
Office for National Statistics (2009)
Target value, Expert opinion
Annual rate of improvement converges to 1.0% in 2033 and remains constant thereafter;
Variant: partly cohort approach for convergence
1900-2008 2008-2083
4. Forecasts for the Netherlands
2000. Overall, mortality improvements in other countries in western Europe in the period 1970-2009 were slightly larger and more linear.
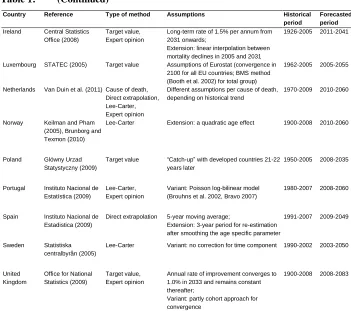
Because of this non-linearity, it is not surprising that various agencies and researchers in the Netherlands have paid particular attention to mortality projection methodology. They used different methods and different assumptions, resulting in a number of different mortality projections for the Netherlands (see Table 2). International projects, which contain results for the Netherlands (EUROPOP2010, TOPALS, UPE, and European Demographic Datasheet), use a more general method of extrapolation and targeting. TOPALS (De Beer 2012) makes use of a linear spline, which produces a smoother age curve than, for example, the Lee-Carter method. The European Demographic Datasheet (VID/IIASA/PRB 2012) takes into account that mortality dynamics are characterised by considerable inertia, which generates a more optimistic outlook for future mortality. All four take into account trends in other countries.
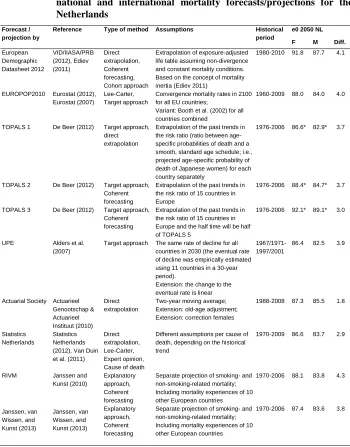
Table 2: Methods, assumptions, and outcomes (e0 in 2050) of different national and international mortality forecasts/projections for the Netherlands
Forecast / projection by
Reference Type of method Assumptions Historical
period
e0 2050 NL
F M Diff.
European Demographic Datasheet 2012 VID/IIASA/PRB (2012), Ediev (2011) Direct extrapolation, Coherent forecasting, Cohort approach
Extrapolation of exposure-adjusted life table assuming non-divergence and constant mortality conditions. Based on the concept of mortality inertia (Ediev 2011)
1980-2010 91.8 87.7 4.1
EUROPOP2010 Eurostat (2012), Eurostat (2007)
Lee-Carter, Target approach
Convergence mortality rates in 2100 for all EU countries;
Variant: Booth et al. (2002) for all countries combined
1960-2009 88.0 84.0 4.0
TOPALS 1 De Beer (2012) Target approach, direct extrapolation
Extrapolation of the past trends in the risk ratio (ratio between age-specific probabilities of death and a smooth, standard age schedule; i.e., projected age-specific probability of death of Japanese women) for each country separately
1976-2006 86.6* 82.9* 3.7
TOPALS 2 De Beer (2012) Target approach, Coherent forecasting
Extrapolation of the past trends in the risk ratio of 15 countries in Europe
1976-2006 88.4* 84.7* 3.7
TOPALS 3 De Beer (2012) Target approach, Coherent forecasting
Extrapolation of the past trends in the risk ratio of 15 countries in Europe and the half time will be half of TOPALS 5
1976-2006 92.1* 89.1* 3.0
UPE Alders et al.
(2007)
Target approach The same rate of decline for all countries in 2030 (the eventual rate of decline was empirically estimated using 11 countries in a 30-year period).
Extension: the change to the eventual rate is linear
1967/1971-1997/2001
86.4 82.5 3.9
Actuarial Society Actuarieel Genootschap & Actuarieel Instituut (2010)
Direct extrapolation
Two-year moving average; Extension: old-age adjustment; Extension: correction females
1988-2008 87.3 85.5 1.8
Statistics Netherlands
Statistics Netherlands (2012), Van Duin et al. (2011)
Direct extrapolation, Lee-Carter, Expert opinion, Cause of death
Different assumptions per cause of death, depending on the historical trend
1970-2009 86.6 83.7 2.9
RIVM Janssen and
Kunst (2010)
Explanatory approach, Coherent forecasting
Separate projection of smoking- and non-smoking-related mortality; Including mortality experiences of 10 other European countries
1970-2006 88.1 83.8 4.3
Janssen, van Wissen, and Kunst (2013) Janssen, van Wissen, and Kunst (2013) Explanatory approach, Coherent forecasting
Separate projection of smoking- and non-smoking-related mortality; Including mortality experiences of 10 other European countries
1970-2006 87.4 83.6 3.8
The different national and international mortality forecasts and projections for the Netherlands produce outcomes for life expectancy at birth in 2050 (see Table 2) that vary by 5.7 years for women and by 6.6 years for men. This large range may be caused by the different methods and the different explicit assumptions, including the different historical periods, used. The highest life expectancy at birth in 2050 is given by TOPALS 3; namely, 92.1 years for women and 89.1 years for men. The lowest values are given by UPE for both women and men; namely, 86.4 and 82.5 years, respectively. The higher projected outcomes for both the European Demographic Datasheet and TOPALS 3 result from projection methodologies that are different from the projection of trends in age-specific mortality rates. Instead, the European Demographic Datasheet uses the notion of mortality inertia; i.e., that younger cohorts are healthier than their older peers, and their future mortality rates may therefore be lower than those of the currently old cohorts (Ediev 2011). By contrast, TOPALS 3 assumes an acceleration in the decrease in future mortality. Furthermore, TOPALS uses a best-practice level of mortality in which direction the death probabilities move. The speed is determined by a partial adjustment model.
There is no clear difference in the outcomes of the methods used in the international projects and of the methods specifically developed for the Netherlands. The European Demographic Datasheet and TOPALS 3 predict life expectancies at the high end of the range for both men and women, whereas TOPALS 1 and UPE predict life expectancies at the lower end of the range. In addition, the inclusion of trends in other countries generates mixed results. The European Demographic Datasheet and TOPALS 3 present a high life expectancy in 2050 for both men and women, but TOPALS 1 and UPE give low values. However, the inclusion of trends in other countries, either by coherent forecasting or by the choice of the target value, produces a greater difference in life expectancy between the sexes in 2050 than the other extrapolation methods.
The historical period used ranges from 20 years (Actuarial Society) to 43 years (EUROPOP2010). Statistics Netherlands includes the most recent data.
5. Results of different methods for Dutch mortality
If different methods are applied to the same historical period, a different range of outcomes can be expected. Thus, we apply methods, similar to the ones in Table 1 and 2, which are used in Europe and the Netherlands to Dutch mortality data for the period 1970-2009 and compare the outcomes.
account for non-linearity in the data, either by including cohort effects or trends in other populations in the Lee-Carter model, or by using more explanatory approaches; i.e., the separate projection of smoking and non-smoking mortality and the projection by cause of death, as is done in the official Dutch forecasts. These methods are all based on the extrapolation of age-specific death rates. See Section 2 for more details.
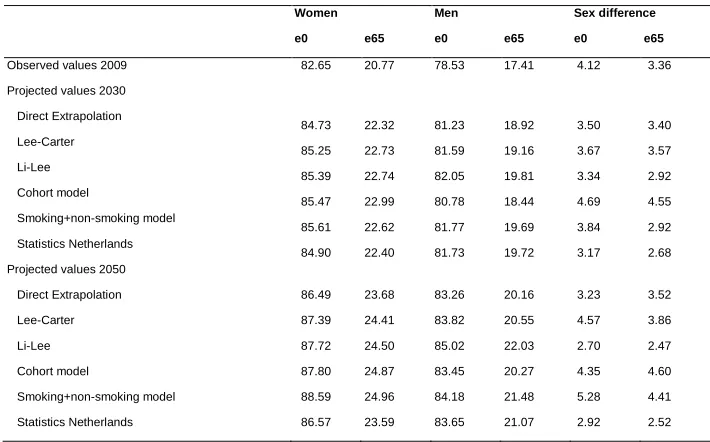
Direct linear extrapolation results in a life expectancy at birth in 2050 of 86.5 years for women and 83.3 years for men (Figure 1, Table 3); i.e., an increase of 3.8 years for women and of 4.7 years for men over the next 40 years. The Lee-Carter method gives higher life expectancy values; i.e., 87.4 years for women and 83.8 years for men. The Li-Lee model generates values of 87.7 years for women and 85.0 years for men, which is the highest of the values for men. The cohort model gives a life expectancy at birth of 87.8 years for women and 83.5 years for men. The smoking+non-smoking model, in which smoking-related mortality and non-smoking-related mortality are projected separately, leads to the highest predicted values; i.e., 88.6 years for women and 84.2 years for men. Statistics Netherlands, which uses a cause-of-death decomposition, projects a life expectancy at birth of 86.6 years for women and 83.7 years for men in 2050.
The difference between the models in life expectancy at birth in 2050 is thus 2.1 years for women and 1.8 years for men. The average increase in life expectancy at birth between 2009 and 2050 is 4.8 years for women and 5.4 years for men. The direct extrapolation model results in a lower life expectancy for both men and women than the other models find. The methods which account for the non-linearity generally generate higher outcomes than the simple extrapolation models do.
Three of the six methods—i.e., the Lee-Carter model, the cohort model, and the smoking+non-smoking model—forecast a larger sex difference in life expectancy at birth in 2050 than was observed in 2009.
When comparing the forecasted values of remaining life expectancy at age 65 in 2050 according to the different forecasting methods, we find that the differences amount to 1.4 years for women, and 1.9 years for men (Figure 2, Table 3). Just as for life expectancy at birth, the smoking+non-smoking model results in the highest remaining life expectancy at 65 for women (25.0 years), and the Li-Lee model results in the highest value for men (22.0 years). The direct extrapolation model results in the lowest value for men (20.2 years) and the second-lowest value for women (23.7 years).
Table 3: Life expectancy at birth and at age 65: observed (2009) and projected values (2030, 2050) for different mortality forecasting methods, the Netherlands, by sex
Women Men Sex difference
e0 e65 e0 e65 e0 e65
Observed values 2009 82.65 20.77 78.53 17.41 4.12 3.36
Projected values 2030
Direct Extrapolation
84.73 22.32 81.23 18.92 3.50 3.40
Lee-Carter
85.25 22.73 81.59 19.16 3.67 3.57
Li-Lee
85.39 22.74 82.05 19.81 3.34 2.92
Cohort model
85.47 22.99 80.78 18.44 4.69 4.55
Smoking+non-smoking model
85.61 22.62 81.77 19.69 3.84 2.92
Statistics Netherlands
84.90 22.40 81.73 19.72 3.17 2.68
Projected values 2050
Direct Extrapolation 86.49 23.68 83.26 20.16 3.23 3.52
Lee-Carter 87.39 24.41 83.82 20.55 4.57 3.86
Li-Lee 87.72 24.50 85.02 22.03 2.70 2.47
Cohort model 87.80 24.87 83.45 20.27 4.35 4.60
Smoking+non-smoking model 88.59 24.96 84.18 21.48 5.28 4.41
Statistics Netherlands 86.57 23.59 83.65 21.07 2.92 2.52
Figure 1: Life expectancy at birth; observed (1970-2009) and projected (2010-2050) values for different mortality forecasting methods,
the Netherlands, by sex
Figure 2: Life expectancy at age 65; observed (1970-2009) and projected (2010-2050) values for different mortality forecasting methods,
the Netherlands, by sex
70 72 74 76 78 80 82 84 86 88 90
1970 1975 1980 1985 1990 1995 2000 2005 2010 2015 2020 2025 2030 2035 2040 2045 2050 Observations Statistics Netherlands Direct Extrapolation Lee-Carter
Smoking+non-smoking Li-Lee Cohort model Female
Male
12 14 16 18 20 22 24 26
1970 1975 1980 1985 1990 1995 2000 2005 2010 2015 2020 2025 2030 2035 2040 2045 2050 Observations Statistics Netherlands Direct Extrapolation Lee-Carter
Smoking+non-smoking Li-Lee Cohort model Female
6. Discussion
6.1 Summary of the results
Mortality projection methods and assumptions clearly differ both between and within countries. In the context of new mortality projection methodologies with a focus on extrapolation, statistical offices in Europe currently predict mortality mainly using extrapolation methods (either direct or Lee-Carter), but they also make use of target values, expert opinion, and cause-specific mortality projections. The method and the historical period used seem to reflect past mortality trends in the country, with simple linear extrapolation being used by countries with gradual increases in life expectancy, and other approaches or different assumptions being applied by countries with non-linear trends.
The approaches used in national and international projections for the Netherlands also include simple linear extrapolation methods, but these are mainly methods that take into account the non-linearity in the observations by including trends in other countries, projecting smoking and non-smoking-related mortality separately, or making projections based on causes of death. The 10 different projections for the Netherlands resulted in a wide range for life expectancy at birth in 2050 of 5.7 for women and 6.6 for men, which may be caused by both the different methods and the different explicit assumptions, including the length of the historical period, that are used.
When we compare different methods using the same historical period, including simple linear extrapolation and models that account for non-linearity, we can see that the differences in outcomes become smaller. Life expectancy at birth in 2050 then ranges from 86.5 to 88.6 for women and from 83.3 to 85.0 for men. For life expectancy at age 65 in 2050, the values range from 23.6 to 25.0 for women and from 20.2 to 22.0 for men. The models that account for non-linearity in past trends predict a less linear trend for the future as well.
6.2 Reflection on the differences in the outcomes
(2007) also found that using different periods may lead to larger differences between the outcomes of the models than the type of models themselves. Moreover, the resulting differences between the outcomes are small compared to the expected average increase in life expectancy at birth between 2009 and 2050, which is 4.8 years for women and 5.4 years for men.
In addition, the range of outcomes, using the same explicit assumptions, is small compared to the range of outcomes for other types of uncertainty. The differences between point forecasts calculated here only describe the uncertainty regarding the type of method. However, there are other types of uncertainty, such as parameter uncertainty (i.e., the uncertainty in the values of the parameters in a given model) and structural uncertainty (i.e., uncertainty because of the stochastic nature of a given model) (Cairns 2000). Parameter and structural uncertainty can be presented by prediction intervals, where parameter uncertainty is very important for long-run forecasts. Statistics Netherlands takes 10 years as a good indicator for the uncertainty of life expectancy at birth in 2050 (Carolina and van Duin 2010). Keilman and Pham (2004) found a 95% prediction interval of life expectancy at birth in 2050 of 13.1 years for women and 7.7 years for men in the Netherlands. This indicates that all projections for the Netherlands presented in this paper can be rated as acceptable, given the estimated uncertainties for earlier forecasts for the Netherlands. It should be noted, however, that the uncertainty of the projections depends to a large extent on the choice of the explicit assumptions, which are not captured by prediction intervals. Furthermore, the variability in rates, which is used to estimate uncertainty, is, on average, underestimated by most methods (Shang et al. 2011).
6.3 Reflection on the explicit assumptions used
In our comparison of the different methods, we used the same explicit assumptions to the greatest extent possible, including the same historical period and the same modelling of . In addition, the most recently observed mortality rates are used as the jump-off rates in all of the projections. These assumptions warrant some attention, however, as they can affect the outcome of the projection, and thus the range of the outcomes.
mortality trends from all-cause mortality trends. This allows us to obtain a more robust long-term trend that can be used as the projection basis (Janssen, van Wissen, and Kunst 2013). Furthermore, using a shorter historical period as the projection base may reduce jump-off error, but this advantage may be lost after a number of years.
We used the most recently observed mortality rates as jump-off rates to ensure that the first year of the forecast matches smoothly and closely, as well as to account for a possible jump-off error (Lee and Miller 2001). However, it could also be argued that the actual purpose of a forecast should be robustness; i.e., that when the observations are updated in the future, these small changes in the observations result in only modest changes in the forecasts (Cairns et al. 2011). The advantage of using the original Lee-Carter method (Lee and Lee-Carter 1992)—and indeed of using many time series approaches—is that it makes it possible to avoid the peculiarities of mortality rates in a particular year by taking the modelled mortality rates as jump-off rates. The two above-mentioned approaches to forecasting (matching the first year of the forecast versus the robustness of the results) conflict with each other, and may lead to substantial differences in outcomes (Janssen, van Wissen, and Kunst 2013). In addition, the range of outcomes might be different if the modelled death rates are used as jump-off rates. Additional analysis reveals that the outcomes of the simple extrapolation methods and the outcomes for men (because of the large increase in life expectancy since 2002) are influenced the most by the choice of the jump-off rates. For instance, life expectancy at birth in 2050 for men using the direct extrapolation method and modelled jump-off rates is one year lower than with observed jump-off rates. For women, the difference is 0.5 years. The Li-Lee method results in a difference of 0.5 for men and 0.2 for women. Because the effect of using modelled instead of observed mortality rates as jump-off rates is different for the various methods, the range will also be affected.
The modelling of in the Lee-Carter model and its extensions determines part of the future development. We used a random walk with drift, which assumes a linear relationship, and that each forecasted mortality rate changes at a constant exponential rate. Moreover, within the direct linear extrapolation and Lee-Carter model, the rates of decrease at different ages maintain the same ratio to one another over time, because of the assumption of a certain pattern of change in the age distribution of mortality. In practice, the relative speed of decrease at different ages may vary.
Demographic Datasheet in Table 2, which uses a method that takes into account mortality inertia).
If more information is included in a model, more assumptions need to be made. For instance, the future share of smoking-attributable mortality within the smoking+non-smoking model is also based on assumptions. See Janssen, van Wissen, and Kunst (2013) for a discussion of this issue. In the cohort model we assumed that the cohort effect in equation (4) is zero. Hence, there can be a discontinuity of the last observed and the first fully projected cohort. Alternatives are, for instance, equal to the last observation or the average of the last few observations.
The longer the projection period, the larger the effect of the assumed cohort effect and of future smoking-related shares in the period life expectancy. In our projections we used a projection horizon equal to the historical period of 40 years. In fact, in more general terms, the effect of the (explicit) assumptions will depend on the chosen projection horizon.
6.4 Explanation of the observed projection outcomes
While the differences in the outcomes of the six methods applied in analysing the Dutch data are small, they are also clear. For instance, the trend in future life expectancy clearly differs. The simple linear extrapolation methods project an almost straight line, whereas the cohort model, the smoking+non-smoking model, and the method of Statistics Netherlands show a less linear future trend. In addition, the simple linear extrapolation methods generally produce lower outcomes than the methods which account for the non-linearity in the observations. Both can be linked to the non-linearity observed in the past trends. The simple linear extrapolation methods extrapolate the average increase of all-cause mortality over the whole period to the future, and thus result in a straight projection to the future. The cohort model, the smoking+non-smoking model, and the method of Statistics Netherlands include the past non-linear trend, and also extrapolate that trend into the future. In this particular case, including the effects causing non-linearity in a model results in a more optimistic increase over the observed period than extrapolating the average increase in all-cause mortality, and thus in a higher life expectancy in the future.
Because the assumptions about the source of the non-linearity vary between these models, the future non-linearity also differs.
freeze some essential developments in the data. That might also explain why the cohort model predicted different patterns for men and women than the other models.
The smoking+non-smoking model incorporates smoking history, which was not the same for men and women. Among men, smoking had already been decreasing for much of the observation period. Thus, the effect of reduced smoking among men is already reflected in the parameters of the model without the smoking variable. Among women, the turning point from an increase to a decrease in smoking has not yet been reached (Janssen, van Wissen, and Kunst 2013). Thus, the use of the smoking+non-smoking model influences future mortality improvements among women more than among men.
The trend in future life expectancy predicted by Statistics Netherlands is flattened because the cause of death with the worst future trend will dominate future total mortality. Mortality improvements are expected to be large in the near future, but are expected to be relatively small over the longer term.
Three of the six models forecast an increased sex differential in life expectancy at birth between 2009 and 2050: the Lee-Carter model, the cohort model, and the smoking+non-smoking model. Because of the separate projections of life expectancy for men and women, the past trend causes the increasing gap. The gap between male and female life expectancy in 2050 projected by the smoking+non-smoking model, in particular, is large. As men took up smoking before women, the sex difference increased. As women caught up, the gap decreased. The lag in the process for women means, in short, that the more advanced the stage of the smoking epidemic, the closer the smoking mortality rates of men and women become. Thus, in the (near) future, the gender gap may be expected to narrow because of the smaller differences in the smoking habits of men and women. However, as smoking among women and men moves towards parity, trends in non-smoking mortality become important. Because deaths other than from smoking have risen among men relative to women (Pampel 2002), the gap may increase in the future.
extrapolation model on the other. This may be related to the ongoing decrease in smoking among older Dutch men.
6.5 Forecasting considerations
Mortality forecasting involves a number of decisions. In addition to the forecasting approach, these include the measure to be forecasted, the specification of an underlying data model, and the specific forecasting method. Among the most important issues that must be taken into account when assessing a forecasting method are the amount of subjectivity, robustness, and whether the outcomes will be logical (e.g., Cairns et al. 2009, 2011). An example of a logical outcome is the plausibility of the projected age-sex profiles of the death rates.
The choice of the forecasting approach (extrapolation, explanation, or expectation) may depend on several criteria. For instance, because the extrapolative approach generally requires a lengthy series of data for long-term forecasting, data availability and the projection period are important criteria. Other examples of criteria are the aim and the accuracy of the forecast.
The decision of which measure is to be extrapolated is also important in forecasting mortality. All of the extrapolation methods used in this paper and by the statistical offices in Europe are variants of extrapolation of death rates. Life expectancy may also be used as the measure to be forecast. Oeppen and Vaupel (2002) reported stable trends in the record life expectancy at birth over 160 years, and White (2002) reported a near-perfect fit of average life expectancy of 21 high-income countries to a straight line from 1955 to 1996; an extrapolation of the life expectancy itself would therefore be an alternative to the methods used in this paper. This different approach will generally be more optimistic than an extrapolation based on death rates. Other examples are methods that take into account mortality inertia (see the European Demographic Datasheet above) or an acceleration of the decrease in mortality (see TOPALS above).
Models which capture age, period, and cohort effects in mortality will provide a better model fit than age-period models, given that a cohort effect exists in the mortality data. For some countries, cohort effects are clearly visible, although they are generally much smaller than period effects. However, there is no guarantee that models with a better fit will produce better forecasts. Cohort models in combination with age and period are fairly new and need to be fully tested, particularly in terms of their stability in response to changes in the age range or fitting period (Booth and Tickle 2008).
Epidemiological information can be included in the model in different ways (see, for instance, Pampel 2005; Bongaarts 2006; Janssen and Kunst 2007; Stewart, Cutler, and Rosen 2009; Wang and Preston 2009; King and Soneji 2011; Janssen, van Wissen, and Kunst 2013). Forecasters first have to identify the correlation between the determinant and mortality, and then formulate assumptions about the future. This requires them to have sufficient data on the determinants or indirect techniques to allow them to estimate mortality that can be attributed to a certain risk factor. Currently, no well-defined explanatory models are available, and the determinants are well understood (and measurable) for only a few causes of death. Comorbidities and dependencies among causes make such models even more complex. However, researchers like King and Soneji (2011) have emphasised the potential utility of including risk factors in forecasts, arguing that doing so will improve the quality, accuracy, and transparency of mortality forecasts. A classic example in which the determinant is known and can be measured is the dependence of lung cancer on smoking.
The challenge that arises when using methods that include additional information, such as a cohort effect or epidemiological information, lies in the prediction of the additional information itself. The advantage of using additional information in the forecasting method diminishes if the additional information cannot be forecast more accurately than mortality itself.
The inclusion of trends in other countries in the models is based on the observation that mortality evolution in most developed countries is similar because of similarities in socio-economic factors, life style, medical treatment, etc. Mortality levels will probably continue to develop in parallel. Again, several decisions have to be made, such as about how the information should be included: i.e., by a target approach or by coherent forecasting. Another crucial question is which countries determine the central tendency, or the basic mortality trend, that will be applied to the other countries. In addition, many different coherent forecasting methods exist, such as those of Li and Lee (2005); of Hyndman, Booth, and Yasmeen (2013); and of Li (2012). The methods for coherent forecasting are relatively new, and more research on this topic is needed.
linear, it is better to use the simple extrapolation methods, especially because the outcomes of different extrapolation methods using the same explicit assumptions do not differ greatly. If the past trends have been non-linear, including additional information is likely to result in a more robust forecast if the main effects of the non-linearity are successfully captured. Even though this involves more assumptions and more subjectivity, the right balance between added information and added subjectivity should be achieved.
7. Overall conclusion
In this paper, we have examined the various projection methods currently used in official mortality forecasts in Europe and mortality projections and forecasts in the Netherlands. The methods and the historical period used seem to reflect past mortality trends in the country. The Netherlands, along with other countries, use methods that take into account the non-linearity observed in the past trends. The different projections for a country lead to different results, which may have large implications for the insurance and pension industries.
For the Netherlands, the differences in the outcomes proved to be smaller if the same explicit assumptions were used, such as the same historical period and observed jump-off rates. The remaining sensitivity was shown to be small compared to other forms of uncertainty, and small compared to the increase in life expectancy over the long time horizon. The remaining differences in the outcomes mainly reflect differences between the methods which include the observed non-linearity, and the simple linear extrapolation methods which do not. For countries with more linear trends, smaller differences are likely to result.
References
Actuarieel Genootschap & Actuarieel Instituut (2010). AG Prognosetafel 2010-2060 [electronic resource]. Utrecht: Actuarieel Genootschap & Actuarieel Instituut. [http://www.ag-ai.nl/download/9166-HR-binnenwerk+Prognosetafel.pdf]. Alders, M., Keilman, N., and Cruijsen, H. (2007). Assumptions for long-term stochastic
population forecasts in 18 European countries. European Journal of Population 23(1): 33–69. doi:10.1007/s10680-006-9104-4.
Andreev, K. and Vaupel, J. (2005). Patterns of mortality improvement over age and time in developed countries: Estimation, presentation and implications for mortality forecasting. Paper presented at the Association of America 2005 Annual Meeting program, Philadelphia, Pennsylvania, March 31 – April 2 2005. Bell, W.R. (1997). Comparing and assessing time series methods for forecasting age-specific fertility and mortality rates. Journal of Official Statistics 13(3): 279-303. Blanpain, N. and Chardon, O. (2006). Projections de population 2007-2060 pour la France métropolitaine: méthode et principaux résultats [electronic resource]. France: Institut national de la statistique et des études économiques. [http://www.insee.fr/fr/publications-et-services/docs_doc_travail/docf1008.pdf]. Bongaarts, J. (2006). How long will we live? Population and Development Review
34(4): 605-628. doi:10.1111/j.1728-4457.2006.00144.x.
Booth, H., Hyndman, R.J., Tickle, L., and De Jong, P. (2006). Lee-Carter mortality forecasting: A multi-country comparison of variants and extensions. Demographic Research 15(9): 289–310. doi:10.4054/DemRes.2006.15.9.
Booth, H., Maindonald, J., and Smith, L. (2002). Applying Lee-Carter under conditions of variable mortality decline. Population Studies 56(3): 325–336. doi:10.1080/ 00324720215935.
Booth, H. and Tickle, L. (2008). Mortality modelling and forecasting: A review of methods. Annals of Actuarial Science 3(1-2): 3-43. doi:10.1017/S17484 99500000440.
Booth, H., Tickle, L., and Smith, L. (2005). Evaluation of the variants of the Lee-Carter method of forecasting mortality: A multi-country comparison. New Zealand Population Review 31(1): 13–34.
Bravo, J.M. (2007). Tábuas de mortalidade contemporâneas e prospectivas: Modelos estocásticos, aplicações actuariais e cobertura do risco de longevidade. [PhD thesis]. Portugal: University of Évora, Economics.
Brouhns, N., Denuit, M., and Vermunt, J. (2002). A Poisson log-bilinear regression approach to the construction of projected lifetables. Insurance: Mathematics and Economics 31(3): 373-393. doi:10.1016/S0167-6687(02)00185-3.
Brunborg, H. and Texmon, I. (2010). Befolkningsframskrivninger 2010-2060. Økonomiske analyser 4/2010: 28-39.
Bureau fédéral du Plan (2009). Quotients de mortalité prospectifs par sexe et unisexes [electronic resource]. Brussel: Bureau fédéral du Plan. [http://www.plan.be/admin/uploaded/201002040818570.wp200918.pdf]. Cairns, A.J.G. (2000). A discussion of parameter and model uncertainty in insurance.
Insurance: Mathematics and Economics 27(3): 313-330. doi:10.1016/S0167-6687(00)00055-X.
Cairns, A.J.G., Blake, D., and Dowd, K. (2006). A two-factor model for stochastic mortality with parameter uncertainty: Theory and calibration. Journal of Risk and Insurance 73(4): 687-718. doi:10.1111/j.1539-6975.2006.00195.x.
Cairns, A.J.G., Blake, D., Dowd, K., Coughlan, G.D., Epstein, D., and Khalaf-Allah, M. (2011). Mortality density forecasts: An analysis of six stochastic mortality models. Insurance: Mathematics and Economics 48(3): 355–367.
doi:10.1016/j.insmatheco.2010.12.005.
Cairns, A.J.G., Blake, D., Dowd, K., Coughlan, G.D., Epstein, D., Ong, A., and Balevich, I. (2009). A quantitative comparison of stochastic mortality models using data from England & Wales and the United States. North American Actuarial Journal 13(1): 1-35. doi:10.1080/10920277.2009.10597538.
Carolina, N. and van Duin, C. (2010). Onzekerheidsmarges voor de sterfteprognose van het CBS. Bevolkingstrends 58(2): 32-37.
Central Statistics Office (2008). Population and labour force projections 2011-2040 [electronic resource]. Ireland: Central Statistics Office. [http://www.cso.ie/en/media/csoie/releasespublications/documents/population/2 008/poplabfor_2011-2041.pdf].
Continuous Mortality Investigation (CMI) (2006). Stochastic projection methodologies: Further progress and P-Spline model features, example results and implications. (working paper 20).
Continuous Mortality Investigation (CMI) (2007). Stochastic projection methodologies: Lee-Carter model features, example results and implications. (working paper 25).
De Beer, J. (2012). Smoothing and projecting age-specific probabilities of deaths by TOPALS. Demographic Research 27(20): 543-592. doi:10.4054/DemRes. 2012.27.20.
De Jong, A. and Van Der Meulen, A. (2005). Prognose van sterfte naar doodsoorzaken: Model en veronderstellingen. Bevolkingstrends 53(2): 50-62.
De Jong, P. and Tickle, L. (2006). Extending Lee-Carter mortality forecasting. Mathematical Population Studies 13(1): 1-18. doi:10.1080/08898480 500452109.
Ediev, D.M. (2008). Extrapolative projections of mortality: Towards a more consistent method. Part I: The central scenario. Vienna Institute of Demography of Austrian Academy of Sciences (working paper; WP 03).
Ediev, D.M. (2011). Life expectancy in developed countries is higher than conventionally estimated. Implications from improved measurement of human longevity. Journal of Population Ageing 4(1-2): 5-32. doi:10.1007/s12062-011-9040-x.
Eurostat (2007). EUROPOP2007 Convergence Scenario: Summary Note. Paper presented at the Joint Eurostat-AWG Working Group on Population Projections, Luxembourg, 29-30 November 2007.
Eurostat (2012). Population statistics [electronic resource]. [http://epp.eurostat.ec. europa.eu/portal/page/portal/population/data/database].
Glówny Urzad Statystyczny (2009). Prognoza ludnooeci na lata 2008–2035 [electronic
resource]. Warsaw: Glówny Urzad Statystyczny.
[http://www.stat.gov.pl/cps/rde/xbcr/gus/P_Population_projection_for_Poland_ 2008_2035.pdf].
Hansen, M.F. and Stephensen, P. (2010). Danmarks fremtidige befolkning - Befolkningsfremskrivning 2010 [electronic resource]. Copenhagen: DREAM. [http://www.dreammodel.dk/pdf/Befolkning2010.pdf].
HMD. Human Mortality Database [electronic resource]. [http://www.mortality.org]. Hyndman, R.J., Booth, H., and Yasmeen, F. (2013). Coherent mortality forecasting:
The product-ratio method with functional time series models. Demography 50(1): 261-283. doi:10.1007/s13524-012-0145-5.
Hyndman, R.J. and Ullah, M.S. (2007). Robust forecasting of mortality and fertility rates: A functional data approach. Computational Statistics and Data Analysis 51(10): 4942-4956. doi:10.1016/j.csda.2006.07.028.
Instituto Nacional de Estadistica (2009). Proyección de la Población de España a Largo Plazo (2009-2049) [electronic resource]. Madrid: Instituto Nacional de Estadistica. [http://www.ine.es/metodologia/t20/t2030251.pdf].
Instituto Nacional de Estatística (2009). Projecções de população residente em Portugal [electronic resource]. Lisboa: Instituto Nacional de Estatística. [http://www.ine.pt/ngt_server/attachfileu.jsp?look_parentBoui=65945988&att_d isplay=n&att_download=y].
Janssen, F. and Kunst, A. (2007). The choice among past trends as a basis for the prediction of future trends in old-age mortality. Population Studies 61(3): 315-326. doi:10.1080/00324720701571632.
Janssen, F. and Kunst, A. (2010). De toekomstige levensverwachting. In: Luijben, A.H.P. and Kommer, G.J. (eds.). Tijd en toekomst; deelrapport van de VTV 2010 Van gezond naar beter. RIVM-rapport 270061008, Houten: Bohn Stafleu Van Loghum: 13-20.
Janssen, F., Kunst, A., and Mackenbach, J. (2007). Variations in the pace of old-age mortality decline in seven European countries, 1950–1999: The role of smoking and other factors earlier in life. European Journal of Population 23(2): 171-188.
doi:10.1007/s10680-007-9119-5.
Janssen, F., Van Wissen, L.J.G., and Kunst, A.E. (2013). Including the smoking epidemic in internationally coherent mortality projections. Demography 50(4): 1341-1362. doi:10.1007/s13524-012-0185-x.
Keilman, N. and Pham, D.Q. (2005). Hvor lenge kommer vi til å leve? Levealder og aldersmønster for dødeligheten i Norge, 1900–2060. Økonomiske analyser 6/2005: 43-49.
King, G. and Soneji, S. (2011). The future of death in America. Demographic Research 25(1): 1-38. doi:10.4054/DemRes.2011.25.1.
Lee, R.D. and Carter, L.R. (1992). Modelling and forecasting US mortality. Journal of the American Statistical Association 87(419): 659-671.
Lee, R.D. and Miller, T. (2001). Evaluating the performance of the Lee-Carter method for forecasting mortality. Demography 38(4): 537-549. doi:10.1353/ dem.2001.0036.
Li, J. (2012). A Poisson common factor model for projecting mortality and life expectancy jointly for females and males. Population Studies 67(1): 111-126.
doi:10.1080/00324728.2012.689316.
Li, N.R. and Lee, R. (2005). Coherent mortality forecasts for a group of populations: An extension of the Lee-Carter method. Demography 42(3): 575-594.
doi:10.1353/dem.2005.0021.
OECD (2007). Pension reform: The unfinished agenda. Policy brief, September 2007.
doi:10.1787/growth-2007-en.
Oeppen, J. and Vaupel, J.W. (2002). Broken limits to life expectancy. Science 296(5570): 1029-1031. doi:10.1126/science.1069675.
Office for National Statistics (2009). 2008-based National Population Projections [electronic resource]. Newport: Office for National Statistics. [ http://www.ons.gov.uk/ons/rel/npp/national-population-projections/2008-based-projections/national-population-projections.pdf]
Olshansky, S.J., Passaro, D., Hershow, R., Layden, J., Carnes, B., Brody, J., Hayflick, L., Butler,R., Allison, D., and Ludwig, D. (2005). A potential decline in life expectancy in the United States in the 21st century. The New England Journal of Medicine 352(11): 1138–1145. doi:10.1056/NEJMsr043743.
Pampel, F.C. (2002). Cigarette use and the narrowing sex differential in mortality. Population and Development Review 28(1): 77-104. doi:10.1111/j.1728-4457.2002.00077.x.
Pampel, F.C. (2005). Forecasting sex differences in mortality in high income nations: The contribution of smoking. Demographic Research 13(18): 455-484.
Pollard, J.H. (1987). Projection of age-specific mortality rates. Population Bulletin of the United Nations 21-22: 55-69.
Renshaw, A.E. and Haberman, S. (2006). A cohort-based extension to the Lee–Carter model for mortality reduction factors. Insurance: Mathematics and Economics 38(3): 556-570. doi:10.1016/j.insmatheco.2005.12.001.
Salvini, S., Santini, A., and Vignoli, D. (2006). Le Previsiono della Popolazione. Teoria ed applicazioni [electronic resource]. Firenze: Università degli Studi di Firenze. [http://www.ds.unifi.it/ricerca/pubblicazioni/altre/didattica/didattica2006_1.pdf]. Shang, H.L., Booth, H., and Hyndman, R.J. (2011). Point and interval forecasts of mortality rates and life expectancy: A comparison of ten principal component methods. Demographic Research 25(5): 173-214. doi:10.4054/DemRes. 2011.25.5.
STATEC (2005). Potentiel de croissance économique et Démographie Projections 2005 –2055 [electronic resource]. Luxembourg: Conférence de presse du 7 octobre 2005. [http://www.statistiques.public.lu/fr/actualites/population/population/ 2005/10/20051007/PDF-Present-ProjectDemograph-2005.pdf].
Statistics Netherlands (2012). Statline database [electronic resource]. Den Haag/Heerlen, Centraal Bureau voor de Statistiek. [http://statline.cbs.nl/StatWeb/default.aspx].
Statistiska centralbyrån (2005). SCB:s modell för befolkningsprognoser. En dokumentation [electronic resource]. Stockholm: Statistics Sweden. [http://www.scb.se/statistik/_publikationer/BE0401_2005A01_BR_BE52OP050 1.pdf].
Stewart, S.T., Cutler, D.M., and Rosen, A.B. (2009). Forecasting the effects of obesity and smoking on U.S. life expectancy. The New England Journal of Medicine 361(23): 2252-2260. doi:10.1056/NEJMsa0900459.
Tabeau, E. (2001). A review of demographic forecasting models for mortality. In: Tabeau, E., Van Den Berg Jeths, A., and Heathcote, C. (eds.). Forecasting mortality in developed countries: Insights from a statistical, demographic and epidemiological perspective. Dordrecht: Kluwer Academic Publishers: 1-32.
VID/IIASA/PRB (2012). [electronic resource] [http://www.oeaw.ac.at/vid/datasheet/ download_2012.shtml].
Wang, C.-W. and Liu, Y.-L. (2010). Comparisons of mortality and forecasting – empirical evidence from Taiwan. International Research Journal of Finance and Economics 37: 46-55.
Wang H. and Preston, S.H. (2009). Forecasting United States mortality using cohort smoking histories. PNAS 106(2): 393-398. doi:10.1073/pnas.0811809106.
White, K.M. (2002). Longevity advances in high-income countries, 1955-96. Population and Development Review 28(1): 59-76. doi:10.1111/j.1728-4457.2002.00059.x.
WHO. Global Health Observatory Data Repository [electronic resource]
.
[http://apps.who.int/ghodata//].
Corrections:
On September 17, 2013 the following mistakes were corrected on page 328:
resi t x res
i t res
i x i t x t
x m b k
Mˆ , ln ,, , , ,,
ln should be
xrestires i t res
i x t x i x i t
x a BK b k
m,, , , , ,,
ln ,