EnginEEring and ginning
Screening for Optimal Operating Parameters for the Powered roll gin Stand
Using Taguchi’s robust design
Greg Holt* and Weldon Laird
G. Holt and Weldon Laird (Retired), USDA-ARS Cotton Production and Processing Research Unit, 1604 E. FM 1294, Lubbock, TX 79403.
*Corresponding author: [email protected] aBSTraCT
The Powered roll gin Stand (PrgS) is a new saw-type ginning technology that has shown in-creased production and turnout without adversely effecting fiber properties. In some cases, improve -ments in fiber properties over a conventional gin stand were demonstrated. The new gin stand has three primary components: paddle roll, saw, and seed finger roll. The operational settings of these components have been shown to affect both production rates and fiber characteristics of the seed cotton being ginned. This research focused on screening for the optimal speeds and loading rates for the paddle roll, saw, and seed finger roll components of the PRGS, based on combinations of turnout, processing rate, and fiber quality data. an experiment using stripper-harvested seed
cotton, with and without field cleaners, from two different fields (different growers) was evaluated using Taguchi’s Method. Nine different opera-tional setting configurations were selected for the gin stand’s components. Evaluation was based on 11 response variables involving processing rate,
turnout, and fiber quality measurements. In ad-dition to screening for the optimum operational settings based on individual response variables, six different combinations of response variables were evaluated. Results varied depending on the response variable of interest. Overall, results in -dicated the most “robust” configuration included the 900 rpm saw speed. Other parameters of pad -dle roll speed, seed finger roll speed, and pad-dle roll loading rate varied based on the response variables. The results emphasized the potential application of this gin stand to a real-time dy-namic control system that regulates operational parameters based on processing rate, turnout, and fiber quality goals and objectives.
T
he Powered Roll Gin Stand (PRGS) is a patented design (Laird, 2000) that was initially developedto remove the residual fibers from cottonseed for
the EASIflo process (Laird et al., 1997). It has been
evaluated for use in ginning seed cotton (Laird et al., 2000; Laird et al., 2001). Results from the initial studies evaluating the effectiveness of the powered
roll gin stand at ginning seed cotton demonstrated improved turnout and increased production rate per unit width. In addition to production and processing
improvements, some fiber characteristics, such as staple length and length uniformity, were more favorable with the PRGS than with a conventional
saw gin stand.
In addition to the previous research studies
dem-onstrating the PRGS as a viable means of ginning seed cotton without adversely affecting fiber prop
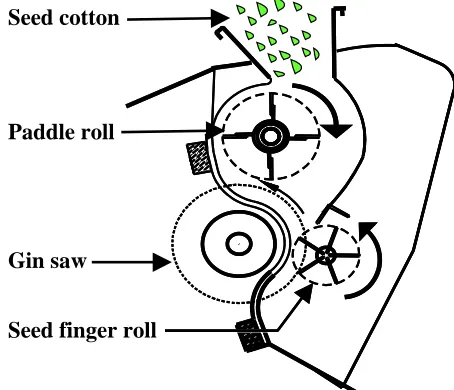
-erties, results also revealed a number of operational settings that could further improve performance and fiber quality. The operational settings were for the saw, paddle roll, and seed finger roll, the three primary components of the PRGS. Figure 1 shows a cutaway schematic view of the three primary components. An initial evaluation of the optimal op
-erational settings for these three components during
ginning indicated speeds or loading rates that could potentially produce the best turnout, production rate,
and/or fiber quality data for the ranges evaluated
(Holt et al., 2001). The initial optimal setting study
was performed with a single cultivar of cotton grown
in one location and harvested with a cotton stripper
without the use of a field cleaner. Even though the initial study was informative, it could be considered a “one-factor-at-a-time” approach. Because a variety of factors have the potential to influence the ideal opera
-tional settings of this new technology, it was decided
to conduct an initial screening to determine which
response variables might be beneficial in determin -ing the optimum operational sett-ings, so they would
be insensitive (i.e. robust) to uncontrollable “noise” factors while maintaining high performance.
For this initial multivariate evaluation to
deter-mine the most robust operational settings for the
experi-mental design. Taguchi methodology has been widely practiced and documented (Taguchi and Wu, 1980;
Box and Bisgaard, 1988; Phadke and Taguchi, 1988;
Taguchi and Clausing, 1990; Kacker et al., 1991; McConnell and McPherson, 1997; Wilkins, 2000). In
Taguchi’s Method, the index of quality is measured according to the deviation of a characteristic from its target value (Mitra, 1998). These deviations from
the target value are attributed to poor designs (i.e.
combinations of controllable settings and materials) and disruptions from uncontrollable factors known as noise factors. The result is a loss of time and money to both manufacturer and customer. Taguchi believed that the loss of quality resulted in an ultimate cost to
society. The Taguchi Method seeks to minimize the
effect of noise while determining the optimal levels of the controllable factors based on the concept of
robustness or Robust Design. Robust Design results
in a product or process that is insensitive to the ef
-fects of sources of variability even when the sources
themselves have not been eliminated. Robust Design
requires the evaluation of controllable products or process control factors in the noisy environment from which the classical Design of Experiment (DOE)
method seeks isolation (Fowlkes and Creveling, 1995). The objective is to create a product or process design
that is insensitive to noise factors while being cost and performance efficient as a result of setting the key controllable factors at defined levels.
The main aspects of Taguchi’s Method are essen
-tially 1) the loss function, 2) the design array, and 3) the signal to noise ratio (Hsiang et al., 1997). Based
on a Taylor Series approximation, the loss function increases as the quality characteristic deviates on either side of the target value. An important aspect of the loss function is that it maps deviations from the target into a financial measure (Schmidt and
Launsby, 2000). The design array used by Taguchi
is an orthogonal array that has its basis in fractional-factorials, Plackett-Burman, latin square, and mixed
designs. The signal-to-noise ratio is the primary
metric used for product or process optimization and represents the ratio of sensitivity to variability
(Taguchi et al., 2005). The ratio can be used to
de-termine quality or compare performance and is used to optimize the robustness of a product or process
(Fowlkes and Creveling, 1995).
Given variables, such as cultivar of cotton grown,
harvest method, environmental conditions
experi-enced by the crop during the season, fertilizer and
chemical applications, etc., seed cotton received by a
gin can vary tremendously in its quality and the ease with which it is processed. Because the PRGS is a new
design recently introduced into industry, it was pru-dent to incorporate robustness into the initial screening
of the optimal operational settings. An experiment was
designed to determine the optimal operational settings
using two commonly encountered noise factors when
ginning stripper harvested seed cotton.
The objective of this study was to use Taguchi’s
Method as a screening tool to determine the most
robust (insensitive to uncontrollable factors) settings for the paddle roll, saw, and seed finger roll compo
-nents of the PRGS, while ginning stripper-harvested
seed cotton based on production rate, turnout, and
fiber quality measurements.
MaTEriaLS and METHOdS
Equipment. The first prototype PRGS was constructed by modifying a conventional 90- saw gin stand equipped with 30.5-cm (12-in) saws. The paddle roll consisted of four rubber strip paddles
mounted on a 6.4-cm (2.5-in) schedule 80 pipe core resulting in a 21.6-cm (8.5-in) tip diameter. The
paddle roll was installed in the center of the roll box. The gin stand was modified by making new rib rails
and replacing the original ribs with narrower ribs to get a closer 1.59 cm (5/8 in) saw spacing. The saw
spacers were trimmed to fit the narrow rib spacing,
and 110 saws were installed on the original saw
man-drel. The original gin stand roll box had a flattened oval shape. The modified roll box was pivoted up and Figure 1. Schematic cutaway view of the powered roll gin
stand showing the location of the paddle roll and seed finger roll relative to the gin saw.
Seed finger roll Gin saw
back about 2.5 cm (1 in) at the top to give a shape
that more closely matched the shape of the paddle roll. A new front was constructed for the gin roll box to replace the conventional huller front. The new front roll box shape was designed to allow a greater area of the saw to come in contact with the cotton. A driven rotating seed finger mechanism, known as
the seed finger roll, was developed to improve the presentation of the cotton to the gin saws to allow increased contact and capture of the lint by the saws. The seed finger roll also aided in regulating the seed discharge from the gin stand.
The gin saw was powered by a 56 kW (75 hp)
motor controlled by a variable frequency inverter.
The 21.6-cm (8.5-in) diameter paddle roll was powered by a 11.2 kW (15 hp) motor, through an 8
to 1 gear reducer, attached to a variable frequency inverter. The 13.9-cm (5.5-in) diameter seed finger
roll was attached to a variable speed drive powered by a 62.2 W (1/12 hp) motor through a 20 to 1 speed reducer.
Taguchi’s method. The Taguchi Method is applied at the parameter design stage to establish optimal process settings or design parameters.
Objectives of Taguchi’s parameter design are 1)
to make products and processes insensitive to en-vironmental variations, 2) to make products and
processes insensitive to manufacturing variations or imperfections, 3) to make products insensitive
to product deterioration, and 4) to make products insensitive to unit-to-unit variations (Rowlands et al., 2000). To accomplish this, the signal-to-noise (S/n)
ratio is the metric used to study the output quality characteristic in the presence of noise. Mathematical expressions of the S/N ratio are dependent on three
situations: target is best, smaller is better, and larger
is better (Mitra, 1998). The S/N ratio (ŋ) equations used for this study were the “smaller-is-better” and “larger-is-better” formulas as follows:
smaller-is-better
−
=
∑
=
9
1 2 10 91
log 10
i i
y
η (1)
larger-is-better
−
=
∑
= 9
1 2
10 91 1
log 10
i yi
η (2)
where yi was one of the nine observations.
The use of either smaller-is-better or
larger-is-better was dependent on the response variable in
question. The goal was to determine the operational settings that would maximize the relevant perfor -mance statistic.
To perform Taguchi’s Method in the determina
-tion of optimal operating parameters for the PRGS, both controllable and noise factors had to be deter
-mined. Based on previous work (Holt et al., 2001), four controllable factors were chosen and varied over three levels. The controllable factors and their alternatives were as follows: 1) saw speed (550, 725,
and 900 rpm), 2) paddle roll speed (120, 160, and
200 rpm), 3) seed finger roll speed (7.5, 10.5, and
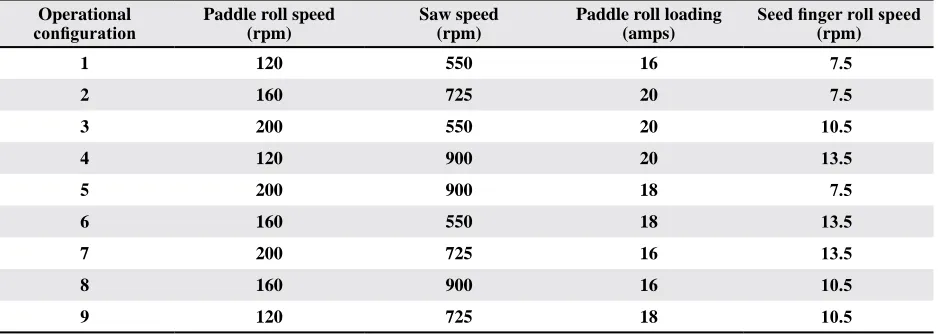
13.5 rpm), and 4) paddle roll loading rate (16, 18, and 20 amps). A Taguchi’s L9 array was used to gener-ate nine different operational setting configurations for the controllable factors. The L9 array represents a design in which four factors are varied at three levels and is a fractional replicate of a full factorial
design that needs 81 (34) experiments. Each of the nine operational configurations generated for the L9 array were randomized (Table 1). Two noise factors, each varied over two levels, were selected for this
Table 1. Operational configuration for the selected levels of four controllable variables tested in this study (based on a Ta
-guchi Method L9 array)
Operational
configuration Paddle roll speed (rpm)
Saw speed (rpm)
Paddle roll loading
(amps) Seed finger roll speed (rpm)
1 120 550 16 7.5
2 160 725 20 7.5
3 200 550 20 10.5
4 120 900 20 13.5
5 200 900 18 7.5
6 160 550 18 13.5
7 200 725 16 13.5
8 160 900 16 10.5
study (Table 2). The noise factors and their levels were 1) where the crop was grown (field 1 or field 2) and 2) the method of stripper harvesting (with or without use of a field cleaner). The first factor “noise” was due to the fact that the fields were 4.8 km (3 mi) apart and operated by different producers using dif
-ferent production practices (i.e one producer took a “maximum” irrigation approach, while the other took a “minimum” irrigation approach to growing the crop). Since the primary variable influenced by the use of a field cleaner is trash level of the incoming seed cotton, the field cleaner “noise” was the condi
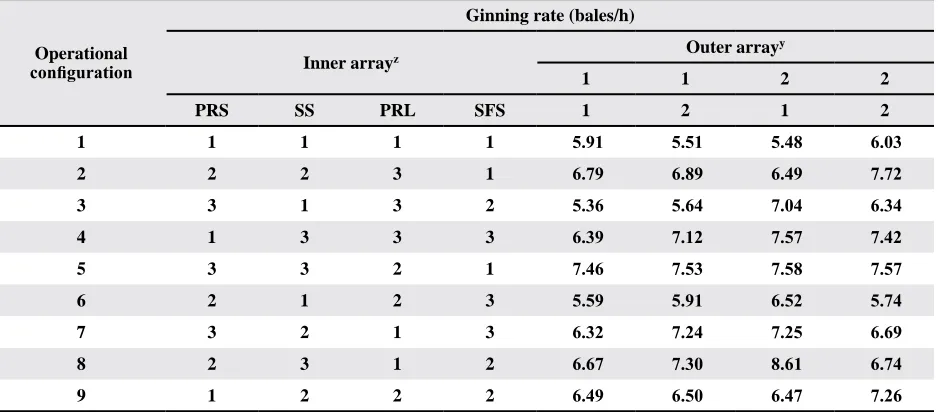
-tion of the seed cotton. Table 3 shows an example of the design matrix used for this study using the
ginning rate data.
Even though other uncontrollable factors exist that can influence ginning, these factors were deemed to be prevalent for stripper-harvested cotton and for
the most part uncontrollable. The uncontrollable
na-ture of the location factor, variability resulting from two producers using different production practices, is self-explanatory. Some might argue, however, that the use of a field cleaner is controllable, and
such arguments may be plausible under controlled
laboratory conditions. Even though the use of a field cleaner is controllable, it is not cost effective for a gin to dictate to producers (their customers) whether or not they should use their field cleaners, if they have them, when harvesting their crop. Such a mandate could result in the loss of customers. The use of field cleaners is not solely based on whether or not producers have new or old equipment but on the preference of the producer. Thus, use of field
cleaners is a physically controllable variable that is
currently economically unfeasible to control.
Setup, testing, and data collection. The cotton cultivar used in this study was PayMaster 2326RR (Delta and Pine Land Co.; Scott, MS). The cotton
Table 2. Uncontrollable noise variables and their respective levels used in this study
Condition Harvest equipment Field locationz
1 No field cleaner Field 1
2 No field cleaner Field 2
3 Field cleaner Field 1
4 Field cleaner Field 2
z The fields were operated by different producers approximately 4.8 km apart using different production practices.
Table 3. Ginning rate data shown in the design matrix (inner and outer arrays) used for each response variable evaluated in this study
Operational configuration
ginning rate (bales/h)
inner arrayz Outer array
y
1 1 2 2
PrS SS PrL SFS 1 2 1 2
1 1 1 1 1 5.91 5.51 5.48 6.03
2 2 2 3 1 6.79 6.89 6.49 7.72
3 3 1 3 2 5.36 5.64 7.04 6.34
4 1 3 3 3 6.39 7.12 7.57 7.42
5 3 3 2 1 7.46 7.53 7.58 7.57
6 2 1 2 3 5.59 5.91 6.52 5.74
7 3 2 1 3 6.32 7.24 7.25 6.69
8 2 3 1 2 6.67 7.30 8.61 6.74
9 1 2 2 2 6.49 6.50 6.47 7.26
z PRS = paddle roll speed, SS = saw speed, PRL = paddle roll load, SFS = seed finger roll speed. 1 = minimum operational
level, 2 = mid-range operational level, 3 = maximum operational level.
y Outer array variables: 1 = no field cleaner for the top row and field 1 for the second row, 2 = field cleaner for the top row
was stored in a dry area and did not require drying
prior to ginning. The average moisture content (dry
basis) of the seed cotton at the feeder apron was 7.9% with a standard deviation of 1.3%. Moisture content was determined using the methods of
Shepard (1972).
The machinery sequence for all pre-cleaning of the seed cotton and post cleaning of the lint was
identical throughout the experiment. Seed cotton test
lots, consisting of approximately 363 kg (800 lb) of non-field cleaned seed cotton and 249 kg (550 lb) of field cleaned seed cotton, were fed from the feed con -trol bin at a constant rate through an inclined cleaner and stick machine, a second inclined cleaner and stick machine, and then to the distributing conveyor over
the feeder above the PRGS. Upon exiting the gin
stand, the lint proceeded through two saw-type lint
cleaners. Three lint samples were obtained for each of the nine operational setting configurations after the gin stand and from the lint slide feeding the press.
Before each run, the variable frequency inver
-tors operating the saw, paddle roll, and seed finger
roll were set to the desired operational speeds (Table 1). The paddle roll loading rate was used as
the set point for the control system. During the run, the control system regulated the feed rate from the gin stand feeder based on the paddle roll loading
rate set point. In addition to controlling the seed
cotton feed rate, the control system doubled as the data acquisition system and recorded information
every 4 s. The data recorded included 1) saw and paddle roll motor power (kW), 2) saw and paddle
roll motor current (A), 3) time of day, 4) saw and paddle roll motor frequency (Hz), 5) alarms (if any), and 6) set points for all speeds and loading rates. The seed finger roll was the only component that was not included in the control and data acquisition system. To control the seed finger roll, a variable
speed control was manually set and the speed re-corded with a hand-held tachometer.
Each lint sample was weighed and analyzed with
the Advanced Fiber Information System (AFIS) and High Volume Instrument (HVI) fiber measurement
systems at the Texas Tech University International Textile Center.
The following response variables were used for
this study: 1) ginning rate (bales/h), 2) turnout (%),
3) AFIS length by weight (mm), 4) AFIS short fiber content (SFC) by weight (%), 5) AFIS upper quar -tile length (UQL)-wt (mm), 6) AFIS neps (count/g),
7) AFIS visible foreign matter (VFM) (%), 8) HVI
length (mm), 9) HVI uniformity (%), 10) HVI Rd
(grayness), and 11) HVI +b (yellowness). Even
though lint samples were collected before and af -ter lint cleaning, the results presented are only on
those lint samples collected after the gin stand (i.e. before lint cleaning). Since this is the initial study using design of experiments to screen for optimal operational settings of the powered roll gin stand,
it was decided to concentrate on the lint samples
influenced by the gin stand alone and not those influenced by both the gin stand and the lint clean
-ers. Results from the after lint cleaning samples are planned for a future manuscript.
Even though other measurements, such as strength and micronaire, are important in
determin-ing the value of cotton, they were not deemed to be of primary significance as far as the gin stand itself is concerned. Strength and micronaire are minimally affected by the gin stand and are primarily
determined by the cultivar planted and the growing
conditions of the crop. Even though strength can be adversely affected by the overall ginning process,
this is primarily due to excessive drying and/or
improper moisture content of the seed cotton prior to ginning (Anthony and Griffin, 2001) and not the
gin stand. The gin stands contribution to reducing
strength can be reflected as an increase in SFC, which
was used in the optimization analysis.
The value of lint in the bale, commonly re
-ferred to in terms of Commodity Credit Corpora -tion (CCC) loan rate, is important to the producer.
Since the loan rate value is based on multiple fiber
properties (strength, micronaire, length, color, etc.)
coupled with this study’s focus on fiber properties
based on lint samples obtained prior to lint clean-ing (higher trash levels), it was decided not to use
it as a response variable for this initial study. The
loan rate value was used, however, to determine
Taguchi’s quality loss for a larger-is-better output response. The average quality loss function for a larger-is-better output response is as follows (Fowl -kes and Creveling, 1995):
=
∑
=
n
i yi
n k y L
1 2
1 1 )
( 2
o oy
A
k= (3)
where:
Ao = customer loss ($)
yo = customer tolerance ($)
Data analysis. The results were analyzed
sepa-rately for every response variable. The response variables using the smaller-is-better performance
statistic were SFC, neps, VFM, and +b. The
remaining performance characteristics used the
larger-is-better statistic. In addition to obtaining the individual S/n ratios, it was desirable to obtain
optimal settings for combinations of the response
variables that would include various combinations
of all the response variables evaluated. For example,
a cotton gin operator would want to maximize ginning rate and turnout while getting the best
fiber properties possible. The response variable
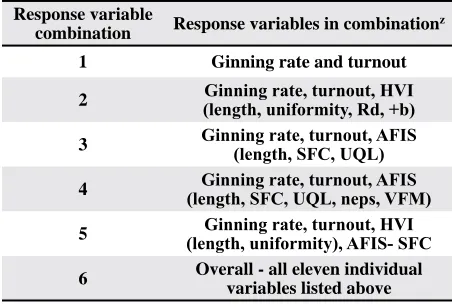
combinations (RVC) evaluated are shown in Table 4. The RVC mean and S/n ratios values obtained
by normalizing the mean and S/N ratio for each
response variable in the combination, multiplying
them by a weighting factor, and summing the prod
-ucts of the response variables of interest (Equation
4). For each RVC evaluated, the response variables
were equally weighted depending on the number of
response variables in that particular combination.
For example, the weighted S/N ratio for the first operational configuration (OC) (Table 1) in the
second RVC (Table 4) was determined by inserting
the corresponding S/N ratio values for ginning rate (GR), turnout (TO), HVI length (Lgt), uniformity (Unif), Rd, and +b into Equation 4.
Weighted S/N for OC 1 in the 2nd RVC =
WF*(GR S/n 1÷GR S/n mean) + WF*(To S/n 1÷ To S/n mean) + WF*(Lgt S/n 1÷ Lgt S/n mean) +
WF*(Unif S/N 1÷ Unif S/N mean) +
WF*(Rd S/n 1÷ Rd S/n mean) +
WF*(+b S/n 1÷ +b S/n mean). (4) where:
WF = weighting factor, determined by taking the inverse of the number of variables in the combination. S/N 1 = S/N ratio for the 1st OC of the
corresponding variable
S/N mean = mean S/N value for the associated
response variable
once the normalized mean and S/n were calcu-lated, the oC producing the highest S/n ratio was
selected as the best OC for that RVC.
rESULTS and diSCUSSiOn
Individual response variables. The optimal
mean and S/N ratio for each response variable along
with the observation that produced the corresponding peak value is shown in Table 5. The optimal value
re-fers to the best or peak value for the given criteria used.
For example, ginning rate was maximized (larger-is-better) whereas SFC was minimized
(smaller-is-bet-ter). Of the eleven response variables evaluated, only turnout had different optimal operational settings for
the mean and S/n ratio. All other response variables
had the same operational configuration for both the
optimal mean and S/n ratio. The difference in configu
-ration between the mean and S/N ratio of the turnout
indicated that even though oC 8 (Table 1) provided higher turnout (highest mean value), oC 5 resulted in
a better combination of overall performance consis -tency (highest S/n ratio). For turnout, the operational
settings for OC 8 had a slower paddle roll speed, higher seed finger roll speed, and a lower loading rate of the paddle roll than did the more robust OC 5. The
saw speed, however, was the same (900 rpm). In Table 5, the operational settings in the peak mean and peak S/n ratio columns that are the same color produced the same optimum operational
set-tings for the individual response variables. Ginning rate and HVI uniformity had their peak mean at the same operational settings. Peak mean for ginning rate and turnout occurred at different operational
settings with turnout having a slower paddle roll speed and lower paddle roll loading than ginning rate.
Table 4. Response variable combinations evaluated in this study
response variable
combination response variables in combinationz
1 ginning rate and turnout
2 (length, uniformity, Rd, +b)Ginning rate, turnout, HVI
3 Ginning rate, turnout, AFIS (length, SFC, UQL)
4 (length, SFC, UQL, neps, VFM)Ginning rate, turnout, AFIS
5 (length, uniformity), AFIS- SFCGinning rate, turnout, HVI
6 Overall - all eleven individual
variables listed above
z HVI = high volume instrumentation, AFIS = advanced
Ginning rate, turnout, and HVI uniformity had their
peak S/n ratio at the same settings. The importance
of knowing which variables may be maximized at the same operating conditions can help direct fu
-ture research by potentially reducing the number of
response variables, especially those that may take excess time and/or money to record.
Table 5 indicates that a variety of desirable OC’s can exist depending on the response variable of in
-terest. Rarely, however, would one of the response variables be singled out without consideration of other variables; therefore, it is of interest to know what role
each component played in arriving at the peak S/n ratio operational settings shown in Table 5. Table 6
shows the relative effect (%) for each control factor on the variability of each response variable. This relative effect was calculated with the formula as follows:
Relative effect (%) *100
=
totalSS SSfactor
(5) where:
SSfactor = sum of squares for the independent
variable (factor) total SS = total sum of squares
Saw speed had a large effect on seven of the eleven
response variables evaluated: ginning rate, turnout, AFIS length, AFIS SFC, AFIS VFM, HVI Rd, and HVI +b (Table 6). The remaining response variables had either the paddle roll speed or paddle roll loading rate
as the component with the largest effect in obtaining the
peak S/n ratio. The paddle roll speed was the largest
contributor to AFIS neps and HVI uniformity. Paddle
roll loading rate had the largest contribution to AFIS
UQL and HVI length. Even though seed finger speed was not the primary contributor to any of the response variables, it was the second largest influence on turnout and HVI uniformity. Table 6 does not indicate the direc
-tion of influence for the control factors on the response variables, only the amount of influence, in percentage, each factor had on the response variable in question. For example, turnout was primarily influenced by saw speed (56.1%), secondly by seed finger speed (36%),
thirdly by paddle roll speed (6.9%), and minimally by paddle roll load (1%).
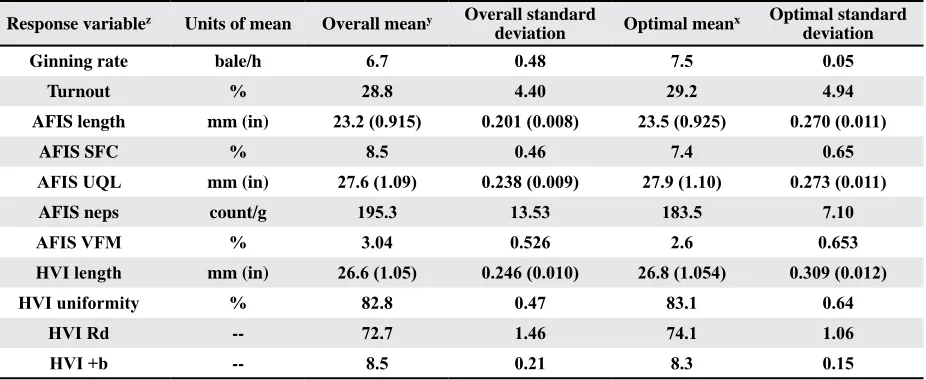
Table 7 shows how overall (all runs) mean and
standard deviation for each response variable compares with the mean and standard deviation of the OC from
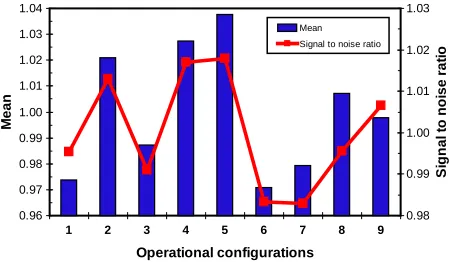
Table 1, which resulted in the highest S/n ratio. Response variable combinations. The normal-ized results corresponding to the RVC shown in Table
4 are shown in Figures 2 through 7. The figures indi
-cate OC 5 is the most robust (highest S/N ratio) for all combinations except for OC 4 (Fig. 7). In addition to having the highest S/N ratio in five of the six combina
-tions evaluated, OC 5 had the best overall mean for all
the RVC evaluated. Whether or not the true optimal condition(s), or in this case the predicted optimum(s),
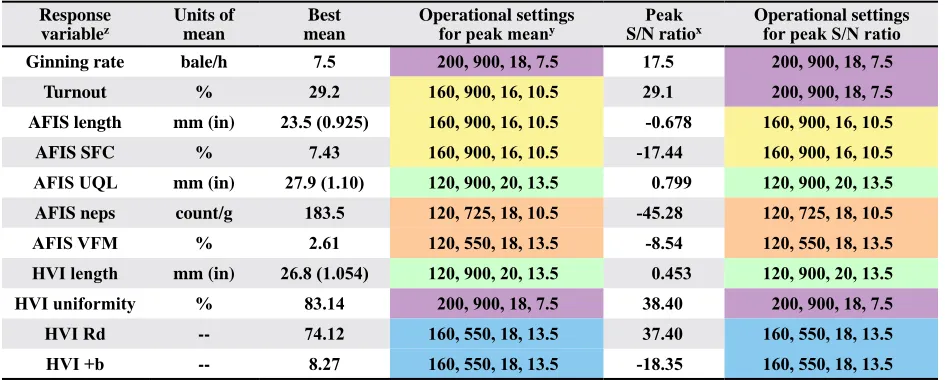
was one of the OC evaluated or one of the other 72 Table 5. The best mean and peak signal-to-noise ratios for all the individual response variables evaluated in this study and
the corresponding operational settings producing those values
response variablez
Units of mean
Best mean
Operational settings
for peak meany S/n ratioPeak x
Operational settings for peak S/N ratio
ginning rate bale/h 7.5 200, 900, 18, 7.5 17.5 200, 900, 18, 7.5
Turnout % 29.2 160, 900, 16, 10.5 29.1 200, 900, 18, 7.5
aFiS length mm (in) 23.5 (0.925) 160, 900, 16, 10.5 -0.678 160, 900, 16, 10.5
aFiS SFC % 7.43 160, 900, 16, 10.5 -17.44 160, 900, 16, 10.5
AFIS UQL mm (in) 27.9 (1.10) 120, 900, 20, 13.5 0.799 120, 900, 20, 13.5
aFiS neps count/g 183.5 120, 725, 18, 10.5 -45.28 120, 725, 18, 10.5
AFIS VFM % 2.61 120, 550, 18, 13.5 -8.54 120, 550, 18, 13.5
HVI length mm (in) 26.8 (1.054) 120, 900, 20, 13.5 0.453 120, 900, 20, 13.5
HVI uniformity % 83.14 200, 900, 18, 7.5 38.40 200, 900, 18, 7.5
HVI Rd -- 74.12 160, 550, 18, 13.5 37.40 160, 550, 18, 13.5
HVI +b -- 8.27 160, 550, 18, 13.5 -18.35 160, 550, 18, 13.5
z AFIS length, short fiber content (SFC), and upper quartile length (UQL) are by weight. VFM = visible foreign matter.
yThe operational settings listed for both the mean and S/N ratios are for paddle roll speed, saw speed, paddle roll load
-ing rate, and seed f-inger roll speed, respectively. Cells highlighted with the same color within a column have the same operational settings.
configurations that comprise the full-factorial not
evaluated needed to be determined. To determine the predicted optimum, the maximum normalized S/n ratio
was selected for each component at the level where
the maximum occurred. The results in Table 8 show
the predicted optimums for each RVC compared with
the optimal oC (Fig. 2 through 7) obtained with the
fractional factorial design (L9) used in this study. Table 8 shows that only the optimum for RVC 1 was equal to the predicted optimum. The predicted optimum for
RVC 4 had a lower PRS and higher PRL than the oC
shown in Figure 5. The other four RVC (RVC 2, 3, 5,
and 6) had one independent variable in their oC, which
was different from their predicted optimum.
Operational configurations M e a n S ig n a l to n o is e ra ti o Mean Signal to noise ratio
0.950 0.975 1.000 1.025
1 2 3 4 5 6 7 8 9
0.950 0.975 1.000 1.025 1.050
Figure 3. Weighted means and weighted signal-to-noise ratios for ginning rate, turnout, HVI length, HVI uniformity, HVI Rd, and HVI +b (response variable combination number 2). 0.900 0.925 0.950 0.975 1.000 1.025 1.050 1.075
1 2 3 4 5 6 7 8 9
Operational configurations M ea n 0.950 0.975 1.000 1.025 1.050 Si gn al to no is e ra tio Mean Signal to noise ratio
Figure 2. Weighted means and weighted signal-to-noise ratios for ginning rate and turnout (response variable combina-tion number 1).
Operational configurations M ea n Si gn al to no is e ra tio Mean Signal to noise ratio
0.940 0.965 0.990 1.015 1.040
1 2 3 4 5 6 7 8 9 0.98
0.99 1.00 1.01 1.02
Figure 4. Weighted means and weighted signal-to-noise ratios for ginning rate, turnout, AFIS length, AFIS short fiber content, and AFIS upper quartile length (response variable combination number 3).
Operational configurations M ea n Si gn al to no is e ra tio Mean Signal to noise ratio
0.96 0.97 0.98 0.99 1.00 1.01 1.02 1.03 1.04
1 2 3 4 5 6 7 8 9 0.98
0.99 1.00 1.01 1.02 1.03
Figure 5. Weighted means and weighted signal-to-noise ratios for ginning rate, turnout, AFIS length, AFIS short fiber content, AFIS upper quartile length, AFIS neps, and aFiS visible foreign matter (response variable combina-tion number 4).
Operational configurations M ea n Si gn al to no is e ra tio Mean Signal to noise ratio
1 2 3 4 5 6 7 8 9
0.96 0.97 0.98 0.99 1.00 1.01 1.02 1.03 0.96 0.97 0.98 0.99 1.00 1.01 1.02 1.03 1.04 1.05
Figure 6. Weighted means and weighted signal-to-noise ratios for ginning rate, turnout, HVI length, HVI uniformity, and AFIS short fiber content (response variable combination number 5). Operational configurations M ea n Si gn al to no is e ra tio Mean Signal to noise ratio
0.96 0.97 0.98 0.99 1.00 1.01 1.02 1.03
1 2 3 4 5 6 7 8 9 0.97
0.98 0.99 1.00 1.01 1.02 1.03
Table 6. The relative effect (in percentage) of each control factor on the variability of the measured response variable
response variable Paddle roll speed Saw speed Paddle roll loading Seed finger roll speed
ginning rate 4.29 94.65 0.59 0.45
Turnout 6.89 56.11 0.98 36.01
aFiS length 10.40 44.56 39.92 5.11
aFiS SFC 9.09 70.87 19.03 0.99
AFIS UQL 7.01 23.85 49.88 19.25
aFiS neps 38.55 11.12 36.65 13.66
AFIS VFM 22.17 52.46 8.62 16.74
HVI length 0.84 26.80 45.70 26.64
HVI uniformity 35.22 20.72 18.49 25.55
HVI Rd 23.45 56.64 2.74 17.15
HVI +b 13.23 77.16 1.18 8.40
Table 7. Mean and standard deviation of all the runs (overall) and the optimal operational configuration for each response variable
response variablez Units of mean Overall meany Overall standard
deviation Optimal meanx
Optimal standard deviation
ginning rate bale/h 6.7 0.48 7.5 0.05
Turnout % 28.8 4.40 29.2 4.94
aFiS length mm (in) 23.2 (0.915) 0.201 (0.008) 23.5 (0.925) 0.270 (0.011)
aFiS SFC % 8.5 0.46 7.4 0.65
AFIS UQL mm (in) 27.6 (1.09) 0.238 (0.009) 27.9 (1.10) 0.273 (0.011)
aFiS neps count/g 195.3 13.53 183.5 7.10
AFIS VFM % 3.04 0.526 2.6 0.653
HVI length mm (in) 26.6 (1.05) 0.246 (0.010) 26.8 (1.054) 0.309 (0.012)
HVI uniformity % 82.8 0.47 83.1 0.64
HVI Rd -- 72.7 1.46 74.1 1.06
HVI +b -- 8.5 0.21 8.3 0.15
z AFIS length, short fiber content (SFC), and upper quartile length (UQL) are by weight. VFM = visible foreign matter.
y The overall mean and standard deviation for all runs.
x The optimal mean and standard deviation obtained from the operational condition with the highest signal-to-noise ratio.
It is interesting to note that all combinations
(Table 8) have the seed finger roll at the minimum
speed and all but RVC 3 (ginning rate, turnout, and AFIS length, AFIS SFC, and AFIS UQL) have the
saw speed at the maximum of 900 rpm. The results in Table 8 further illustrate how operational settings of the gin stand can vary according to the emphasis placed on specific response variables, so various
optimal operational settings could result based on
the objective of the gin. For example,
1) If the emphasis is on ginning rate, turnout, HVI length, uniformity, Rd, and +b, the opti
-mal setting may be a paddle roll speed of 200 rpm, saw speed of 900 rpm, paddle roll loading rate of 20 amps [100% of load for the 11.2 kW
(15 hp) motor used to power the paddle roll],
and a seed finger roll speed of 7.5 rpm. 2) If the emphasis was on ginning rate, turnout, AFIS length, short fiber content, and upper quartile length, the optimal setting may be a paddle roll speed of 200 rpm, saw speed of 725 rpm, paddle roll loading rate of 18 amps (90% of load), and a seed finger roll speed of 7.5 rpm. A total of six variable combinations
were evaluated. These optimums are based
on current design, tolerance limits of the components in the gin stand, and ranges of
the parameters tested. Essential dimensions
and design aspects of the PRGS are detailed
overall, the analyses indicated several potential
optimal operational configurations depending on the variables of interest within the ranges of the param -eters tested. The variation in the optimal operational
settings, based on which production and fiber quality measurements were of interest, further emphasized the potential application of this gin stand to real-time gin process control. Real-time dynamic control of the gin stand to influence fiber grade and production is cur -rently not being done in the ginning industry. Greene
(1998) reported on the marketing advantage of using
gin process control to add value to the spinner and
thus add profits to the grower. Furthermore, McAlister
(2001) reported on a study in which gin plant process
control resulted in improvements in length, uniformity, strength, short fiber content, and neps.
One of the interesting findings of this study was that of the six optimal combinations evaluated only one did not indicate the optimal saw speed of 900 rpm. The importance of this would be setting the saw speed at 900
rpm and avoiding the costs associated with installing
variable frequency inverters on saw motors 75 kW (100
hp) or greater. The data present in this study, however, was the initial evaluation. Future studies may indicate
that any benefit of varying the saw speed outweighs costs associated with large frequency inverters.
Because the optimal saw speed of 900 rpm was at the upper limit of the range evaluated, it is impor
-tant for future studies to validate whether or not the
optimum saw speed is 900 rpm or higher. The reason
for using 900 rpm as the upper limit was due to limita
-tions of the existing equipment. Future evalua-tions are
Table 8. Predicted optimal operational configurations, based on the signal-to-noise ratio, of the six combinations evaluated
in this study compared to the optimal operational configurations obtained from the fractional factorial (L9) design used
in this study
response variable combination
Predicted optimums Predicted results
equal study resultsz
Variation of predicted results from study resultsy Paddle roll speed
(rpm)
Saw speed (rpm)
Paddle roll loading (amps)
Seed finger roll speed (rpm)
1 200 900 18 7.5 Yes
--2 200 900 20 7.5 no Higher PrL
3 200 725 18 7.5 no Lower SS
4 120 900 20 7.5 no Lower PrS and
higher PrL
5 200 900 20 7.5 no Higher PrL
6 120 900 20 7.5 no Lower SFS
z Affirmation of whether or not the predicted optimal operational configuration was the same as that obtained from using
the fractional factorial (L9) design used in this study.
y How the predicted optimal operational configuration varied from the one obtained using the fractional factorial (L9)
de-sign used in this study. PRS = paddle roll speed, SS = saw speed, PRL = paddle roll loading, SFS = seed finger roll speed.
needed to verify that the optimum speeds and loading rates for the PRGS have been properly bracketed.
Taguchi quality loss function (larger-is-better).
Figure 8 shows the mean quality loss ($) of each OC compared with the quality loss associated with the base
loan value (Plains Cotton Growers, Inc., 2006). The
customer loss in Equation 3 was calculated by taking the maximum ginning rate from Table 5 and multiply
-ing by the amount of lint in a bale [227 kg (500 lb)], then multiplying by the base loan rate [$ 0.00113/g ($
0.5160/lb)]. The customer tolerance was determined by
taking the difference between the base loan rate at 41-4 and the value of the next leaf grad at 41-5 [$ 0.00108/g
($ 0.4940/lb). The results show oC 3 has smallest loss
($ 4.39) associated with quality (Fig. 8). Had the loan rate values for each of the four responses associated with each OC been at the base loan value [$ 0.00113/g
($ 0.5160/lb)], the loss would have been $ 4.56. only
two of the nine OC had higher quality losses than the
base value, oC 8 ($ 4.58) and oC 9 ($ 4.73) (Fig. 8).
The base loan line was included to give a reference point for the values and does not imply that operation of the powered roll gin stand using the seven OC that
were lower would result in loan rates better than the
base for all seed cotton. It is interesting to note that OC 3 does not correspond to optimal settings for any of the
response variables in Table 5 or any RVC in Table 8, which illustrates the compromises necessary to obtain goals that may work in opposition to each other. For example, maximizing ginning rate and turnout may
not produce the best fiber properties or result in the
SUMMarY and COnCLUSiOnS
The powered roll gin stand (PRGS) is a new saw type ginning technology that has shown promising results in the initial studies evaluating its use in
ginning seed cotton. To prepare this technology for transfer to industry, the optimal operational settings for the gin stand’s three primary components need to be determined. The objective of this study was
to conduct an initial screening that could provide groundwork necessary to determine the most
ro-bust operational settings for the paddle roll (speed and loading rate), saw (speed), and seed finger roll (speed). Each of these factors has an effect on at least one variable of interest to a producer or cotton
ginner.
In this study response variables, such as ginning
rate, turnout, HVI fiber properties, and AFIS fiber
properties, were evaluated using Taguchi’s Method. The response variables were evaluated individually
and in six different select combinations. Taguchi’s
Method incorporates the variability (noise) brought
about by input changes into the analysis of the de -sign in order to de-sign a system or process that is insensitive (‘robust’) to environmental conditions or component variations. The noise variables evaluated in this study included harvesting with and without a
field cleaner and field location.
The most robust operational settings based on the individual response variables covered the spectrum
of the speeds and loads evaluated. The most robust
operating range seen, based on the operating ranges and conditions evaluated in this study, in a majority
of the select combination of response variables was
as follows: 1) paddle roll speed (rpm) = 200, 2) saw speed (rpm) = 900, 3) paddle roll loading = 100% of load (20 amps), and 4) seed finger roll speed (rpm)
= 7.5. When lint value ($) was used to determine the
quality loss associated with the operating conditions
evaluated, the condition with the smallest loss was
as follows: 1) paddle roll speed (rpm) = 200, 2) saw
speed (rpm) = 550, 3) paddle roll loading = 100%
of load (20 amps), and 4) seed finger roll speed
(rpm) = 10.5. It should be noted that the solutions
obtained in this study for the “select combinations” were based on equal weighting of each response variable and do not imply the “optimum” operat
-ing range for the PRGS. As the weight-ing of the response variables change, so do the “most robust”
operating ranges. Findings in this study show that
the “optimum” operational ranges for the PRGS
are dynamic and primarily determined by the value placed on individual response variables. The wide
range of response variables evaluated in this study helped focus the approach for future studies. Also, the results indicated the potential of the PRGS to be the first dynamically controlled gin stand using mathematical relationships of operational and fiber property parameters as part of a control algorithm tailored to gin cotton as close to customer specifi
-cations as possible given the state of the incoming
seed cotton.
Based on the findings of this research and the growing importance of obtaining maximum produc
-tion without compromising fiber quality, further re
-search is needed to define mathematical relationships between production and fiber quality properties of in
-terest and the operational settings of the powered roll gin stands components. In addition to defining the mathematical relationships, inclusion of other noise factors, such as cultivar, should be incorporated into future studies. These mathematical relationships in conjunction with the appropriate economic factors and/or Taguchi’s loss function could potentially re -sult in higher production rates, greater turnout, less
fiber damage during ginning, and greater profits for
the cotton gin and producer. diSCLaiMEr
Mention of product or trade names does not
constitute an endorsement by the USDA-ARS over other comparable products. Products or trade names
are listed for reference only.
Operational configurations
4.20 4.30 4.40 4.50 4.60 4.70 4.80
1 2 3 4 5 6 7 8 9
M
ea
n
qu
al
ity
lo
ss
($
)
Mean Base
Figure 8. Average quality loss ($) for each operational con
ACKNOWLEDGEMENTS
The partial support of this research by Cotton Incorporated and PRT Marketing, LLC. is gratefully
acknowledged.
rEFErEnCES
Anthony, W.S. and A.C. Griffin, Jr. 2001. Fiber breakage at
cotton gins: causes and solutions. p. 1347-1357. In Proc.
Beltwide Cotton Conf., Anaheim, CA. 9-13 Jan. 2002.
natl. Cotton Counc. Am., Memphis Tn.
Box, G. and S. Bisgaard. 1988. Statistical tools for improving
designs. Mechanical Engineering Magazine 110(1):32-40. Fowlkes, W.Y. and C.M. Creveling. 1995. Engineering
meth-ods for robust product design: using Taguchi methmeth-ods in
technology and product development. Addison-Wesley, Reading, MA.
Greene, R.W. 1998. Gin process control for market advantage.
p. 21-24. In Proc. Beltwide Cotton Conf., San Diego,
CA. 5-9 Jan. 1998. natl. Cotton Counc. Am., Memphis Tn.
Holt, G.A., J.W. Laird, W.F. Lalor, and T.C. Wedegaertner.
2001. Ginning rate, turnout, and fiber quality results for the powered roll gin stand on seed cotton. Proc. Int.
Amer. Soc. Agric. Eng. (ASAE), Sacramento, CA. 30 July – 1 Aug. 2001. ASAE, St. Joseph, MI.
Hsiang, S., R. McGorry, and I. Bezverkhny. 1997. The use of Taguchi’s methods for the evaluation of industrial knife
design. Ergonomics 40(4):476-490.
Kacker, R.n., E.S. Lagergren, and J.J. Filliben. 1991.
Taguchi’s fixed-element arrays are fractional factorials. J.
Quality Technol. 23(2):107-116.
Laird, J.W. 2000. Powered roll gin stand. U.S. Patent 6 061 875. Date issued: 16 May.
Laird, J.W., T. C. Wedegaertner and T. D. Valco. 1997.
Coat-ing cottonseed for improved handlCoat-ing characteristics.
p.1599-1602. In Proc. Beltwide Cotton Conf., New
orleans, LA. 7-10 Jan. 1997. natl. Cotton Counc. Am., Memphis Tn.
Laird, J.W., G.A. Holt, and T.C. Wedegaertner. 2000. Paddle
roll gin stand performance. Proc Int. Am. Soc. Agric.
Eng. (ASAE), Milwaukee, WI. 9 - 12 July, 2000. ASAE, St. Joseph, MI.
Laird, J.W., G.A. Holt, and W.F. Lalor. 2001. Evaluation of powered roll gin stand for seed cotton. p. 1377-1380. In
Proc. Beltwide Cotton Conf., Anaheim, CA. 9-13 Jan.
2001. natl. Cotton Counc. Am., Memphis Tn.
Laird, J.W., G.A. Holt, T.C. Wedegaertner, and W.F. Lalor. 2002. Powered paddle roll gin stand. Unpaginated CD-RoM. In Proc. Beltwide Cotton Conf., Atlanta, GA. 8-13
Jan. 2002. natl. Cotton Counc. Am., Memphis Tn. McAlister, D.D. 2001. Gin process control and the resultant
textile yarn and knit fabric quality. Appl. Eng. Agric.
17(6):761-764.
McConnell, I.A. and n.A. McPherson. 1997. The application
of statistical process design to a FCAW process. Welding
J. 76:412-416.
Mitra, A. 1998. Experimental design and the Taguchi method. p. 595-631. In Fundamentals of quality control and
improvement. 2nd ed. Prentice Hall, Inc., Upper Saddle River, nJ.
Plains Cotton Growers, Inc. 2006. 2006 Upland cotton loan schedule. Available online at http://www.plainscotton.
org/2006%20loan/2006LoanChartLBK.pdf. (verified 29
Mar. 2007).
Phadke, M.S. and G. Taguchi. 1988. Selection of quality char
-acteristics and s/n ratios for robust design. p.103-111. In
Taguchi methods: selected papers on methodology and applications. American Supplier Institute, Inc., Dearborn, MI.
Rowlands, H., F.A. Antony, and G. Knowles. 2000. An
ap-plication of experimental design for process optimisation.
The TQM Magazine 12(2):78-83.
Schmidt, S.R. and R.G. Launsby. 2000. Taguchi philosophy, design, and analysis. p. 6-1 – 6-27. In Understanding industrial designed experiments. 4th ed. Air Academy Press, Colorado Springs, Co.
Shepard, J.V. 1972. Method of oven drying seed cotton. In
Standard procedures for foreign matter and moisture ana -lytical tests used in cotton ginning research. USDA-ARS,
Agric. Handb. 422. U.S. Gov. Print. Office, Washington,
DC.
Taguchi, G., S. Chowdhury and Y. Wu. 2005. Introduction to the signal-to-noise ratio. p. 224-237. In Taguchi’s
quality engineering handbook. John Wiley & Sons, Inc.,
Hoboken, nJ.
Taguchi, G. and D. Clausing. 1990. Robust quality. Harvard Business Review, January-February 1990.
Taguchi, G. and Y. Wu. 1980. Introduction to off-line qual -ity control. Central Japan Qual-ity Control Association. nagoya, Japan.
Wilkins, J.o., Jr. 2000. Putting Taguchi methods to work to