Demographic Research a free, expedited, online journal of peer-reviewed research and commentary
in the population sciences published by the Max Planck Institute for Demographic Research
Doberaner Strasse 114 · D-18057 Rostock · GERMANY www.demographic-research.org
DEMOGRAPHIC RESEARCH
VOLUME 2, ARTICLE 3
PUBLISHED 15 MARCH 2000
www.demographic-research.org/Volumes/Vol2/3/
DOI: 10.4054/DemRes.2000.2.3
DESCRIPTIVE FINDINGS
New fertility trends in Norway
Trude Lappegård
New fertility trends in Norway
Trude Lappegård 1
Abstract
Behind a stable and relatively high fertility level in Norway during the 1990s we find increasing differences in the pattern of fertility both in regard to the timing of the first childbirth and number of children born. In this paper, data from the Central Population Register in Norway are used to provide a review of recent fertility trends and discuss the consequences of education level on differences in fertility patterns. The paper will also provide some indication of aspects that will be dealt with in future projects.
1 Statistics Norway, Division for Social and Demographic Research;
1 Introduction
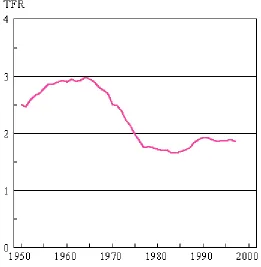
In recent decades fertility in Norway has gone through several significant changes. A simple way of measuring fertility levels and trends is to calculate period Total Fertility Rates (TFR) by summing age-specific fertility rates for each year of interest. Measured in this manner (Figure 1), Norway’s TFR peaked around 1965 at almost 3.0 and then declined until around 1975.
Figure 1:
Total fertility rate 1950-1998
2 Trends in first childbirth
The fertility rates since the late 1960s reflect the considerable change in family establishment among post-WWII generations. Women born after WWII have in many significant areas had totally different opportunities than women born earlier. Free access to abortion and better contraceptives have made it a lot easier for women to choose when they want children and
how many. Also, more education and participation in the labour force have given women greater
economic independence. Other societal changes, such as increasing women’s liberation and broader acceptance of cohabitation contribute to these changed opportunity structures.
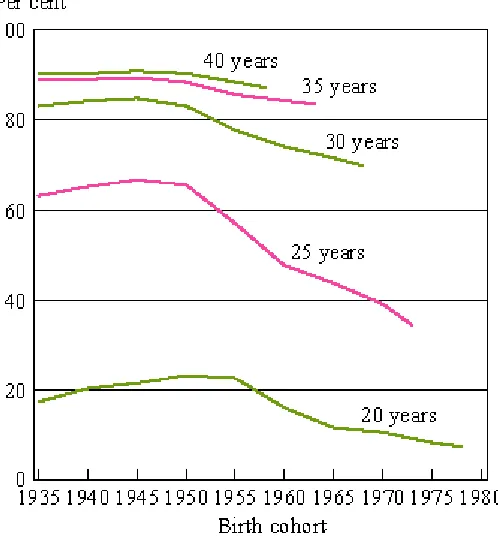
Figure 2:
Proportion first childbirth by age and birth cohort
The proportion of women giving birth for the first time as a teenager peaked among those born around 1950. For the 1950 cohort this proportion was 23 per cent and the corresponding proportion for the 1978 cohort was 8 per cent. The proportion of teenage mothers has remained at a stable low level during the 1990s [Note 1].
Another way of looking at these trends is through median and quartile age at first childbirth. This is shown in Figure 3.
Figure 3:
Median and quartile age at first childbirth by birth cohort
the 1970 cohort. Among women born in 1973 it has increased further to 23.3 years. The difference between quartile and median age has increased with almost two years from the 1950 to the 1970 cohort. There is a plateau over the cohorts born in the late 1960s in the curve for quartile age and a similar plateau for somewhat earlier birth cohorts in the curve for the median age. This happened in the late 1980s, at the same time as the total fertility rate started to increase. A possible explanation that hasn’t been examined, is the start of an expansion in family reforms, such as the increase in child allowance, extended duration of paid leave at childbirth and the growth in number of kindergartens.
Postponement of first childbirth is more pronounced for some groups than others. When talking about women’s way of living, a distinction between different generations is frequently made. Traditional patterns of fertility are typical for women in the cohorts from the 1930s to around mid 1950, while the new patterns characterise younger women. However, not all women follow new trends. Some women follow traditional patterns more closely than others which shows that women’s lifestyles vary more today than they did a generation ago [1].
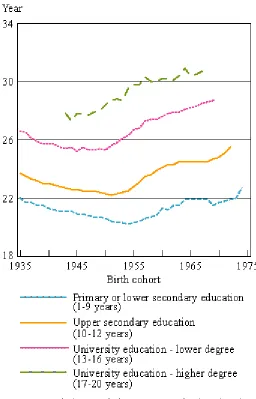
Figure 4:
Median age at first childbirth by birth cohort and educational level
education beyond compulsory level median age started to increase first among women born in the mid-1950s.
3 Trends in childlessness
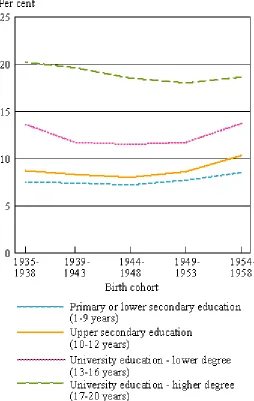
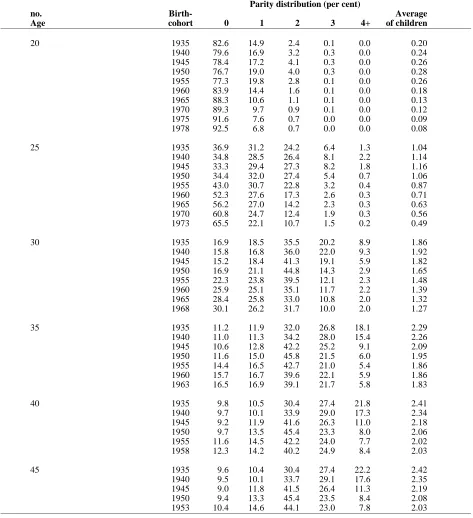
An interesting question is how a continued postponement of first childbirth will affect the number of women that remain childless. The first Norwegian cohorts that adopted new patterns of fertility, with postponement of first childbirth, were born early in the 1950s. For these women we observe a 10 per cent level of childlessness at the age of 45 (Table 1), which is very low by international standards.
TABLE 1
Figure 5:
Childlessness by birth cohort and education level
4 Number of children born
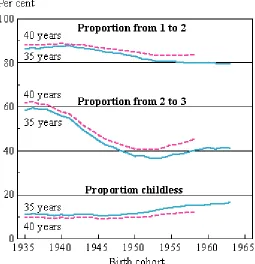
Figure 6:
Proportion childless, proportion of those with at least one child who proceeded to number two, and proportion of those with at least two children who proceeded to number three. Measured at cohort level at ages 35 and 40
The most recent developments indicate a new trend towards an increased proportion with three or more children. However, almost half of the women born in 1935 had three or more children, and it is unlikely that we will reach this level again. For women born between 1935 and 1950 we observe a decreasing proportion of women having three or more children to around 30 per cent for women born in 1950, measured by age 40 (Table 1).
in 1953, 36.6 per cent had had their third child. For women born ten years later this proportion increased to 41.3 per cent.
5 Summary and guidelines for future projects
Behind a stable and relatively high fertility level during the 1990s we find increasing differences in the pattern of fertility both in regard to the timing of the first childbirth and number of children born. Education differentiates increasingly between age at first childbirth. New forms of social inequality are emerging and old social dividing lines have been maintained. In Norwegian gender equality policy, education and labour force participation have been considered the main road to women’s liberation. Attitudes towards women’s labour force participation vary between social classes. The transition from traditional to modern patterns of fertility has not developed in parallel for all women. Increased gender equality has been the reality and ideal for many, but this modernisation of women’s life does not involve all groups of women.
Nevertheless, the fact that women wish to participate in the labour market does not mean that they do not want children. The family institution is strongly embedded in the Norwegian society. Surveys indicate that women want a family, but that they also want to participate in the labour force. Generations of women have lived their lives influenced by different regimes of family policies. Younger female generations have grown up in a time when gender equality and new patterns of family formation have been established. From a life course perspective these women probably consider labour force participation as natural as child-raising.
6 Acknowledgement
Notes
References
1. Ellingsæter, A.L, T. Noack and M. Rønsen (1997): ”Sosial ulikhet blant kvinner: Polarisering, utjevning eller status quo?, Tidsskrift for samfunnsforskning, 1, 33-69
2. Kravdal, Ø. (1992): “The emergence of a positive relation between education and third birth rates in Norway with supportive evidence from the United States ”, Population Studies 46:459-475
Table 1:
Parity distribution and average number of children by age and cohort1
Parity distribution (per cent)
no. Birth- Average
Age cohort 0 1 2 3 4+ of children
20 1935 82.6 14.9 2.4 0.1 0.0 0.20
1940 79.6 16.9 3.2 0.3 0.0 0.24 1945 78.4 17.2 4.1 0.3 0.0 0.26 1950 76.7 19.0 4.0 0.3 0.0 0.28 1955 77.3 19.8 2.8 0.1 0.0 0.26 1960 83.9 14.4 1.6 0.1 0.0 0.18 1965 88.3 10.6 1.1 0.1 0.0 0.13 1970 89.3 9.7 0.9 0.1 0.0 0.12 1975 91.6 7.6 0.7 0.0 0.0 0.09 1978 92.5 6.8 0.7 0.0 0.0 0.08
25 1935 36.9 31.2 24.2 6.4 1.3 1.04
1940 34.8 28.5 26.4 8.1 2.2 1.14 1945 33.3 29.4 27.3 8.2 1.8 1.16 1950 34.4 32.0 27.4 5.4 0.7 1.06 1955 43.0 30.7 22.8 3.2 0.4 0.87 1960 52.3 27.6 17.3 2.6 0.3 0.71 1965 56.2 27.0 14.2 2.3 0.3 0.63 1970 60.8 24.7 12.4 1.9 0.3 0.56 1973 65.5 22.1 10.7 1.5 0.2 0.49
30 1935 16.9 18.5 35.5 20.2 8.9 1.86
1940 15.8 16.8 36.0 22.0 9.3 1.92 1945 15.2 18.4 41.3 19.1 5.9 1.82 1950 16.9 21.1 44.8 14.3 2.9 1.65 1955 22.3 23.8 39.5 12.1 2.3 1.48 1960 25.9 25.1 35.1 11.7 2.2 1.39 1965 28.4 25.8 33.0 10.8 2.0 1.32 1968 30.1 26.2 31.7 10.0 2.0 1.27
35 1935 11.2 11.9 32.0 26.8 18.1 2.29
1940 11.0 11.3 34.2 28.0 15.4 2.26 1945 10.6 12.8 42.2 25.2 9.1 2.09 1950 11.6 15.0 45.8 21.5 6.0 1.95 1955 14.4 16.5 42.7 21.0 5.4 1.86 1960 15.7 16.7 39.6 22.1 5.9 1.86 1963 16.5 16.9 39.1 21.7 5.8 1.83
40 1935 9.8 10.5 30.4 27.4 21.8 2.41
1940 9.7 10.1 33.9 29.0 17.3 2.34 1945 9.2 11.9 41.6 26.3 11.0 2.18 1950 9.7 13.5 45.4 23.3 8.0 2.06 1955 11.6 14.5 42.2 24.0 7.7 2.02 1958 12.3 14.2 40.2 24.9 8.4 2.03
45 1935 9.6 10.4 30.4 27.4 22.2 2.42
1940 9.5 10.1 33.7 29.1 17.6 2.35 1945 9.0 11.8 41.5 26.4 11.3 2.19 1950 9.4 13.3 45.4 23.5 8.4 2.08 1953 10.4 14.6 44.1 23.0 7.8 2.03
1
Women living in Norway by 31.12.1998