Strojniški vestnik - Journal o f Mechanical Engineering 54(2008)5, 334-346 UDC 625.739
UDC 656.142
Paper received: 19.7.2007 Paper accepted: 19.12.2007
The Use of Micro-Simulation in Determining the Capacity of a
Roundabout with a Multi-Channel Pedestrian Flow
Tomaž Tollazzi1 - Tone Lerher2 - Matjaž Šraml1* ‘University o f Maribor, Faculty o f Civil Engineering, Slovenia 2University o f Maribor, Faculty o f Mechanical Engineering, Slovenia
The main purpose o f this paper is to analyse the influence o f the multi-channel pedestrian flow on the capacity o f the one-lane roundabout, using discrete simulation methods. The proposed model is based on the theory o f the expected time void between the units o f pedestrian traffic flow, which have the priority when crossing the arm o f the roundabout. The proposed model represents an upgrade o f the previous research in the field o f modelling traffic flows in the one-lane roundabout. While the previous model o f the pedestrian crossing is handled as the single-channel system in which the pedestrians arrive randomly from one side o f the pedestrian crossing only, the proposed model deals with the multi-channel system in which the pedestrians arrive randomly from both sides o f the pedestrian crossing. In this way the mathematical model can better illustrate the real conditions. The previous model considers only the disturbances o f entry traffic flow o f motorised vehicles caused by the pedestrian flow crossing the roundabout arm. The proposed model considers the disturbances caused by the circular traffic flow o f motorised vehicles as well. A simulation analysis has been conducted on the roundabout at Koroška Street in Maribor, in which the counting o f the motorised traffic flow and the pedestrian flow has been performed in the morning peek hour. The results o f the analysis have indicated a high reserve o f the capacity fo r pedestrians who arrive from the left and right sides o f the roundabout with regard to motorised vehicles in the analysed arm o f the roundabout. The real reserve o f the capacity would otherwise be smaller in case o f enlargement o f the motorised vehicle flow in the future. Nevertheless it would be high enough fo r an undisturbed traffic flow o f motorised vehicles through the roundabout to be possible. The presented methodology represents a practicable and adaptable toolfor planning the roundabout capacity in practice andfor the sensitivity analysis o f individual variables on the throughput capacity o f the roundabout.
© 2008 Journal o f Mechanical Engineering. All rights reserved.
Keywords: roundabout, pedestrian flow, traffic flow modeling, simulation models
0 INTRODUCTION
In one-lane roundabouts difficulties with the throughout capacity o f the roundabout can occur due to a strong pedestrian traffic flow. Vehicles on entries and exits should as a rule give priority to pedestrians. Due to this fact disturbances occur in the main vehicle flow [1] to [3].
T h e p o s s ib ility o f a b lo c k a g e o f the roundabout can be determined in several ways. In the past, authors [4] and [5] have used different ways o f determining the capacity o f roundabouts and d iffe re n t ap p ro ach es o f d e te rm in in g the influence o f the non-motorised flow on the capacity o f a roundabout. The common features o f all these approaches are mathematical models and a definite simplification for the calculation o f the roundabout
capacity [6]. Among simple methods where only a diagram or one equation is used are the German method for determining the pedestrian influence [7] and the Dutch m ethod for determ ining the cyclist influence [8] on the throughout capacity o f the one-lane roundabout.
Two m a jo r g ro u p s o f m e th o d s fo r determining the capacity o f a roundabout and the resulting influences o f pedestrian and cyclist flows on the roundabout capacity have been dominant lately. The first group consists o f deterministic and the second group o f sto ch astic m ethods. The s ig n ific a n c e o f s im u la tio n m e th o d s is also increasing, with most credit going to more and more capable computers and numerous possibilities o f creating complex mathematical models that enable a good com parability o f results w ith authentic
models. Several analytical and micro-simulation models offer variants o f the roundabout analysis based on either the gap acceptance or empirical approaches. Examples o f such codes are RODEL [9], PA R A M IC S, V IS S IM , SY N C H R O [9], SIDRA [10] to [12], etc. For the presented problem the computer tool AutoMod [13] has been used. Although the chosen code is not specialised for traffic simulation, the discrete simulation algorithm is very efficient for analysing different situation events of traffic flows. The proposed model derives from the theory o f the expected time void in the pedestrian traffic flow, used by vehicles for entering and ex itin g the ro u n d ab o u t, p resu m in g th at pedestrians always have priority. The geometry of the roundabout was copied in the simulation model, w hereby all the necessary data are taken into account. F or the m odel calib ratio n w ith real conditions in practice, the counting o f the motorised traffic flow and the pedestrian flow in the analysed arm o f the roundabout has been performed (Fig. 2). The cyclists are not discussed in this model. The a rriv a ls o f m o to rise d v e h ic le s in the roundabout are based on the Poisson statistical distribution, whereby the mean value (k,) has been obtained on the basis o f the conducted counting in the morning peek hour. Additionally, the circular flow of motorised vehicles in the roundabout was considered, w hich also presents an additional disturbance for the main flow o f motorised vehicles on the entry. The pedestrian flows are defined as a m ulti-channel flow w ith the Poisson statistical distribution with mean values (A^ and A2), which
have been obtained on the basis o f the conducted counting in the morning peak hours. In the model we also consider definite restrictions such as: the constant mean velocity o f pedestrians v; and the constant mean velocity o f motorised vehicles v34S without any respect to the driver behaviour. The m ain purpose o f this paper is to analyse the influence o f the pedestrian flow and consequently the cap acity o f the o n e-lan e th re e -a rm ed roundabout, using the discreet numeric simulation modelling.
1 PROBLEM DESCRIPTION
W hen d efin in g the red u ctio n o f the roundabout capacity because o f the pedestrian flow crossing the arm o f the roundabout, two different samples can be distinguished. In the first case, the traversing pedestrian flow influences the capacity o f the roundabout, but the traffic still flows normally. In the second case, the influence o f the pedestrian flow is so large that bottlenecks on the roundabout entry and exit are possible, which then influences the queues upon the adjacent roundabout arms [3]. If the vehicle queue is so long that it reaches the previous entry, problems with the occupation o f the roundabout arise and a blockage o f the entire roundabout can occur. In reality, the abovementioned problems o f entering and exiting a roundabout normally appear simultaneously. It is also common for the intensive pedestrian flow to traverse only one arm of the roundabout, although in some cases the pedestrian flow traverses all arms at once. In these
A
cases the blockage o f the roundabout is easier to occur. In the following paragraph, an example o f the roundabout where a strong pedestrian flow traverses only one arm is described in order to make it easier to explain.
The priority pedestrian flow traverses the southern arm o f the roundabout (Fig. 1). Time interspaces between two consecutive pedestrians are long enough; therefore the vehicles exiting the ro u n d a b o u t m ak e u se o f th e m and e x it the roundabout without disruption. The vehicle flow on the exit is stable in this case.
In the one-lane roundabout with the waiting space for one vehicle only the follow ing three situations can generally occur in the waiting place between the pedestrian crossing and the outer edge o f the circulatory roadway:
• time interspaces between individual units o f the traversing pedestrian flow are sufficient for the vehicle flow, therefore there are no waiting vehicles in the waiting place;
• time interspaces between individual units o f the traversing pedestrian flow are still sufficient for the vehicle flow, although vehicles do wait in the waiting place;
• time interspaces between individual units o f the traversing pedestrian flow are not large enough, the w aiting line is occupied all the time and every next vehicle w aits in the circulatory roadway.
H ow m any tim es these situations occur, what are the conditions for the occurrence o f these situations, what conditions have to be fulfilled for a blockage o f one roundabout arm and at what traffic load o f the pedestrian or motorised traffic flow the disturbance is transferred from one to another arm are the questions, the answers to which determine the influence o f the pedestrian flow on the throughput capacity and the efficiency o f the one-lane roundabout. It is obvious that so complex influences and mutual actions o f different variables cannot be solved without appropriate mathematical models or discreet simulations o f the traffic flows o f motorised vehicles, pedestrians and/or cyclists. In the fo llo w in g chapter the b asic theoretical background for the analysis o f the traffic flow in the roundabout is given. The simulation model and the simulation analysis o f real and variable data w hich are presum ed to be the case in the future (the enlargem ent o f the m otorised vehicle and pedestrian flows) are given.
2 THE SIMULATION OF THE TRAFFIC FLOW IN THE ROUNDABOUT
The an aly sis o f the traffic flow using discreet event simulations presents a successful w ay o f a n aly sin g co m p lex in te rse c tio n s for determining capacity, as presented in [10] to [16]. According to discreet models and traffic movement, simulation methods can be generally divided into two groups, (i) macroscopic and (ii) microscopic models. With macroscopic models the emphasis is laid on the traffic flow s. U nlike m icroscopic models, macroscopic models focus on a long-term planning period. With microscopic models every vehicle, pedestrian, cyclist, etc. can be described w ith real characteristics (dimension, velocities, accelerations, decelerations, etc.).
C o n s id e rin g th e c o m p le x ity o f th e a n a ly tic a l m odel o f the ro u n d ab o u t and the application o f the discreet simulation technique, the discreet event sim ulation was used for the analysis o f the flow capacity o f the observed area o f the ro u n d ab o u t. In th is c o n trib u tio n , the program tool AutoM od [13] has been used for the capacity analysis o f the roundabout. AutoM od is m o stly u sed to im p le m e n t d isc re e t n u m eric sim ulations o f internal logistic systems and all other logistic discreet systems [1] and [17]. The p ro g ra m m in g to o l c o n s is ts o f in d iv id u a l programming modules that construct the AutoMod as integrity. W hen m odelling a general system, th e a lre a d y b u ilt- in e le m e n ts (c o n tin u o u s transporters, autom ated transport vehicles, etc.) th at p resen t certain com plexes in the chosen process can be used. With the help o f command lines in the source file the implementation o f the sim ulation is determ ined. On the basis o f the acquired results o f the simulation analysis and its statistical processing in A utoStat [13], the success and the efficiency o f the system are analysed.
2.1 Input Data for Building the Simulation Model - An Analysis of the Actual Situation of the Traffic Flow Perform ed by Counting Pedestrians and Vehicles
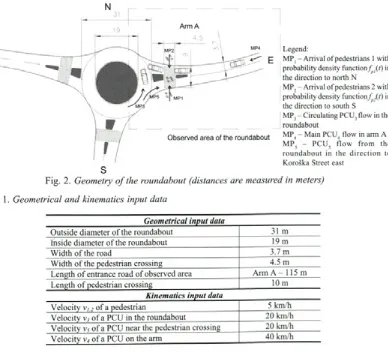
When building the simulation model for a d e fin ite area o f th e o n e -la n e th re e -a rm e d roundabout (Fig. 2), the actual geometry o f the roundabout and the velocity characteristics o f motorised vehicles and pedestrians (Table 1) were considered. The measured data was used for the calibration of the simulation model. The counting - the areas where counting was perform ed are labelled with MP. (Fig. 2) and are presented in Table 2. The mean velocity of the Personal Car Unit (PCU) before entering the roundabout equals 40 km/h, in the area o f the roundabout it equals 20 km/h; the mean velocity o f pedestrians equals 5 km/h. The arrivals o f pedestrians are based on the m ulti-channel system from both sides with probability density functions f pl(t) and f p2(t) (Fig.
2). The influence o f cyclists is neglected. The influence of the roundabout circulation is taken into account (M P3), w ith the presum ed m ean velocity 20 km/h. For all motorised vehicles (the main traffic flow MP4, the circulating flow in the roundabout M P3 and the traffic flow from the roundabout in the direction of Koroška Street - East MP5), the personal car unit model (PCU) is applied.
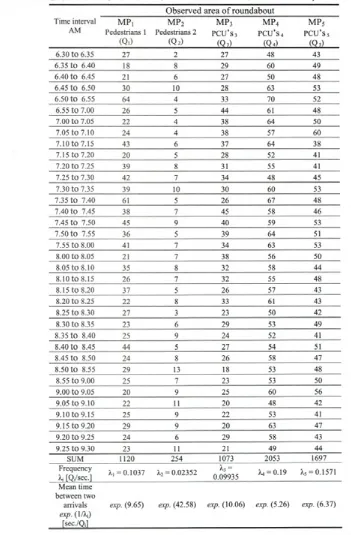
A three-hour (6.30 to 9.30 AM) counting has been performed on the observed area for the requirements o f the analysis, separately for the traffic flow o f the motorised vehicles and pedestrian traffic. Based on the traffic count o f motorised vehicles and pedestrians o f the roundabout on K oroška Street, the acquired data have been statistically evaluated. The results of the statistical evaluation of the traffic o f motorised vehicles and pedestrian traffic that are used in this work are presented in Table 2. The data in table 2 refers to the period from 6.30 to 9.30 AM.
W
Legend:
MP, - Arrival o f pedestrians 1 with probability density fu n ctio n e d ) in the direction to north N
MP2 - Arrival o f pedestrians 2 with probability density function /) Jt) in the direction to south S
MP3 - Circulating PCU3 flow in the roundabout
MP4 - Main PCU4 flow in arm A
M P ; - PCU5 flo w from the
roundabout in the directio n to Koroška Street east
Fig. 2. Geometry o f the roundabout (distances are measured in meters)
Table 1. Geometrical and kinematics input data
G e o m e t r i c a l i n p u t d a t a
O utside diam eter o f the roundabout 31 m
Inside diam eter o f the roundabout 19m
W idth o f the road 3.7 m
W idth o f the pedestrian crossing 4.5 m
Length o f entrance road o f observed area Arm A - 1 15m
Length o f pedestrian crossing 10 m
K i n e m a t i c s i n p u t d a t a
V elocity V; 2 o f a pedestrian 5 km/h
Table 2. Counting o f PCU and pedestrians i fo r the time interval o f 3 hours at MP.
O b s e r v e d a r e a o f r o u n d a b o u t
Time interval M P i m p2 m p3 m p4 m p5
AM Pedestrians 1 Pedestrians 2 p c u’s.
PCU’s 4 PCU’s5
(Q i) ( Q r) ( Ob) ( O h (Q s)
6.3 0 t o 6.35 27 2 27 48 43
6.35 t o 6.40 18 8 29 60 49
6 .4 0 t o 6.45 21 6 27 50 48
6.45 t o 6.50 30 10 28 63 53
6 .5 0 t o 6.55 6 4 4 33 70 52
6.55 t o 7.00 2 6 5 44 61 48
7.0 0 t o 7.05 22 4 38 64 50
7.05 t o 7.10 2 4 4 38 57 60
7.1 0 t o 7.15 43 6 37 64 38
7.15 t o 7.20 20 5 28 52 41
7.2 0 t o 7.25 39 8 31 55 41
7.25 t o 7.30 4 2 7 34 48 45
7.3 0 t o 7.35 39 10 30 60 53
7.35 t o 7.40 61 5 2 6 67 48
7 .4 0 t o 7.45 38 7 45 58 4 6
7.45 t o 7.50 45 9 4 0 59 53
7 .5 0 t o 7.55 36 5 39 64 51
7.55 t o 8.00 41 7 34 63 53
8 .0 0 t o 8.05 21 7 38 56 50
8.05 t o 8.10 35 8 32 58 44
8.10 t o 8.15 2 6 7 32 55 48
8.15 t o 8.20 37 5 26 57 43
8 .2 0 t o 8.25 22 8 33 61 43
8.25 t o 8.30 2 7 3 23 50 42
8 .3 0 t o 8.35 23 6 29 53 49
8.35 t o 8.40 25 9 24 52 41
8 .4 0 t o 8.45 4 4 5 27 54 51
8.45 t o 8.50 2 4 8 26 58 47
8 .5 0 t o 8.55 2 9 13 18 53 48
8.55 t o 9.00 25 7 23 53 50
9 .0 0 t o 9.05 20 9 25 60 56
9.05 t o 9.10 22 11 20 48 42
9 .1 0 t o 9.15 25 9 22 53 41
9.1 5 t o 9.20 29 9 20 63 47
9 .2 0 t o 9.25 2 4 6 29 58 43
9.2 5 t o 9.30 23 11 21 49 4 4
SUM 1120 254 1073 2053 1697
Frequency
kj rOi/sec.l Xj = 0.1 0 3 7 k 2 = 0 .0 2 3 5 2
^-3 =
0.0 9 9 3 5 X, = 0.19 Xs = 0.1571
Mean time between two arrivals e x p . (1/Aq)
e x p .(9 .6 5 ) e x p .(4 2.58) e x p .(1 0.06) e x p .(5.26) e x p .(6 .37)
fsec./Qjl
The experimentally acquired input data present the input data for the traffic flow o f motorised vehicles and pedestrians in the simulation model. Since the m easurem ents were taken using counting on an individual arm o f the roundabout, the presumption has
The tim e b etw een tw o a rriv a ls o f pedestrians or PCU is defined according to the relation presented in the next case. Case: the number of PCU3 arrivals within the time interval from 6.30 to 6.35 is 27, which is presumed to be d istrib u te d ac c o rd in g to Poisson sta tistica l distribution, with an average degree o f arrivals per time unit A = 27/5 = 5,4 [PCU3/min]; the time between two consecutive arrivals o f PCU3 can then be determined by using the exponential statistical distribution with the mean value o f t = 1/A = 0,185 [min/ PCU3],
2.2 The T heoretical Background o f the Simulation Model
When planning a roundabout, its capacity in relation to the traffic flow (;') o f PCU and (ii) pedestrians is predom inantly the main point o f interest. The general rule o f all roundabouts is that pedestrians are always given priority over the PCU traffic flow. W hen determining the capacity o f a roundabout, the rates o f PCU (A3, A4, A5) and pedestrian flows (A,, A ), crossing each other on an individual arm o f the roundabout, are used. The total capacity o f PCU and pedestrian flows in an individual arm o f the roundabout can be presented
with the following simplified relation dependence. The arrivals o f PCU and pedestrian flows in the individual arm o f the roundabout can be treated as a system o f a waiting queue with one serving place. When determining the appropriate system o f the waiting queue, the basic condition that the arrivals o f PCU are distributed according to Poisson s statistical distribution is taken into account. The condition that the time between two arrivals o f pedestrians is distributed according to exponent statistical distribution is also considered. Due to the connection between Poisson's and exponential statistical distribution, the following relation has to be defined. If the number o f PCU and pedestrian arrivals in a given time interval t is distributed according to Poisson's statistical distribution with an average degree o f arrivals in a time unit A and a medium value A-t, then the time intervals between the arrivals of two consecutive PCU and pedestrians are distributed according to the exponent statistical distribution w ith a m edium value o f 1/A. The relations in the roundabout can be represented with the following expressions:
M - refers to Poisson's distribution o f PCU and pedestrian arrivals in a given time unit, M - refers to Poisson’s distribution o f time,
required for the driving o f PCU over the
Arrival of PCU's, /«•«(» ' ‘
p e d e s tria n c ro ssin g and th e c ro ssin g o f pedestrians to the other side o f the roadway, s - only one serving station exists the system,
which is connected to the pedestrian crossing, C O — arrival in the roundabout is determined by an
infinite flow o f PCU and pedestrians,
FIFO - when coming into the system, PCU and pedestrians are first served according to the first-in-first-out (FIFO) selection rule.
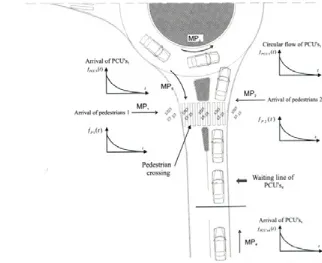
The MIMt\l°°IFIFO system for the traffic flow o f PCU and the system for the pedestrian traffic flow are schematically shown in the Figure 3 fo r the ex am ple o f the ro u n d ab o u t arm in question.
Because o f three independent traffic flows PCU. (i = 1, 2, 3) and the pedestrian j (j = 1 ,2 ) flow, an individual arm in the roundabout presents a combination o f two mutual dependent systems, that is:
• The com bination o f MJM! 1 /oo/FIFO for the PCU4 main traffic flow and pedestrian j (j = 1, 2) flow MIMI 1 /oo/FIFO.
• The com bination o f MIMI \ /oo/FIFO for the PCU3 circulating flow and the PCU4 main flow
MIMI 11^1 FIFO.
While the PCU traffic flow presents a typical M/M/l/<x>/FIFO system, the pedestrian traffic flow system MIMI\l°°IFIFO is m odified, since the w aiting time periods and the waiting line never occur. This statement can be explained by the fact that pedestrians in the roundabout are always given
priority over the motorised flow. Because o f the complexity and non-determination o f the system, the capacity o f the traffic flow o f an individual arm o f the roundabout and the entire roundabout is impossible to be analytically treated. A possible solution to the problem is the use o f discreet numeric simulations method, which is presented in the following section.
2.3 Simulation Model of the Roundabout
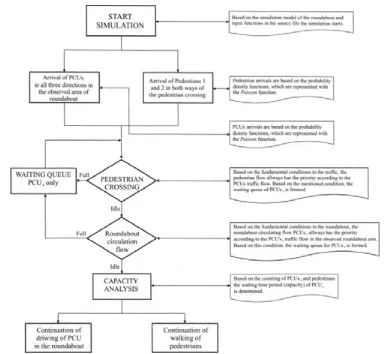
On the basis o f the real roundabout in Koroška Street in M aribor the simulation model has been created (Figure 4 presents a detailed draft o f the simulation model). The simulation model in the programming tool AutoMod [13] is illustrated with paths, on which the motorised vehicle (PCU) and pedestrian traffic flow s are entwined. The simulation model has been created on the basis of real geometrical data presented in the CAD drawing and kinematics values, which are presented in Table 1, as well as from a sample o f PCU and pedestrian traffic flow s (Table 2). The operation o f the simulation model is governed by a program code in the source file according to the follow ing algorithm (Fig. 5).
Fig. 5. Algorithm o f the course o f operating the simulation model o f the roundabout
the process »P roundabout start« begins. The process consists o f project variables, pedestrians and PCU attrib u tes o f type in teg er and real, subroutines and individual program loops. The model is built according to the defined geometries construction of the roundabout from the CAD file and kinematics characteristics for pedestrians and PCU. The mean time between two consecutive arrivals o f PCU and pedestrians is programmed according to the experimentally acquired values, presented in Table 2. It is presumed that the arrivals o f PCU and pedestrians are uneven; therefore the Poisson statistical distribution has been used for generating the traffic flow.
• The gap acceptance model
The gap a c c e p tan c e m odel o f the roundabout has been modelled using the »Block claim and Block release functions« and the »Order list«. The »Block claim function« for the arrival of
»Order list« has been used. For every passing of PCU4 and pedestrians the program registers the basic information variables » V_waiting_time« for
P C U 4, »V_no._of_ PCU4« an d »V_no._of_
pedestrians« as follows: the num ber o f passing PCU4 and the number of pedestrian crossings in the roundabout, the period an individual PCU4 has been in the observed arm of the roundabout (the waiting time period) and the number of successfully passed PCU4 and pedestrians in the defined time.
The main goal o f the simulation analysis is to establish the PCU4 capacity on the observed arm when the waiting queue in front o f the pedestrian crossing and consequently the w aiting time for crossing the observed arm is still acceptable.
2.4 Analysis of Results
The results of the perform ed analysis for determining the mean waiting time and the capacity o f the PCU4 main traffic flow depending on the pedestrian flows give basic conclusions, presented in Tables 3, 4 and 5.
With regard to the perform ed counting of th e tr a f f ic flo w o f m o to ris e d v e h ic le s and pedestrian flow (Table 2) it can be stated that the frequency o f pedestrians (A,) presents the biggest influence on the capacity of the PCU4 main traffic flo w (F ig. 4). A ssu m in g th a t th e p e d e stria n
freq u en cy w ill only g et b ig g er in the future (closure of the “Old bridge”, increase in the public transportation), it is necessary to find out what level o f increase in the num ber of pedestrians in both directions with regard to the main traffic flow o f P C U , w o u ld s till be a d m issib le . W hen analysing the capacity o f the treated arm of the roundabout, we deal with a number of independent v a ria b le s , i.e . d iffe re n t fre q u e n c ie s o f th e m otorised vehicle traffic flow
(A3, A4, A5)
and p e d e s tria n flo w(A p A2).
To d e te rm in e the influence o f a variable on the system’s response (w aitin g tim e and ro u n d ab o u t capacity) it is therefore necessary to fix individual variables and change the value o f only one variable or both variables at the same time. Since we are mainly interested in the influence o f pedestrians on the capacity of the roundabout arm, the frequency of pedestrians 1 (Aj) and the frequency of pedestrians(A2)
in the ro u n d ab o u t arm p resen t the m ainv a ria b le s . D ue to a d iffe re n t fre q u e n c y o f pedestrians in both directions
(At = 0,1037
ped./sec.and
A2 = 0,02352
ped./sec.) the influences on thewaiting time and capacity o f the roundabout for PCU4have been analysed in the following way: a) b eside the fixed v ariab les
(A3, A4, A5)
thefrequency o f pedestrians
2 (A2)
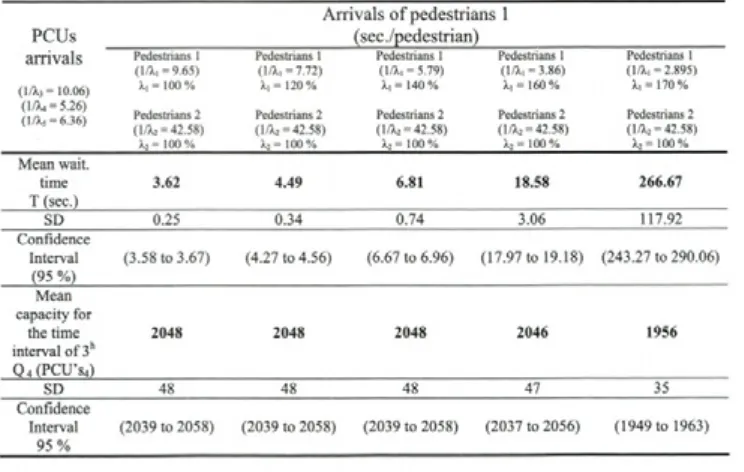
has been fixed. In the analysis, values A3 have been changed or increased to the level that the mean waiting timeTable 3. The influence o f increasing arrivals o f pedestrians 1 on the mean waiting time and mean capacity fo r the main traffic flow o f PCU4
Arrivals o f pedestrians 1
PCUs (sec./pedestrian)
arrivals
(1A3 = 10.06) (1 A4= 5.26) (IA5= 6.36)
Pedestrians 1 (1A, = 9.65) X\= 100 % Pedestrians 2 (1A2 = 42.58)
h= 100%
Pedestrians 1 (1 A, =7.72) X\= 120 % Pedestrians 2 (1A2 = 42.58) X2= 100%
Pedestrians 1 (1 Aj = 5.79) X, = 140 % Pedestrians 2 (1A2 = 42.58) X2= 100%
Pedestrians 1 (1 A, = 3.86) Xi = 160% Pedestrians 2 (1A2 = 42.58)
X2 =100%
Pedestrians 1 (1A,= 2.895)
X, = 170% Pedestrians 2 (1A2 = 42.58)
X2= 100%
Mean wait. time T (sec.)
3 .6 2 4 .4 9 6 .8 1 1 8 .5 8 2 6 6 .6 7
SD 0.25 0.34 0.74 3.06 117.92
Confidence Interval (95 %)
(3.58 to 3.67) (4.27 to 4.56) (6.67 to 6.96) (17.9710 19.18) (243.27 to 290.06) Mean
capacity for
the time 2 0 4 8 2 0 4 8 2 0 4 8 2 0 4 6 1 9 5 6
interval o f 3h Q 4 (PCU’s4)
SD 48 48 48 47 35
Confidence Interval
9 5 %
Table 4. The influence o f increasing arrivals ofpedestrians 2 on the mean waiting time and mean capacity
___±_______d____
Arrivals of pedestrians 2
PCUs (sec./pedestrian)
arrivals
(1/X3 = 10.06)
Pedestrians 2 (1/X2 = 42.58) x2 = 1 0 0%
Pedestrians 2 (1/X2 = 34.064)
X2 = 1 2 0 %
Pedestrians 2 (l/Xz = 25.548)
X2= 140%
Pedestrians 2 (1/X2= 17.032)
X2= 160%
Pedestrians 2 (I/X2 = 12.774)
X2= 170% (I/X4 = 5.26)
(I/X5 = 6.36) Pedestrians 1 (1/X, = 9.65) X, = 100%
Pedestrians 1 (1/X, = 9.65) X, = 100%
Pedestrians 1 (1/X, = 9.65) X, = 100%
Pedestrians 1 (1/X, =9.65) X, = 100 %
Pedestrians 1 (1/X, = 9.65) X, = 100 %
Mean wait. time T (sec.)
3 .6 2 3.8 4 .1 5 4 .9 4 5 .8 7
SD 0.25 0.28 0.33 0.46 0.6
Confidence Interval
(95 %)
(3.58 to 3.67) (3.75 to 3.86) (4.09 to 4.21) (4.85 to 5.03) (5.76 to 5.99) Mean
capacity for the time interval o f 3h 0 4 (PCU’s4)
2 0 4 8 2 0 4 8 2 0 4 8 2 0 4 8 2 0 4 8
S D 48 48 48 48 48
Confidence Interval (95 %)
(2039 to 2058) (2039 to 2058) (2039 to 2058) (2039 to 2058) (2039 to 2058)
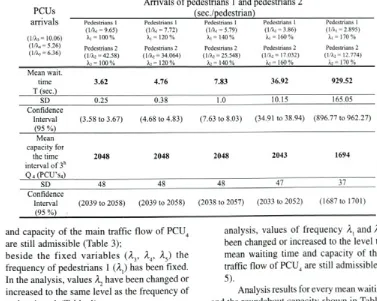
Table 5. The influence o f increasing arrivals ofpedestrians 1 and pedestrians 2 on the mean waiting time and mean capacity fo r the main traffic flow o f PCU4
Arrivals of pedestrians 1 and pedestrians 2 ___________ (sec./pedestrian)__________
a r r i v a l s Pedestrians 1 Pedestrians 1 Pedestrians 1 Pedestrians 1 Pedestrians 1
(1/X3 = 10.06)
(1/X, = 9.65) X, = 100%
(1/X, = 7.72) X, = 120%
(1/X, = 5.79) X, = 140 %
(1/X, = 3.86) X, = 160%
(1/X, = 2.895) X, = 170 %
(I/X4= 5.26)
(I/X5= 6.36) Pedestrians 2 (1/X2 = 42.58) x2= 1 0 0%
Pedestrians 2 (1/X2 = 34.064)
X2= 120%
Pedestrians 2 (1/X2 = 25.548)
X2= 140%
Pedestrians 2 (1/X2 = 17.032)
X2= 160%
Pedestrians 2 (1/X2 = 12.774)
X2= 170%
Mean wait.
time 3 .6 2 4 .7 6 7 .8 3 3 6 .9 2 9 2 9 .5 2
T (sec.)
S D 0.25 0.38 1.0 10.15 165.05
Confidence Interval
(95 %)
(3.58 to 3.67) (4.68 to 4.83) (7.63 to 8.03) (34.91 to 38.94) (896.77 to 962.27) Mean
capacity for
the time 2 0 4 8 2 0 4 8 2 0 4 8 2 0 4 3 16 9 4
interval o f 3h Q 4 (PCU’s4)
SD 48 48 48 47 37
Confidence
Interval (2039 to 2058) (2039 to 2058) (2038 to 2057) (2033 to 2052) (1687 to 1701) (95 %)
and capacity of the main traffic flow of PCU4 are still admissible (Table 3);
b) beside the fixed variables (A3, A4, A5) the frequency of pedestrians 1 (A,) has been fixed. In the analysis, values A2 have been changed or increased to the same level as the frequency of pedestrians 1 (Table 4);
c) the variables (A3, A4, A5) have been fixed. In the
analysis, values of frequency A, and A2 have been changed or increased to the level that the mean waiting time and capacity of the main traffic flow of PCU4 are still admissible (Table 5).
c o n se c u tiv e ly p erfo rm e d sim u la tio n s in the AutoStat programming tool [13]. Consequently, a good enough representative average is obtained, w hich would not be in the case o f probability fu n ctio n s w ith a sm all num ber o f perform ed simulations.
2.4 Discussion - Interpretation of the Simulation Results
In the case o f fixing the v alues o f the variables for the traffic flow (A3, A4, A5) and the pedestrian flow 2 (A2) it can be noticed that the pedestrian flow 1 in the direction o f “Old bridge” towards “Main square” has a major influence on the mean waiting time o f the main traffic flow of PCU4. W hen increasing the frequency A, from 20 % to 40 % one can notice a rather small increase in the mean waiting time, whereby the PCU4 capacity remains the same all the time. For this purpose the frequency o f pedestrians 1 was increased for 60% and it has been found out that the m ean waiting time has enormously increased in comparison with the previous increases o f frequency, whereby the capacity o f PCU4 remains unchanged. It has been determined that with constant - linear increase of the frequency A[ the mean waiting time of PCU4 does not increase evenly. In the continuation of analysis, the frequency Ax was increased from 60 % to 70 %. We have established that the mean w aiting tim e o f PC U 4 has increased to 266.67 seconds, which is unacceptable for the traffic flow in the roundabout. On the basis o f results in Table 3 it can be concluded that theoretically there is a 60 % reserve o f the capacity in the case o f increase o f pedestrian 1 frequency. This statement is valid under the condition that the frequencies of traffic flow (A3, A4, A5) of PCU are fixed and unchangeable. The same holds true for the frequency (A2) of the pedestrian flow 2.
In the continuation of the analysis, when operating with the pedestrian flow 2, the influence of increasing the frequency A2 on the mean waiting tim e o f the m ain tra ffic flo w o f P C U , was compared. Due to the simultaneous treatment with several variables the values of variables (A,, A3, A4, A5) were fixed. In Table 4 it can be observed that the increase o f the pedestrian frequency 2 does not have a major influence on the mean waiting time and capacity o f the main traffic flow o f PCU4. This finding is reasonable since the pedestrian frequency
(A2 = 0 .0 2 3 5 2 p e d /se c ) is re la tiv e ly sm all considering the pedestrian frequency (A = 0.1037 ped/sec) and consequently has a smaller influence on the mean waiting time of PCU4. This means that theoretically there is a relatively great reserve of capacity in the case of the increase of pedestrian frequency.
The actual roundabout capacity is definitely dependent on the simultaneous consideration of pedestrian frequencies Ax and
A2
as well as on other fixed variables(A3, A4, A5)
o f PCU. For this reason Table 5 shows dependencies of the mean waiting tim e and PC U 4 capacity w ith a sim ultaneous increase o f pedestrian frequencies(A,, A2)
for pedestrians 1 and pedestrians 2. Because of the simultaneous influence of both pedestrian flows 1 and 2, the mean waiting time is higher than in previous cases. The dependency of the mean waiting time and capacity of the main traffic flow PCU4 is similar to the dependency in the case of only increasing the pedestrian frequency At and fixed values o f other variables(A2, A3, A , A
). Due to a relatively small influence of pedestrians 2 and a g reat in flu en ce o f p ed estrian s 1 there is a th e o re tic a l 60 % re se rv e o f c a p a c ity at a simultaneous increase of pedestrian frequencies Aj andA2.
3 CONCLUSION
In this paper the influence o f the strong pedestrian traffic flow on the capacity o f the one- lane three-arm ed roundabout using the discreet numeric simulations modelling is presented. The analysis presented in this paper provides a new com plex confirm ation o f the traffic flow (the simultaneous use o f the main and the circulating flow) and the influence o f the strong pedestrian flow (the use o f m ulti-channel system) on the capacity o f the roundabout.
the ro u n d ab o u t are d istu rb ed , the m inim um capacity is not reached. In case the flows towards the exit o f the roundabout are disturbed, the maximum capacity can get exceeded. Under real conditions, the entering and exiting o f the motorised traffic flow are sim ultaneously disturbed and congestions are transferred from arm to arm, in c lo c k -w ise d ire c tio n . F or this p u rp o se, the mathematical modelling o f traffic flows with the use o f discreet simulations has been used for the analysis of the influence o f the pedestrian flow on the capacity o f the roundabout, considering the statistically evaluated input data o f the PCU and pedestrian traffic flows.
The main part o f this paper consists o f the discreet numeric simulation o f the roundabout. The simulation model o f the roundabout is general, i.e. it can be e x te n d e d fo r ev ery in d iv id u al im p le m e n ta tio n ac c o rd in g to the chosen g e o m e tric a l and k in e m a tic s sizes. The m athem atical model derives from legalities o f acceptable time voids in the pedestrian traffic flow, u se d by the v e h ic le s fo r e n te rin g /e x itin g a ro undabout, u sing the exponent and Poisson statistical distribution. For determination o f the traffic flow of motorised vehicles and pedestrians the real input data acquired by the traffic counting on Koroška Street in Maribor have been used. The results (the capacity o f m otorised vehicles Q4) acquired with measurements o f the traffic flow and simulation analyses match well (Tables 4, 5 and 6), which means that simulation analysis results give a good prediction for the evaluation of the waiting period and waiting queues o f motorized vehicles in an individual arm o f a roundabout. It has been determined that the current situation of the traffic flow is acceptable for the roundabout capacity. With an increase o f the pedestrian flow (in both directions) a m ajor influence on the roundabout capacity is not expected. On the basis o f analysis results it can be established that there is a relatively great reserve available in relation to the capacity of pedestrians 1 and 2 (up till 60 % of current frequencies A, in A2). Since the traffic flow o f PCU is going to increase in the future, we assume that the capacity reserve will get lower, but it will still be great enough to allow an undisturbed traffic flow o f PCU. It should be m entioned that the analysis results refer to the counting o f traffic flow carried out in the morning peak hour, only on the treated part o f the roundabout. In the continuation
o f this research it would be reasonable to analyse the influence o f the mean waiting time and PCU capacity on the w hole roundabout and in the afternoon peak hour, considering a different pedestrian speed. D ifferent types o f motorised vehicles and pedestrians (dim ensions, reaction times, velocities, accelerations, etc.) should be taken into account.
4 REFERENCES
[1] Tollazzi, T., Lerher, T., Šraml, M. An analysis o f the influence o f pedestrians’ traffic flow on the capacity o f a roundabout using the discreet simulation method. Journal o f Mech. Eng. (2006), voi. 52, p. 359-379.
[2] Tollazzi, T., Kralj, B., Destovnik, S. Analysis o f the in flu en ce o f p e d e stria n flow on roundabout capacity by using the simulation method. Suvremeni promet, (2005), vol. 25. [3] Tollazzi, T., Lerher, T., Šraml, M. Simulation
of the pedestrians’ influence to the capacity of motorised vehicles in a roundabout. Am. j. appi, sci., 2008, 5, 1, p. 34-41. http://www. scipub.org/fulltext/ajas/ajas5134-41 .pdf. [4] S tone, J.R ., C hae, K. R oundabouts and
pedestrian capacity: A simulation analysis. Transportation Research Board, A nnual Meeting CD-ROM, 2003.
[5] H agring, O. A fu rth er g en eralizatio n o f Tanner’s formula. Transportation Research Part B: Methodological, Elsevier Science, Exeter, England, voi. 32 b, no. 6, 1998. [6] Wu, N. A universal procedure for capacity
d eterm in atio n at u n sig n a liz e d p rio rity controlled in tersectio n s. Transportation Research Part B: Methodological, Elsevier Science, Exeter, England, volume 35 b, no. 6,
2001.
[7] Federal Ministry for Economy: Guidelines: Using area and design elem ents o f roundabouts on federal roads, Chapter VI/2. Berlin, 1996. (In German).
[8] Information and Technology Platform for Transport, Infrastructure and Public space: Roundabouts, publication 79, Ede, 1993. (In Dutch).
[9] O ketch T., D elsey M., R o b ertso n D. E valuation o f p e rfo rm an ce o f m odern roundabout using Paramics micro-simulation
[10] A k felik R. Roundabout m odel calibration issu e s and a case study. TRB N ational Roundabout Conference, Colorado, 2005. [11] A k
9
elik R., Besley M. Microsimulation andanalytical methods for modelling urban traffic. C onference o f A dvanced M odelling Techniques and Quality o f Service in HCA, truckee, California, USA, July 2001.
[12] A kfelik R. Operating cost, fuel consumption and pollutant emission savings at a roundabout w ith m e te rin g sig n a ls. 7th Congress on Advanced in Civil Eng. (ACE 2006), Turkey 2006.
[13] B R O O K S A u to m a tio n , A utoM od-U ser manual V 12.0, Utah, December 2005.
[14] W iederm ann, R., R eiter, U. M icroscopic traffic sim ulation. The Simulation System Mission, 1970.
[15] Fellendorf, Vortisch. Integrated modelling o f transport demand, route choice, traffic flow and traffic emissions, January 2000.
[16] D ow ling A sso ciates, Inc. Guidelines fo r applying traffic microsimulation modelling software. Federal Highway Administration, August 2003.