Trend of Groundwater Quality Changes, Using Geo Statistics
(Case Study: Ravar Plain)
Babakhani, M.1, Zehtabian, G.H.2, Kesh 1 and Khosravi, H.2*
1. International Desert Research Center (IDRC), University of Tehran, Tehran, Iran
2. Faculty of Natural Resources, University of Tehran, Tehran, Iran
Received: 20 Nov. 2015 Accepted: 27 Dec. 2015
ABSTRACT :Groundwater aquifers are an important source of water supply for agriculture, industry and drinking. The present study investigates the changes in the quality of groundwater using geostatistical methods in the Ravar plain during a 10-year period. In this study, after selecting the appropriate spatial interpolation method to draw water quality parameters such as TDS, SAR and EC, zoning maps of Ravar plain were provided for three periods of time: the first period (2002-2005), an intermediate period (2006-2009) and the final period (2010-2012) in two seasons using ArcGIS 10.1. For this purpose, data were evaluated in GS+ 5.1 software, after calculation, the best model with the lowest estimated error was selected for zoning water quality parameters. Because of the lowest estimation error, Kriging, Gaussian and Spherical variogram models were selected as appropriate interpolation method for zoning the quality parameters. The results of the spatial analysis of TDS showed that TDS have been increased in the study area. Due to the amount of dissolved solids, EC amount was highly variable. According to the Wilcox classification, at the end of the period, water quality of agricultural was inappropriate in most of the area which represents the increase of electrical conductivity during the period.
Keywords: geostatistics, groundwater quality, Ravar Plain, spatially changes.
INTRODUCTION
Water is the principal source of economic development, social security, and poverty reduction. The value of water source leads to enhancement of management measures to maintain its quality and quantity by communities. Environmental changes and human activities affect on the quality and quantity of water. Urban growth, increasing industrial activities and overuse of chemical fertilizers in agriculture result in pollution of groundwater and surface water which have adverse effect on the health of human beings, animal and plants (Andre, 2005). Groundwater is the primary source to supply agriculture and drinking
Corresponding Author Email: [email protected]
water hence recognition and awareness of groundwater quality and the water classification based on the number of various elements of them will assist us in making management decisions and decline groundwater pollution.
Groundwater considers substantial segment of renewable water world. Calculation of global water resources shows that groundwater resources devote approximately 0.6 percentages of entire water resources and 60 percentages of accessible renewable water resources (U.S. Environmental Protection Agency (EPA), 2005). For optimal use of existing water resources comprehensive and awareness planning is essential and it will not possible without accurate and precise cognition of DOI: 10.7508/pj.2016.02.002
Print ISSN 2383-451X Online ISSN: 2383-4501 Web Page: https://jpoll.ut.ac.ir Email: [email protected]
water quality and quantity. In third world and developing countries most attention has been paid to detect the appropriate aquifers to supply agricultural and drinking water requirement rather than maintain the quality of the aquifers (Kangaroglu and Gunay, 1997).
In recent years, withdrawal of groundwater resources has been risen on account of population growth, industrial and agricultural development. Undeniably groundwater reservoirs are considered the most significant resource for exploitation and development in the arid and semi-arid regions. Regional monitoring of the aquifers level and groundwater quality are the fundamental indicators in order to provide sustainable development in these regions (Ahmadian et al., 2015). Groundwater resources are the largest accessible fresh water storage in the Earth planet where the surface water resources are restricted or unavailable. Excessive withdrawal of water leads to diminish of groundwater quality and the salinity of resources is increased over time. Consequently measurement and control of quality parameters of groundwater resources have special significance (Khasheie and Sarbazi, 2015). There is evidence to suggest that renewal cycle of surface water resources lasts 20 days but this period takes longer for groundwater resources, In the other words, the pollution of groundwater resources and aquifers is predominantly irreversible. Groundwater resources are the main drinking supply for more than 1.5 billion people around the world especially in arid and semi-arid regions of the world such as Iran (Ardakani et al., 2014). There is a direct relationship between water quality and health, personal and public hygiene, moreover, the significance of the quality of groundwater and surface water is obvious to everyone. Meanwhile, the importance of groundwater resources (as an appropriate option for drinking water supply) with regard to high expenses of utilizing surface water and furthermore increased pollution of surface
water has been doubled. As a result of the fact that Iran is located in arid and semi-arid regions that is categorized in a critical countries of the world in terms of water capitation and water supply. In the recent decades, chiefly because of increased water consumption and excessive withdrawal of water resources especially groundwater resources, besides due to lack of management and optimum using of accessible water the phenomenon of water scarcity has been appeared in country. Lack of sufficient precipitation and inappropriate temporal and spatial distribution had major impacts on the matter of water scarcity (Pourakbar et al., 2015).
Khosravi et al. (2016) investigate the decrease of groundwater table in Mehran-Ilam plain. For this purpose statistical data of 22 well piezometers at the period of 2002-2012 were used. Then in the ArcMAP by utilizing kriging interpolation zoning map of reduction of water table and symptom lines for severe drought was drawn. The results show that during the severe drought the maximum drop in the amount of 6.31 meter was related to a piezometers well which locates in plain center (agricultural land), and minimum drop in the amount of 0.08 meter was related to a piezometers well which locates in north of plain. Groundwater level hydrograph has been expressed that in relevant year 2.13 meter of the water level has been reduced. Continuing drought occur, excessive water harvesting, increasing acreage and wrong irrigation system as which were declared as cause of that.
Sadeghi (2013) interrogated the effects of land use changes on groundwater quality and quantity of Zarivar Lake watershed in Marivan. By using of Satellite Images GIS and geostatistics methods. The conclusion was that the land use changes from forest to agriculture had major impact on quality and quantity features of groundwater especially in the north of the region.
plain determining the spatial distribution of quality indicators and drawing the maps of groundwater quality in the study area. 110 water samples from 55 piezometer wells during two seasons of low rainfall and high rainfall were collected and tested. The final map of groundwater quality indicated that groundwater quality from the west to the east of Shiraz plains is declining. 4.6 percentage of groundwater of the study area have favorable quality, 7.9 percentage has well quality, 27.7 percentage mediocre quality. 48.8 percentage moderate to low and 11.3 percentage which locates in the south east of the plain has the lowest quality.
Wu et al. (2012) studied the relationship
between landscape and water quality for evaluating the effects of non-point sources of pollution. Allometric models and classical models of multiple linear regressions were tested to assessment the relationship between criteria of landscape and water quality in Sihu basin (Hobi province in China). The results showed that utilizing Allometric models is potentially a new method to investigate the relationship between landscape and water quality index which assists to protect regional water resources.
Deepak and Uday (2013) surveyed physicochemical parameters of groundwater of Dahar in India. For this purpose the data of 10 piezometer wells of the region was utilized. Parameters studied included pH, Turbidity, Alkalinity, TH, TDS, sulfate, nitrate, chloride and fluoride. The consequences represented groundwater quality index during each season is at permissible level and ground water is safe to drink and is suitable for use as drinking water.
Pawar et al. (2014) evaluated spatial and locational changes in groundwater quality in Mombi region in India by using groundwater quality index. In this study 15 piezometer wells were sampled and the results showed 74 percentage of the samples is in class of non-drinking water which are not appropriate for drinking. Because the study area is located in an
industrial area human activities leading to pollution of natural resources such as groundwater region.
This essay intends to survey trend of groundwater quality changes of Ravar plain in kerman province, in order to recognition and planning optimal utilization management of water resources and principled management of agriculture in the study area and the better understanding of negative factors in this field lead to avoid further destruction of groundwater resources which have the key role in this region.
The objectives of this study are summarized as follows:
Drawing quality maps of groundwater resources of Ravar plain, zoning plain water quality parameters in order to study spatial changes of Ravar plain groundwater quality
Geostatistical analysis and evaluating each quality parameters
Determine the most appropriate method of interpolation for groundwater quality parameters
Survey relationship between Ravar plain groundwater resources quality parameters
Determine proper quality water resources for the intention of agriculture and drinking water
MATERIALS AND METHODS
The study area (Ravar plain) with total area of 4080 square kilometers in north of Kerman province is located at longitude 56° 42´ 35″ to 56° 58´ 37″ at latitude 31° 8´ 43″ to 31° 26´ 27″ which is located at 40 zone in Universal Transverse Mercator. The study area is located in central Iran plateau basin on sideline of lut plain in south east of Iran.
1. Collect Data on Groundwater Resources
(2002-2012) was taken from the database of Kerman province water department. The information includes quality parameters such as TDS, Ec, and SAR.
2. Select Collaborative Time Base
Since piezometer wells were drilled in various years there are a number of different statistical years for wells which result in the statistical analysis is difficulties to make. Therfore collaborative and optimal time base was considered. Due to this base year 2002-2012 were chosen to survey groundwater quality of Ravar plain.
3. Survey Trend of Groundwater Quality Status Changes in Study Area
In this section hydro chemical data of study area was analyzed. After the data of groundwater quality indictors classified, zoning maps for different indicators by using ArcGIS 10.1 were prepared.
4. Geostatistics Methods
In this study kriging geostatistical method was used. To perform this procedure GS+ software was utilized to identify the best model and ArcGIS 10.1 was used to draw zoning map. Each quality parameters were assessed by GS+ software after calculation the best fit model for each parameters were identified and the model used to draw zoning map of parameters. After reviewing the errors in each of the kriging models the model which has the lowest estimated error
were selected as appropriate interpolation method to predict the spatial variability of each of the quality parameters. As regards in kriging method data should be normal in this survey for normalized most of the parameters Gaussian model was utilized.
RESULTS
1. Survey Groundwater Quality of Ravar Plain
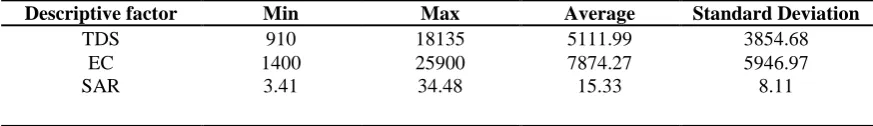
Statistical indicators such as Minimum, Maximum, Average and Standard deviation are shown in Table 1 which is the results of statistical analyses of groundwater quality parameters. Owing to the minimum amount of electrical conductivity is more than 1400 (μmho/cm) according to Wilcox classification groundwater of study area is placed in c₃ and c₄ class which has average and inappropriate quality for irrigation (Wilcox, 1995). The average amount of TDS is about 5000 (mg/lit) according to Schuler classification groundwater of plain is completely undesirable for drinking.
2. Geostatistic Analysis
After drawing the experimental variogram by using GS+ 5.1 software appropriate theoretical model to fit the experimental variogram was chosen. The best variogram model and appropriate interpolation method in each year of study for groundwater quality parameters in Table 2 is shown.
Table 1. Characteristic of qualitative factors of groundwater resources of Ravar plain
Standard Deviation Average
Max Min
Descriptive factor
3854.68 5111.99
18135 910
TDS
5946.97 7874.27
25900 1400
EC
8.11 15.33
34.48 3.41
SAR
Table 2. Appropriate interpolation method in each of statistical periods to interpolate groundwater quality parameters
SAR EC
TDS Harvest season
Kriging(Spherical) Kriging(Gaussian)
Kriging(Gaussian) March and September (2002-2005)
Kriging(Spherical) Kriging(Gaussian)
Kriging(Gaussian) March and September (2006-2009)
Kriging(Spherical) Kriging(Gaussian)
3. The Best Fitted Variogram for Each Parameter
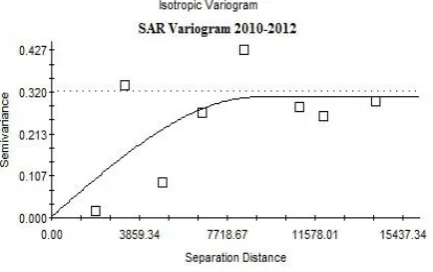
SAR variograms during the study period in Figure 1 is illustrated. The range of variogram during the study period is on average of 10810 meter, nugget effect is equal to 0.001 Square meters and sill exceeds 0.403 Square meters. R² is calculated 0.65 for fitted model. Spherical model has the
lowest amount of Residual sum of squares (RSS) and the utmost R² rather than other models. In this model the proportion of nugget effect to sill is more than 75% which indicates strong spatial dependence of data. Spherical model was the best variogram model which was selected as suitable fitted model for SAR data.
Fig. 1. SAR Variograms of Ravar plain during study period
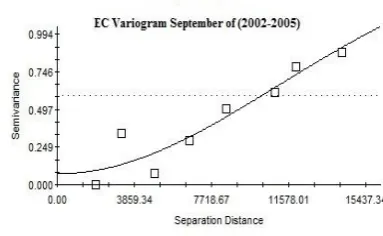
EC variograms during the study period in Figure 2 is shown. The range of variogram during the study period is on average of 15400 meter, nugget effect is equal to 0.07 Square meters and calculated sill is 12.28 Square meters. R² is computed 0.89 for fitted model. Gaussian model has the lowest amount of Residual sum of squares (RSS) and the utmost R² rather
than other models. In this model the proportion of nugget effect to sill is more than 75% which indicates strong spatial dependence of data. Gaussian model was best variogram model which was selected as suitable fitted model for EC data.
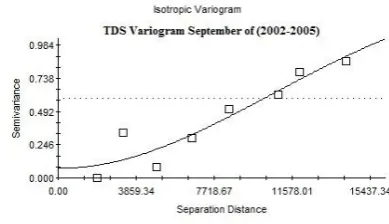
average of 14830 meter, nugget effect is equal to 0.08 Square meters and calculated sill is 1.57 Square meters. R² is computed 0.89 for fitted model. Gaussian model has the lowest amount of Residual sum of squares (RSS) and the utmost R² rather
than other models. In this model the proportion of nugget effect to sill is more than 75% which indicates strong spatial dependence of data. Gaussian model was best variogram model which was selected as suitable fitted model for TDS data.
Fig. 3. TDS Variograms of Ravar plain during study period
4. Analysis Maps of Quality of Study Area
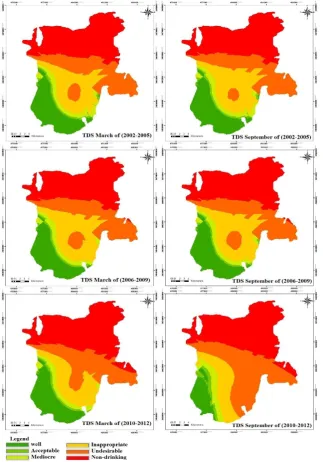
4.1. Study TDS
Zoning maps of TDS by utilizing Gaussian interpolation method provided (Fig. 4). Amount of TDS is significantly related to Geological formation and human made resources (World Health Organization, 2008). Maps of TDS according to Schuler classification criteria were zoned. The amount of TDS from first period (2002-2005) to intermediate period (2006-2009)
toward north and North West in the direction of hydraulic gradient has been enhanced. This type of trend in both the discharge and feeding seasons was equally observed. The quality of groundwater for drinking in north and north east and North West of study area is non-drinking and in the middle of study area is undesirable and inappropriate. Merely in the south and south east of the area water quality is fine and acceptable. In the study area existence of evaporative formations, soluble formations and detrimental water quality
(salty mud zones) which have spread in the plain, also urban pollution such as municipal waste discharge, agricultural return water especially in the eastern part of the plain have affected on the TDS concentration of groundwater samples.
Longer groundwater contact with evaporative formations is another reason of increment this parameter in the north east of the plain. Traversing groundwater from south east to north leads to worsening water quality in mentioned route.
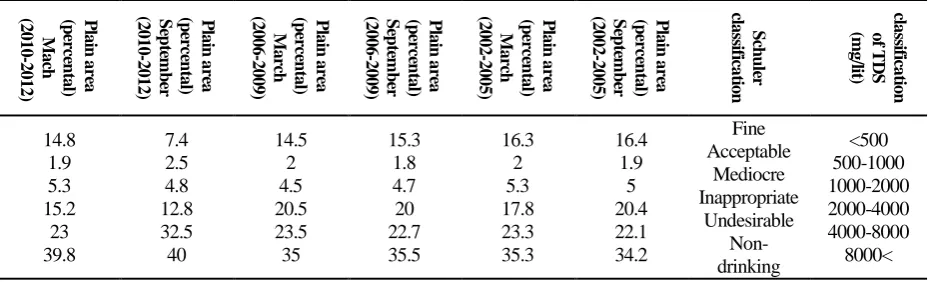
Percentage of Ravar plain which is assigned to TDS amount during three studies period is illustrated (Table 3). TDS classified according to Schuler classification showed that in the first and second period approximately 19.5% of plain area has inappropriate drinking water quality, 23% entirely undesirable and nearly 35% of plain area has non-drinking water. Whereas in the last period 24% of the plain area has inappropriate drinking water quality, 28% completely undesirable and about 40% of plain area has non-drinking water quality which represents TDS rising trend during statistical period.
Drinking water in the most parts of the plain is undesirable and non-drinking.
4.2. TDS temporal changes
TDS temporal changes diagram during statistical period in Figure 5 is shown. As indicated in figure the minimum amount of TDS was 5030 mg/lit in 2002 and the maximum amount of TDS was 5440 mg/lit in 2012. The increasing trend of TDS during statistical period is illustrated in diagram. According to Schuler classification water quality of plain for drinking water is undesirable.
Table 3. The assigned area to TDS classes of Ravar plain
cla ss ifi ca tio n o f T D S (m g /li t) S ch u le r cla ss ifi ca tio n P la in a re a (p er ce n ta l) S ep te m b er (2 0 0 2 -2005) P la in a re a (p er ce n ta l) M a rc h (2 0 0 2 -2005) P la in a re a (p er ce n ta l) S ep te m b er (2 0 0 6 -2009) P la in a re a (p er ce n ta l) M a rc h (2 0 0 6 -2009) P la in a re a (p er ce n ta l) S ep te m b er (2 0 1 0 -2012) P la in a re a (p er ce n ta l) M a ch (2 0 1 0 -2 0 1 2 ) <500 500-1000 1000-2000 2000-4000 4000-8000 8000< Fine Acceptable Mediocre Inappropriate Undesirable Non-drinking 16.4 1.9 5 20.4 22.1 34.2 16.3 2 5.3 17.8 23.3 35.3 15.3 1.8 4.7 20 22.7 35.5 14.5 2 4.5 20.5 23.5 35 7.4 2.5 4.8 12.8 32.5 40 14.8 1.9 5.3 15.2 23 39.8
5000
5100
5200
5300
5400
5500
80
85
90
95
TDS
(mg/lit)
Time(year)
Fig. 5. TDS temporal changes of aquifer during statistical period
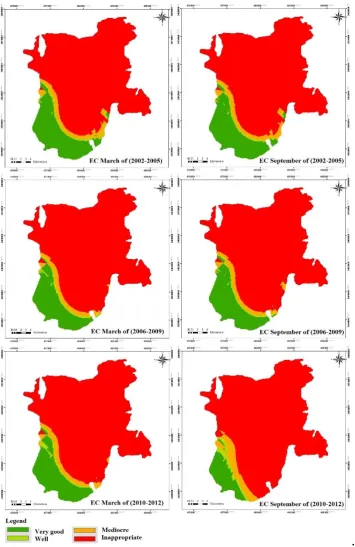
Zoning maps of electrical conductivity of Ravar plain by means of Gaussian interpolation method is prepared (Fig. 6).EC maps were zoned according to Wilcox classification criteria. In the first and intermediate period greater areas of the
inappropriate which shows EC boost trend during statistical period. The minimum amount of EC in the south and south west of the plain and the maximum amount of EC in the east, north, north east and north west of the plain in the Dagh-e-ravar,
Yusef-abad, Deh-ali and allah-abad wells were observed that indicate abundant minerals and infiltration to groundwater. This changes trend in both feeding and discharge season were seen.
.
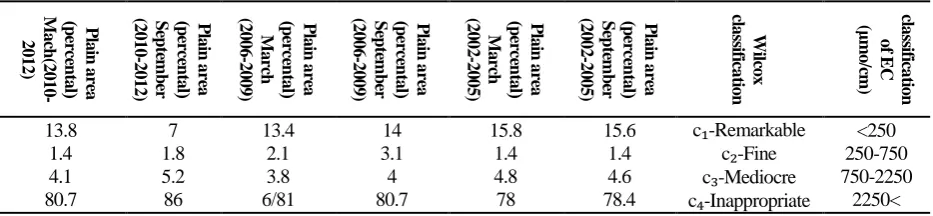
The percentage of area of Ravar plain which is devoted to EC during three studies period were shown (Table 4). According to Wilcox classification on average in the first and intermediate period about 20% of plain area have remarkable and mediocre agricultural water quality. In the last period the agricultural water quality was diminished so that about 86% of plain area have inappropriate groundwater quality and exclusively in certain circumstances the water can be utilized.
4.3. EC temporal changes
EC temporal changes diagram during statistical period is shown (Fig. 7). The minimum amount of EC in 2005 and 2007 were equal to 7300 (μmo/cm). Diagram indicates EC upward trend for the study period. According to Wilcox classification much of plain water for agriculture is placed in c₄ class which is inappropriate for agriculture and it is utilizable In certain circumstances (Resistant to salinity plants
in coarse texture soil with high drainage) (Mahdavi, 2009).
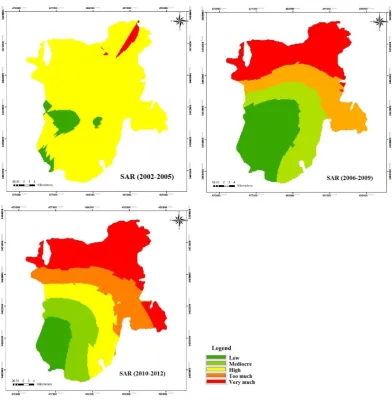
4.4. Survey of SAR
SAR zoning maps of Ravar plain by using Spherical interpolation method were drawn are represented (Fig. 8). SAR zoning maps according to the relationship between the amount of Na in the water and SAR have been classified. In the first period the amount of SAR approximately in the whole of the plain have placed in the range of 14-16 and from the intermediate period to the last period upward trend is observable. The maximum amount of SAR in the north and north east and north west of the Ravar plain in Dagh-e-ravar and Yousef-abad piezometer wells and the minimum amount of SAR in the south west of the plain in Kheir-abad piezometer wells were observed. The amount of SAR from the South West to the North East of the Plain has increased.
Table 4. The assigned area to EC classes of Ravar plain
cla ss ifi ca tio n o f E C (μ m o /cm ) W ilc o x cla ss ifi ca tio n P la in a re a ( p er ce n ta l ) S ep te m b er (2 0 0 2 -2005) P la in a re a ( p er ce n ta l ) M a rc h (2 0 0 2 -2005) P la in a re a ( p er ce n ta l ) S ep te m b er (2 0 0 6 -2009) P la in a re a ( p er ce n ta l ) M a rc h (2 0 0 6 -2009) P la in a re a ( p er ce n ta l ) S ep te m b er (2 0 1 0 -2012) P la in a rea ( p er ce n ta l ) M a ch (2 0 1 0 -2012) <250 250-750 750-2250 2250< c₁-Remarkable
c₂-Fine c₃-Mediocre c₄-Inappropriate 15.6 1.4 4.6 78.4 15.8 1.4 4.8 78 14 3.1 4 80.7 13.4 2.1 3.8 6/81 7 1.8 5.2 86 13.8 1.4 4.1 80.7 7200 7400 7600 7800 8000 8200 8400 8600
80 85 90 95
EC(μmo/cm)
Time(year)
Fig. 8. SAR zoning map (2010-2012)
Table 5. The assigned area to SAR classes of Ravar plain
Classification of SAR The amount of Na
in the water Plain area
(percental) 2002-2005 Plain area
(percental) 2006-2009 Plain area
(percental) 2010-2012
6-10 10-14 14-18 18-22 22-26 low
mediocre high plenty Very much -
5.6 92 2.4 - -
27 23 21.5 28.5 10
17.5 18.5 21 33
The percentage of area of Ravar plain which is devoted to SAR during three studies period were shown (Table 5). The amount of SAR during statistical period was indicated rising trend. In the first
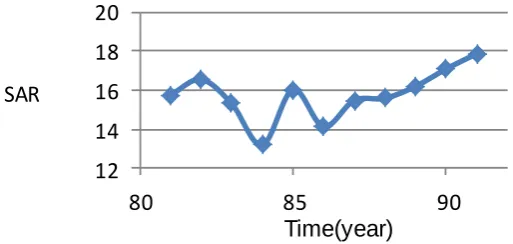
4.5. SAR temporal changes
SAR temporal changes during statistical period are shown in Figure 9. The diagram indicates SAR upward trend during study period. According to Wilcox classification the water quality of much area of the plain
for agriculture are placed in c₃ and c₄. The quality of water is inappropriate for agriculture and only it is usable in special condition.
12 14 16 18 20
80 85 90
SAR
Time(year)
Fig. 9. SAR temporal changes of aquifer during statistical period
DISCUSSION AND CONCLUSION
In this survey zoning of spatial changes of groundwater parameters kriging methods were applied. Assessing various interpolation methods showed that the best interpolation methods which contain the lower RMSE measure and the higher R² measure is Kriging method. The variant methods of Kriging were evaluated and the variography analysis of zoning of spatial changes of groundwater parameters showed that in most cases Spherical and Gaussian variogram methods were the best methods to interpolate evaluated methods. Precision of interpolation methods depend on sample quantities and spatial distribution. Other studies in this field have shown various results but in all these studies Kriging have been introduced as the best interpolation method and the only different is the fitted variogram model for data.
Keiykhosravi (2014) surveyed zoning of groundwater quality with statistical methods in Sabzevar plain indicated that Kriging method is the one of the best methods for zoning the studies parameters. Although, in this study sometimes Inverse distance weighted method has lower error rather than
Kriging method. Totally, for zoning parameters in this survey according to evaluating methods among utilized way for most of the parameters kriging method had the least error which was reliable. Diverse models of kriging were assessed and different results were obtained but in most of the cases Gaussian and Exponential models were chosen as best model to interpolate the evaluated parameters. The consequences of Keykhosravi’ survey corresponds the results of this survey.
north east and with this direction very few flow exit the east and north east of studied area. For this reason the amount of TDS has increased from the aquifer feeder place in the south west of the plain to the aquifer discharge place in the north east of the plain. Since formation of the area constitute of evaporative formations therefore the more contact time between groundwater and evaporative formation is the factor of increasing this parameters in north east of the plain. Classification of TDS according to Schuler taxonomy illustrated that the amount of TDS during statistical period is increasing and the quality of groundwater in much of the plain is\ undesirable and non-potable for drinking. Ravar plain is dry desert climate with high evaporation rate and the lack of rainfall in the region result in the low quality of groundwater of area. Also, due to the groundwater resources are the most important water resources in the region which increase exploitation of groundwater that cause to reduction of groundwater quality.
The results of investigation of Abdolahhi et al. which surveyed the groundwater quality parameters of Ravar plain showed that the amount of TDS parameter from feeding aquifer place to discharge aquifer place and according to Hydraulic gradient has boosted that coordinated with the results of this study.
Keykhosravi (2014) also showed that the parameter of TDS of groundwater in Sabzevar plain from first period to intermediate period had constant trend but in the last period had an upward trend which indicated the effects of existence of Saline formations in this area and excessive withdrawal of water lead to increasing TDS. The results of Keykhosravi’s survey is consistent with the results of this study. Existence of evaporative-Gypsum formation in the stratigraphic column of Ravar plain results in salination of water even in permeable and hard rocks area. Rising saltine formation of Jurassic era and before that and placing them in the ground level which had
essential role in salting surface water and groundwater.EC in groundwater is a function of TDS and temperature ,with rising them the amount of EC increase. According to amount of TDS in water the amount of EC is highly variable. In the first and intermediate period a large area of the plain have remarkable and mediocre groundwater quality for agriculture and in the last period the quality of groundwater is reduced. In the last period in the majority of the plain groundwater for agriculture according to Wilcox classification is inappropriate which indicated the increasing trend of EC during statistical period. According to Wilcox classification groundwater of the area for agriculture is located in c₄ class which is inappropriate for agriculture. And only in certain circumstances some of this water can be utilize (Mahdavi, 2009).
The results of Keykhosravi (2014) investigation indicated that quality factors have major and substantial role on water quality for various uses. During different years and in survey of statistical temporal changes from the first period to the last period changes trend was increasing which is consistent with this survey.
REFERENCES
Abdollahi, M., Gheshlaghi, A. and Abbasnejad, A. (2013). Environmental hydrogeochemical of groundwater resources of Ravar plain. Eighth conference of the association of engineering geology and the environment. 6-7 November. Ferdousi Mashhad University.
Ahmadian. M., Chavoshian. M. and Darvish, M. (2015). Determination of groundwater level fluctuations as an indicator of semi-arid land resources degradation using geostatistical methods (case study: Kaboudrahang-Famenin). Iranian journal of range and desert research. 22(1), 109-120.
Andre, L., Franceschi, M., Puchan, P. AND Atteia, O. (2005). Using geochemical and modeling to enhance the understanding of groundwater flow in a regional deep equifer, Aquitaine Basin, South-west of France. J. Hydrol, 305, 40-42.
Ardakani, S., Talebiani, S. and Maanijou, M. (2014). Evaluation of As, Zn, Pb and Cu concentrations in groundwater resources of Toyserkan plain and preparing the zoning map using GIS. Journal of Mazandaran University of Medical Sciences. 24(114), 120-129.
Badieenejad, A., Farzadkia, A. and Gholami, M. (2014). Survey of chemical quality groundwater resources of Shiraz plain by means of GIS. Persian Gulf biomedical Research Institute, 3, 357-367.
Deepak, S. and Uday, S.N. (2013). Water Quality Index for Ground Water (GWQI) of Dhar town, MP, India. International Research Journal of Environment Sciences, 2(11), 72-77.
Environmental Protection Agency (EPA). (2005). the Report to Congress, Waste Disposal Practices and Their Effects on Ground Water. EPA/570/9-77/001 (NTIS PB265-081), 512 pp.
Hassanipak, A. (2013). Geostatistic. University of Tehran publishers. Fourth edition.
Kangaroglu, F. and Gunay, G. (1997). Ground water nitrate pollution in an alluvial aquifer, Eskir urban area and its vicinity, Turkey. Environmental Geology, 31, 178-184.
Keykhosravi, R. (2014). Zoning groundwater quality parameters by utilizing geostatistic (case
study: Sabzevar plain), thesis of master, faculty of natural resources, University of Tehran .
Khasheie, A. and Sarbazi. M. (2015). Study of spatial distribution of groundwater quality using LS-SVM, MLP and geostatistical models. Journal of water and sewage, 3, 93-103.
Khosravi, H., Karmi, k., Nakhaee nejadfard. S. and Mesbahzadeh, T. (2016). Investigation of Spatial Structure of Groundwater Quality Using Geostatistical Approach in Mehran Plain, Iran. Pollution, 2(1), 57-65.
Mahdavi, M. (2009). Applied hydrology, second copy, University of Tehran publishers, sixth edition.
Pawar. S., Panaskard. B. and Wagh. V. M. (2014). Characterization of groundwater using water quality index of solapur industrial, (case study: Maharashtra, INDIA). International Journal of Research in Engineering & Technology, 2(4), 31-36.
Pourakbar, M., Mosaferi. M. and Shakerkhatibi, M. (2015). Groundwater quality assessment from a hydrogeochemical viewpoint (case study: Sarab county). Journal of water and sewage, 3, 116-126.
Regional Water Company of Kerman province. (2012). Project of survey of quality and quantity of groundwater of Ravar-Kerman plain.
Sadeghi, A. (2013). Evaluation and monitoring land degradation and its effects on quality and quantity of groundwater Zaribar lake watershed, thesis of master, faculty of natural resources, University of Tehran .
WHO. (2008). Guidelines for Drinking-Water Quality [Electronic Resource]: Incorporating First Addendum Recommendations, World Health Organization. Geneva, Switzerland, 515 pp.
Wilcox L.V. (1955). Classification and use of irrigation water, US Department of Agriculture., Circ. 696, Washington, DC.