67
Body Composition, Vertical Jump, Agility
and Muscular Strength of Athletes and Non-Athletes
Jake Nash1, Danny Becker1,Fred Miller1, Yenly Londono1
1Department of Kinesiology, Huntington University, Huntington, IN, USA
Abstract
Introduction: Performing competitively is the main goal for volleyball and basketball players. To perform competitively an athlete needs to be fit. A good way to evaluate fitness of athletes is to compare them among one another and with non-athletes. Therefore, the purpose of this study was to compare body composition, vertical power, agility, and muscular strength among female volleyball players (V), basketball players (B), and non-athletes (NA). Methods: Participants (N = 41) were all females attending Huntington University between the ages of 19 to 22 years of age. Participants completed body composition assessment, vertical jump, t-test and one repetition squat maximum. To determine statistical differences, a one-way ANOVA was performed in Excel, with Tukey’s post hoc analyses performed in XLSTAT. Results: Significance differences were found among all tests, except body composition. The only significant difference between teams was the vertical jump in which the volleyball team performed significantly (p < 0.05) better than the basketball team (21.9 ± 2.0 in vs 19.4 ± 2.4 in). Post hoc analysis revealed significance differences (p < 0.05) in muscular strength between V vs NA (206.8 ± 33.2 lbs vs. 131.4 ± 38.0 lbs) and B vs NA (204.1 ± 25.6 lbs vs. 131.4 ± 38.0 lbs); in agility between V vs NA (10.6 ± 0.5 s vs. 12.3 ± 0.5 s) and B vs NA (10.4 ± 0.5 s vs. 12.3 ± 0.5 s); and on the vertical jump test between V vs NA (21.9 ± 2.0 in vs. 17.6 ± 2.0 in). Conclusions: The volleyball team performed significantly better than non-athletes on the vertical jump, agility t-test and squat max. The basketball team performed significantly better than non-athletes on the agility t-test and squat max. Our findings indicate that overall female athletes (specifically volleyball and basketball players) are more fit than non-athletes.
68
INTRODUCTION
Athletes are expected to perform to the best of their ability every day; whether it be in practice, while lifting or in competition. For athletes to perform at their best, they need to be fit. What is considered fit varies by sport. For example, basketball and volleyball involves similar biomechanics and physical requirements and thus their fitness needs will be alike, much more so than basketball and cross-country, where basketball requires good agility and cross-country high levels of aerobic endurance. To perform well in basketball and volleyball requires not just good agility, but also optimal levels of strength, power, and relatively low body fat1.
Body fat is defined as the total amount of body mass that is fat2. If an athlete has high
body fat, they are more likely to perform sub-par in their sport and on other fitness tests such as the vertical jump and agility t-tests2. This is because body fat is dead
weight that typically slows down the athlete and lowers the athlete’s power, thus explosiveness. Many devices such as a handheld bioelectrical impedance analyzer can easily assess body fat.
A second important fitness component for basketball and volleyball players is vertical power, defined as the ability of one to reach maximal strength in a quick manner3,4. Increasing power typically comes
from decreasing the time it takes to reach maximal strength output. A third needed fitness component is muscular strength
normally measured using one repetition maximum (1RM) and defined as the maximum force a muscle or muscle group can contract2. The fourth fitness component
is agility, defined as the ability to change direction quickly and powerfully and has been noted as one of the hardest skills to improve2.
The four fitness components mentioned above (i.e., body composition, power, agility, and muscular strength) are easily assessed in athletes and can be good indicators of the athlete’s training and fitness. Improving just one component, such as muscular strength, has the potential to increase performance in the other three components2. Increasing fitness, which will
likely lead to improved athlete performance, could be one avenue for coaches to help their athletes performed better on the playing field.
69
the effects of training, and to find out whether athletic performance is being negatively affected by low fitness. Therefore, the purpose of this study was to compare body composition, vertical power, agility, and muscular strength among female volleyball players, basketball players, and non-athletes. It was hypothesized the volleyball team would have the lowest percent body fat, highest vertical jump, fastest agility time, and higher absolute muscular strength compared to basketball players and non-athletes.
METHODS
Participants
This study included 41 female participants, which consisted of 11 non-athletes, 14 volleyball and 16 basketball athletes. All participants were between the ages of 19 to 22 years. Each participant was informed of the fitness tests to be completed and signed a consent form for participating. All participants also completed a short health questionnaire to assess past injuries. Some athletes could not perform certain tests due to injuries. The basketball team had two participants unable to complete the agility t-test, one participant could not complete the vertical jump test, and five participants could not perform the one repetition maximum (1RM) back squat. The volleyball team had two athletes not tested for body fat and three participants did not perform the 1RM back squat. This study was
approved by the IRB (Institutional Review Board) prior to any testing.
Experimental design
Participants were assessed for body fat, vertical jump, agility and 1RM back squat unless previously stated. The testing order was the following: body composition, vertical jump, T-test, and 1RM back squat. Minimal rest (3-5 minutes) was given between tests. Pre-testing instructions included how to perform the test, benefits and potential risks, and time for participants to ask any questions. The time of testing varied throughout the day and was based on the availability of the participant.
70
basketball gym and then did a five-minute dynamic warm-up. Before reaching their squat max, the participants were instructed to complete ten body squats. The athletes were then told to start with 95lbs and complete ten repetitions with this weight and increase weight by 10lbs, minimum. After this weight the athletes performed just one repetition at increasing weight intervals. The maximum weight used to perform the squat was recorded.
Statistical analyses
Descriptive statistics (i.e., means and standard deviations) were performed in Excel. A one-way ANOVA performed in Excel was used to determine statistical differences among the three groups for each test. Tukey’s post hoc analysis was performed using XLSTAT to asses which groups differed. Post hoc analysis was performed for the vertical jump, agility t-test and squat max. Statistical significance was set at p ≤ 0.05.
RESULTS
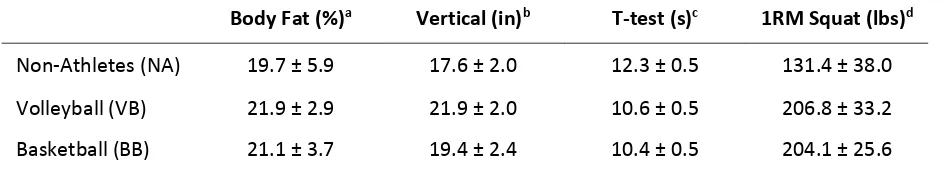
One-way ANOVA indicated that percent body fat was not significantly different among non-athletes, volleyball and basketball players (19.7 ± 5.9 % vs. 21.9 ± 2.9 % vs. 21.1 ± 2.9 %). However, vertical jump, agility t-test and 1RM back squat were all statically significant (p < 0.05). Tukey’s post hoc test revealed the following results: Volleyball and basketball teams have similar absolute relative strength (206.8 ± 33.2 lbs vs 204.1 ± 25.6 lbs), however, their muscular strength was significantly higher than non-athletes (131.4 ± 38.4). The volleyball and basketball teams had similar agility (10.6 ± 0.5 s vs. 10.4 ± 0.5 s), but both teams scored significantly faster than non-athletes (12.3 ± 0.5 s). The volleyball team had a significantly higher vertical jump than the basketball team and non-athletes, but the basketball team and non-athletes had statically similar vertical jumps (21.9 ± 2.0 in vs. 19.4 ± 2.4 in vs. 17.6 ± 2.0 in). The means (± SD) for the fitness assessments performed by the volleyball team, basketball team and non-athletes are presented in Table 1.
Table 1. Means (±SD) for body fat, vertical jump, T-test, and 1RM Squat.
Body Fat (%)a Vertical (in)b T-test (s)c 1RM Squat (lbs)d
Non-Athletes (NA) 19.7 ± 5.9 17.6 ± 2.0 12.3 ± 0.5 131.4 ± 38.0 Volleyball (VB) 21.9 ± 2.9 21.9 ± 2.0 10.6 ± 0.5 206.8 ± 33.2 Basketball (BB) 21.1 ± 3.7 19.4 ± 2.4 10.4 ± 0.5 204.1 ± 25.6
71
DISCUSSION
This is the first study known to compare these four specific fitness components among non-athletes and two sports teams. The purpose of this study was to compare body composition, vertical jump, agility and muscular strength among female volleyball players, basketball players, and non-athletes. It was hypothesized that volleyball would have the best fitness scores among the three groups. The volleyball team did score significantly better on the vertical jump than the basketball team and non-athletes. Furthermore, the volleyball team and basketball teams both performed better on agility and muscular strength than non-athletes. Surprising though was that volleyball and basketball athletes had similar percent body fat levels of non-athletes. This finding is in contrast to some previous studies and what many would expect. According to Bayios’ study, volleyball athletes typically have lower percent body fat and perform better in physical tests than basketball players and even soccer players1. In another study, it
was discovered that women's volleyball team had significantly lower body fat percentages than that of the basketball team. The volleyball team averaged 22.5% body fat while the basketball team averaged 25.2%5. Mala researched the body
compositions of elite Greek female athletes in five sports including volleyball, basketball, soccer, handball and softball. The volleyball athletes rounded off the best body composition with the lowest body
max index of 21.2 ± 1.4, with the soccer team having the second-best index (21.9 ± 1.4)6. Even though within studies volleyball
players had better body compositon, the volleyball players average body fat levels similar to other studies. For instance, the volleyball team in the present study average 21.9%, similar to the 22.5% found in the previous study mentioned.
Associations among the four fitness components are apparent in the present study and previous research. For instance, one study reported a negative relationship between body fat and vertical jump performance4. This relationship however
was not found in the present study. The three groups in the present study had significantly similar body compositions, but volleyball players jumped significantly higher than basketball players and non-athletes. An association was found though between vertical jump and 1RM back squat. Volleyball players jumped significantly higher and had a significant higher 1 RM back squat than non-athletes, indicating a possible positive association between lower body strength and jumping ability. Perez-Gomez and colleague7 assessed different
methods to improve vertical jump performance. They discovered plyometric exercises and squatting increased vertical jump, thus indicating an association between lower muscular strength and vertical jump7, similar to the present study
72
performance, lower body weight training and/or plyometric training may be the answer. Regarding vertical jump, it is also associated with agility. In the present study, volleyball players jumped significantly higher and completed the T-test significantly faster than non-athletes. Delextrat and colleagues3 reported
somewhat similar results in that guards in basketball performed significantly better than centers on both a single-leg jump and agility T-test. The higher performance of both fitness components in one group indicates a possible association between those fitness components.
The means of the four fitness values for each group in the present study were compared to either the normative tables in ACSM’s guidelines8 or to NSCA’s descriptive
data tables9. Based on Table 4.6 in ACSM’s
guidelines, non-athletes in the present study fell into the “good” category, while both the basketball and volleyball athletes fell into the “fair” category for body composition. This was surprising, considering most people would assume athletes would fall in the “good” category and non-athletes in the “fair” category. Regarding vertical jump comparisons, the mean vertical jump for NCAA Division I women volleyball players (based on Table 13.7) was 20.8 inches9, compared to 21.9
inches for women volleyball players in the present study. The 1.1 inch higher average vertical jump of women in the present study is surprising considering the present study women are NAIA athletes, which
NAIA is considered by some to have “less” fit athletes compared to NCAA DI. Regarding test comparisons, the mean T-test time for NCAA Division I women volleyball players was 10.65 seconds (based on Table 13.21)9, similar to the mean of
10.60 seconds for women volleyball players in the present study. In the same table, women college students averaged 11.92 seconds9, slightly faster than 12.3 seconds
of non-athletes in the present study. These comparisons provide additional insight on the “fitness” of participants in the present study.
Methodological considerations
This research study had a few limitations. First, the use of different floors for the agility and vertical jump test could have affected the results. Second, the athletes were tested during different sport seasons, which could have possibly affected their fitness. For example, the volleyball team was tested in the final week of their in-season, which could have potentially led to better fitness because of having several days of training and being in competition. The basketball team, however was tested right after finishing pre-season which could have negatively affected their fitness. Third, this study consisted of college athletes; thus findings may not be generalized to all populations.
Implications
73
school and professional athletes and coaches). First, the volleyball and basketball female athletes now know their body fat percentage, muscular strength, agility and vertical jump. Knowing these results helps them better understand their fitness levels and will allow them to follow up their progress in training, if tested on these same measures later. Second, the volleyball team coaches can feel more confident their training may have helped their teams achieve higher vertical jump compared to basketball players and non-athletes. Furthermore, their training may also explain why they performed better than non-athletes on the 1RM squat and agility test. A third implication is the basketball coaches may use these results to include training focused on increasing vertical jump, since the basketball team had similar vertical jump scores as the non-athletes in this study. Fourth, both the basketball and volleyball coaches at this institution may focus on including exercises that help to decrease percentage body fat. It is possible that lowering the body fat percentage of volleyball and basketball players below non-athletes will lead to improved performance. Coaches of other NAIA affiliated schools can use the results of this study to compare the fitness of their basketball and volleyball athletes to this Midwest University. This information might help them to have a reference in regards to their fitness of their athletes and help improve training.
Finally, follow up testing of body fat, muscular strength, agility and vertical power for the basketball and volleyball teams at this Midwest University would be helpful in tracking their fitness.
CONCLUSIONS
Our findings support the assumption that overall female athletes (specifically, volleyball and basketball players) are more fit than non-athletes. However, athletes had similar body fat levels of non-athletes and on some fitness tests, athletes and non-athletes were similar. For example, basketball players and non-athletes scored similar on the vertical jump test. For coaches and athletes desiring fitness, it may be worthwhile to perform fitness tests comparing their results with non-athletes and also with normative tables for their respective sport.
Acknowledgements
The authors would like to thank the Huntington University Department of Kinesiology for the equipment and lab space needed for this study. Furthermore, the authors thank the volleyball players, basketball players, and non-athletes for their participation in this research study, along with their respective coaches for allowing them to participate.
References
74 2. Kenney WL, Wilmore JH, Costill DL. (2015).
Physiology of Sport and Exercise (6th ed).
Champaign, IL: Human Kinetics.
3. Delextrat A, Cohen D. (2009). Strength, power, speed, and agility of women basketball players according to playing position. J Strength Cond
Res, 23, 1974-1981.
4. Abidin NZ, Adam MB. (2013). Prediction of vertical jump height from anthropometric factors in male and female martial arts athletes. Malays J Med Sci, 20, 39–45.
5. Stanforth PR, Crim, BN, Stanforth D, Stults-Kolehmainen MA. (2014). Body composition changes among female NCAA division 1 athletes across the competitive season and over a multiyear time frame. J Strength Cond Res, 28, 300-307.
6. Mala L, Maly T, Zahalka F, Bunc V, Kaplan A, Jebavy R, Tuma M. (2015). Body composition of elite female players in five different sports games. J Hum Kinet, 45207-215.
7. Perez-Gomez J, Calbet JL. (2013). Training methods to improve vertical jump performance.
J Sports Med Phys Fitness, 53, 339-357.
8. Pescatello LS. (2014). ACSM's Guidelines for
Exercise Testing and Prescription (9th ed).
Baltimore, MD: Lippincott Williams & Wilkins. 9. Haff GG, Triplett TN. (2016). Essentials of
Strength Training and Conditioning (4th ed).