Please cite this article as: J. Valinejad, Z. Oladi, T. Barforoushi, M. Parvania, Stochastic Unit Commitment in the Presence of Demand Response Programunder Uncertainties, International Journal of Engineering (IJE), TRANSACTIONS B: Applications Vol. 30, No. 8, (August 2017) 1134-1143
International Journal of Engineering
J o u r n a l H o m e p a g e : w w w . i j e . i rStochastic Unit Commitment in the Presence of Demand Response Program
under
Uncertainties
J. Valinejada, Z. Oladib, T. Barforoushi*a, M. Parvaniac
a Department of Electrical and Computer Engineering, Babol Noshirvani University of Technology, Babol, Iran b Mazandaran University of Science and Technology, Babol, Iran
c Department of Electrical and Computer Engineering, University of California Davis, Davis, California
P A P E R I N F O
Paper history:
Received 03 August 2016
Received in revised form 06 May 2017 Accepted 07 July 2017
Keywords:
Ancillary Services Demand Response Stochastic Optimization Uncertainty
Wind Power
A B S T R A C T
In this paper, impacts of various uncertainties such as random outages of generating units and transmission lines, forecasting errors of load demand and wind power, in the presence of Demand response (DR) programs on power generation scheduling are studied. The problem is modelled in the form of a two-stage stochastic unit commitment (UC) which by solving it, the optimal solutions of UC as well as DR are obtained. Generating units’ constraint, DR and transmission network limits are included. Here, DR program is considered as ancillary services (AS) operating reserve which is provided by demand response providers (DRPs. In order to implement the existent uncertainties, Monte Carlo (MC) simulation method is applied. In this respect, scenarios representing the stochastic parameters are generated based on Monte Carlo simulation method which uses the normal distribution of the uncertain parameters. Backward technique is used to reduce the number of scenarios. Then, scenario tree is obtained by combining the reduced scenarios of wind power and demand. The stochastic optimization problem is then modelled as a mixed-integer linear program (MILP). The proposed model is applied to two test systems. Simulation results show that the DR improves the
system reliability and also reduces the total operating cost of system under uncertainties.
NOMENCLATURE
𝑖 Index for thermal units. 𝐶𝑖𝑡𝑆𝑈 Scheduled start-up cost of unit 𝑖 at time 𝑡 [$]
𝑗 Index for demand. 𝐶𝑖𝑡𝑤𝐴
Adjustment cost due to the change in the start-up of unit i at time t and scenario w [$]
𝑡 Index for time (hour) 𝑓𝑡𝑤(𝑛, 𝑟) Power flow through line (𝑛, 𝑟) at time 𝑡 and scenario 𝑤 [MW]
𝑚 Index for energy blocks offered by thermal units,
running from 1 to 𝑵𝑶𝒊𝒕 (number of blocks)
𝐿𝑗𝑡𝑤𝐶 Power consumption for load j at time t and scenario w [MW]
𝑠 Index for DRP bid segments, running from 1 to 𝑵𝑺𝑳 𝐿𝑗𝑡𝑆 Scheduled power for load j at time t [MW]
𝑤 Index for scenarios, running from 1 to 𝑵𝒘 𝐿𝑗𝑡𝑤𝑠ℎ𝑒𝑑 Involuntary load shedding for load j at time t and scenario w [MW]
𝑟, 𝑛 Indices for system buses 𝑃𝐺𝑖𝑡𝑚
Scheduled power from the m-th block of energy offered by unit 𝑖 at
time t [MW]
𝛬 Set of transmission lines 𝑃𝑡
𝑊𝑃,𝑆
Scheduled wind power at time t [MW]
𝑀𝐿 Set of loads in the set of buses 𝑝𝑖𝑡𝑆 Scheduled power of unit i at time t [MW]
𝑀𝐺 Set of generating units into the set of buses 𝑃𝑖𝑡𝑤𝐺 Scheduled power of unit i at time t and scenario w [MW]
𝜆𝑖𝑡𝑆𝑈 Start-up offer cost of unit i at time t [$] 𝑅𝑖𝑡𝑈 Scheduled up-spinning reserve of unit i at time t [MW]
𝜆𝐺𝑖𝑡𝑚
Marginal cost of the m-th block of energy offered by
unit i at time t [$/MWh] 𝑅𝑖𝑡𝐷 Scheduled down-spinning reserve of unit i at time t [MW]
𝜆𝐿𝑗𝑡 Profit of load j at time t [$/MWh] 𝑅𝑖𝑡𝑁𝑆 Scheduled non-spinning reserve of unit i at time t [MW]
𝜆𝑊𝑃𝑡
Marginal cost of the energy offer submitted by the
wind producer at time t [$/MWh] 𝑟𝑖𝑡𝑤𝑈 Deployed up-spinning reserve of unit i at time t and scenario w [MW]
*Corresponding Author’s Email: [email protected] (T. Barforoushi)
𝑉𝑂𝐿𝐿𝑗𝑡 Value of loss load for load j at time t [$/MWh] 𝑟𝑖𝑡𝑤𝐷 Deployed of unit i at time t and scenario w [MW]
𝑉𝑡𝑆 Wind power spillage cost at time t [$/MWh] 𝑟𝑖𝑡𝑤𝑁𝑆
Deployed non-spinning reserve of unit i at time t and scenario w [MW].
𝜋𝑤 Probability of scenario w 𝑟𝐺𝑖𝑡𝑤𝑚 Deployed reserve from the m-th block of energy offered by of unit i at time t and scenario w [MW]
𝐵(𝑛, 𝑟) Susceptance of line n-r (p.u.) 𝑆𝑡𝑤 Wind spillage at time t and scenario w [MW]
𝑓𝑚𝑎𝑥(𝑛, 𝑟) Maximum capacity of line 𝑛 − 𝑟 [MW] 𝑼 𝒊𝒕
Binary variable (equal to 1 if unit i is committed at time t , otherwise 0)
𝐿𝑗𝑡𝑤 Realized consumption for load j at time t and scenario w [MW] Vitw
Binary variable (equal to 1 if unit i is online at time t and scenario w, otherwise 0)
𝑃𝑡𝑤𝑊𝑃
Realized wind power generation at time t and
scenario w [MW] Wjtw
s Binary variable associated with discrete point s of load j at time t;
equal 1 if the point s is deployed in scenario w and 0 otherwise
𝛿𝑛𝑡𝑤
Voltage angle at bus n at time t and scenario w
[rad] Zjt
s Binary variable associated with discrete point s of load j at time t;
equal 1 if the point s is scheduled and 0 otherwise
1. INTRODUCTION
By dominant increase in the electricity consumption, applying renewable sources of energy for generating electricity is increased due to environmental impacts. Among them, wind energy has gained more attraction in comparison with other resources. Also, due to intermittent nature of wind resources, the wind power is not accurately predictable. Thus, Independent System Operator (ISO) determines a certain value of reserve in system to cover the uncertainty and preserve the reliability of system. Significant development of communication systems and then feasibility of on-line measurement of consumptions in the demand-side, together with entering of power system in the competitive market setting, makes the system operators to use the demand side for providing ancillary services. DR is defined as the participation of end users in the electricity market that is applied in response of cost changes [1]. In order for better implementation of the DR program, demand response provider (DRP) is introduced as a new entity to electricity market. DRP registers a consumer for participating in the DR program and proposes her or him to ISO. Thus, in the operational planning, the DR resources are allocated by the operators as reserve capacity. Also, the reserve capacity provided through DR not only can improve the system reliability during peak time, but also can be used as an alternative for costly conventional units [2].
Nowadays, competition and restructuring in the power systems lead to emergence of new problems and uncertainties. This makes great interest in system operators in using stochastic programming for solving problems. In literature [3, 4], operating reserve is evaluated using reliability criterion, where the unit commitment risk is determined according to the demand risk supply. In reference [5] the optimization process of spinning reserves and unit commitment are considered simultaneously. Simopoulos et al. presented a reliability constrained unit commitment, which considers both forced outage of units and uncertainty of the demand, to determine the spinning reserve. Simulated annealing
algorithm was used for solving the problem. In reference [6], a two-stage stochastic unit commitment model has been presented to determine both the spinning and non-spinning reserves in the presence of a high penetration of wind power. Wind power uncertainty was considered in sets of scenarios. However, forced outages of generating units and transmission lines have been neglected.
robust commitment schedule. Probabilistic criteria are used to optimize the amount, location, and chronological procurement of the reserve in a given power system in literature [16] where, The presented approach factors the probability of individual contingencies in a cost/benefit analysis, which balances the pre-contingency operating costs against the post-contingency cost of interruptions. Shahidehpour et al. [17] presented a two-stage robust security constrained unit commitment (SCUC) model for managing the wind power uncertainty in the hourly power system scheduling. The presented method does not only pay attention to the feasible and economic operations within the flexible sets but also consider the risk in wind spillage or load curtailment out of them. An N-1 security constrained formulation was presented by Tejada-Arango et al. [18] to solve SCUC, where Line Outage Distribution Factors (LODF).
In none of the mentioned references, impacts of uncertainty of wind power, forecasted demand and random failures of generating units and transmission lines are considered simultaneously. In addition, DR program is considered as operating reserves in order to handle existing uncertainties and therefore improving system reliability and reducing the total cost. Thus, in this paper, a novel model is proposed to investigate impacts of DR programs on operating cost and reliability under uncertainties of demand, wind generation and failures of components. The unit commitment problem is modelled in the form of two-stage stochastic programming, considering the reliability criterion. To handle existing uncertainties, Monte Carlo simulation method is applied and sets of scenarios are generated. Therefore, consideration of stochastic contingencies and DR programs in wind power and thermal UC under uncertainties is the main contribution of this paper. The expected load not served is considered as reliability index for involuntary load shedding. The energy and reserves of generating units and reserves provided by DRP are determined by solving the stochastic MILP model using solver CPLEX 11.2.0 under GAMS.
2. MATHEMATICAL FORMULATION
In the following sub-sections, the mathematical formulation of the proposed framework is presented.
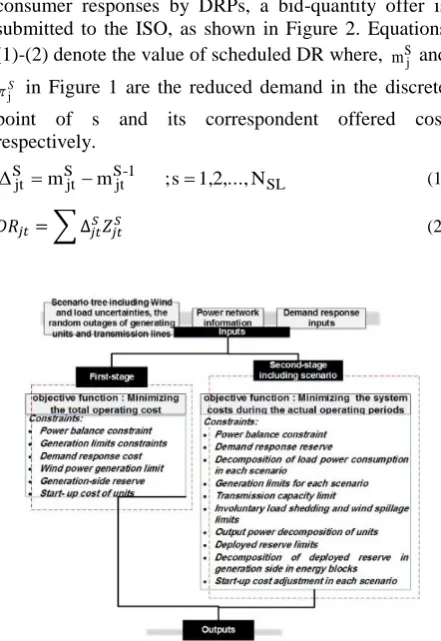
The proposed framework: Figure 1 shows the proposed framework which consists of three main parts. Scenario tree which models uncertainty of wind power, load demand and component failures, system data and DR programs are the main inputs of the framework. Here, the considered problem is modelled as a two stage stochastic program, which minimization of the total operating costs with related constraints are considered at
the first stage. Also, at the first stage, here-and-now decision variables are considered. At the second stage, realization of existing uncertainties are considered and therefore wait-and –see decision variables are considered at this stage. Similar to the first stage, the objective function of the second stage is the expected value of operation cost. Details of the optimization problem (objective function and constraints) are explained in the following sections.
Modelling of uncertainty: Discrete estimations of continuous stochastic processes which are a set of discrete scenarios with correspondent probabilities are used for modelling the uncertainty [19]. In this paper, Monte Carlo method is applied to simulate random outage of generating units and transmission lines [13]. Moreover, wind power uncertainties and forecasted demand error are modelled through generating scenarios. Moreover, computational tractability of stochastic optimization models based on scenarios is related to the number of scenarios, thus using a method for reducing the number of scenarios is essential. Backward reduction method is then used to reduce the number of scenarios [11]. Finally, for determining the scenario tree, the reduced uncertainty scenarios are combined with each other and the complete scenario is determined.
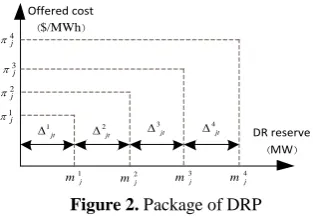
Modelling of DR: Having aggregated retail consumer responses by DRPs, a bid-quantity offer is submitted to the ISO, as shown in Figure 2. Equations (1)-(2) denote the value of scheduled DR where, S
j
m and S
j
in Figure 1 are the reduced demand in the discrete point of s and its correspondent offered cost respectively.
SL 1
-S
jt S
jt S
jt m m ;s 1,2,...,N
Δ (1)
𝐷𝑅𝑗𝑡= ∑ ∆𝑗𝑡𝑆𝑍𝑗𝑡𝑆 (2)
1 jt 2 jt 3 jt 4 jt 1 j m 2 j m 3 j m 4 j m DR reserve ) MW ( 1 j 2 j 3 j 4 j Offered cost ) /MWh $ (
Figure 2. Package of DRP
Reliability Assessment: In stochastic method for reliability evaluation the expected load not served is used as reliability index which can be considered as a constraint [20]. However, this is not very applicable since evaluation of desired value of this index is complicated. The other method is introducing this index in the objective function, as indicated by (3) and (4) [14].
w t
N t N w w j LNS 1 shed jtw 1 L
E (3)
j jt N j
LNS VOLL ELNS
L
j
1 E
Cost (4)
Objective function: Equation (5) represents the objective function, the total operating cost. The expected load not served is considered as a criterion for involuntary load shedding. The first and second lines of (5) represent payment regarding to start-ups, revenue of units, spinning and non-spinning reserves, DR and wind power, respectively. The second stage is included with the probability of
w, which involves the system costs during the actual operating periods. The last line of (5) represents the costs of the second stage. These costs are related to actual costs of start-up, reserves, DR, wind spillage and reliability, respectively. RUit
C ,
D R it
C and
NS R it
C are the costs of up spinning reserve, down spinning reserve and non-spinning reserve of unit i at time t, respectively.
1 1 1
1 1
1
1
1 1 1 1 1
t t G
G Oit G L
W t G G Oit
N N N
SU
t it
t t i
N N
Gitm Gitm i m
N
RU R RD D RNS NS
it it it it it it
i N
W P W PS
jt t t
j
N N N N
A
W itw Gitm Gitwm
W t i i m
Ljt jt
Min EC EC C
P
C R C R C R
CD R P
C r L
1 1 L L j N N C Sw jtw t tw
j j
ELNS
ECD R V S
Cost
(5)Constraints on the first-stage variables: Constraints of the first-stage variables to deal with the modeling of energy trading and the reserve in the electricity market are represented by equations (6)-(16). Power balance is represented by (6). Network constraints are not considered in this stage. Equations (7)-(9) constrain the total power produced by unit and power generation to be scheduled in each block of offered energy and the relationship between them, respectively. Equation (10) represents the cost of scheduled DR before realization of each scenario, where 𝜋𝑗𝑡𝑆 denotes the cost of reserve capacity. Power produced by wind power is constrained by (11). Constraints (12)-(14) represent reserve limits on generation side. Equations (15) and (16) constrain start-up cost of units.
L G N j S jt WPS t N i Sit P L
p 1 1 (6) it i S it it
i u p p u
pmin max (7)
max
0pGitmpGitm (8)
NOit m Gitm S it P p 1 (9) S jt S jt S jt N s jt z CDR SL
1 (10) max min WP t WPS t WPt p p
p (11)
it U it U
it R u
R max
0 (12)
it D it D
it R u
R max
0 (13)
) 1 ( 0 max it NS it NS
it R u
R
(14)
)
( ,1
itSU it it SU
it u u
C (15)
0
SU it
C (16)
Second-stage constraints: The second-stage constraints are the constraints of actual operating of system while uncertainties of wind power generation, system load forecast, forced outage of generating units and system transmission lines are realized.
binary and are 1 if the generating units are healthy and 0 otherwise. Power flow from the line n-r in each scenario is modeled by (19), where the random variable
ltw is related to outage of transmission lines, and where its arrays are binary and are 1 if the transmission lines are healthy and 0 otherwise. The DR reserve provided by DR and its cost in each scenario are represented by (20) and (21) respectively; where Sjt
e
denotes the energy cost of the DR reserve. Equation (22) relates the realized load demand, the realized DR and power consumption in each period and scenario. Equations (23) and (24) represent generation limits for each scenario. Power flow of transmission lines are constrained by (25). Equations (26) and (27) constrain involuntary load shedding and wind spillage at each time and scenario. Equation (28) is introduced to decompose the power produced and allocated operating reserves of generating units, where PitwG is a slack variable. Constraints of deployed reserves are represented by (29)-(31) on generation-side. Also, (32) shows the deployed reserve of demand side. These constraints exist due to the fact that in each scenario of the second stage, value of scheduled reserves must be less than those in the first stage. Equation (33) is similar to (9) and denotes reserve decomposition through energy block using variables
r
Gitwm at each time period. (34) and (35) denote that the reserve blocks are added to the energy blocks, however, down spinning reserve are subtracted from the energy blocks. Thus, the applied reserve cost of each unit at each time period and scenariois
Oit N m Gitwm Gitm r 1 .
, as it was stated in the objective
function.
:( , ) :( , )
:( , )
( )
( , ) 0
G L
G C shed
itw itw jtw jtw
i i n M j j n M
tw r n r
P L L
f n r
(17) :( , ) :( , ) :( , ) ( )( , ) 0
G L
G C shed
itw itw jtw jtw
i i n M j j n M
W P
tw tw tw
r n r
P L L
P S f n r
(18)𝑓𝑡𝑤(𝑛, 𝑟) = 𝜉𝑙𝑡𝑤× 𝐵(𝑛, 𝑟)(𝛿𝑛𝑡𝑤− 𝛿𝑟𝑡𝑤) (19)
SL N s S jtw S jt jtw w dr 1 (20)
SL N s S jtw S jt S jt jtw e wECDR
1
(21)
jtw jtw C
jtw L dr
L (22)
itw i G itw P v
P min (23)
itw i G
itw P v
P max (24)
) , ( ) , ( ) , ( max max r n f r n f r n
f tw
(25) C jtw shed jtw L L 0 (26) WP tw tw P S 0 (27) NS itw D itw U itw S it G
itw p r r r
P (28)
U it itw U
itw R
r
0 (29) D it itw D itw R
r
0 (30) NS it itw NS itw R
r
0 (31) jt jtw DR dr 0 (32)
NOit
m Gitwm D itw NS itw U
itw r r r
r
1
(33)
Gitm Gitwm Gitwm p p
r max (34)
Gitm Gitwm p
r (35)
SU itw
C describes the setting up cost applied to the i-th unit during the real operating and time period of t and scenario of w. CAitw denotes the cost of changes in the setting up program of i-th unit during the time period of t and scenario of w. Constraints (28) to (38) couple electricity market decisions and of real operating of system which is implemented through reserve consumption. SU it SU itw A
itw C C
C (36)
) (itw i,t 1,w
SU it SU
itw v v
C (37)
0
SU itw
C (38)
3. CASE STUDIES
regarding to the hourly system demand is derived from [1]. VOLL is assumed to be 1000 $/MWh. Data related to the DRP, in three discrete points, is presented in Table 1.
To simulate uncertainty of wind power and load forecast error, we assume that the wind power and hourly demand are subject to a normal distribution N(
, 2). Standard deviation () of wind power and load forecasting are assumed 30% and 20%, respectively Three cases are considered for a 4-h scheduling horizon. Case 1: without utilizing DR reserve
Case 2: with participating 5% of consumers Case 3: with participating 10% of consumers
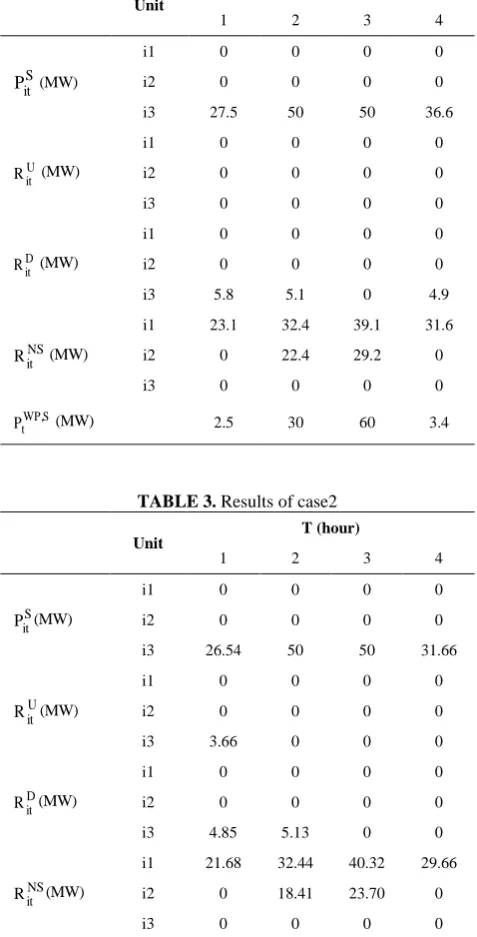
Table 2 shows results for case1. In this case, only thermal units compensate the uncertainty. The first priority of operator for power production is the unit i3. At hour 2, the wind power (3MW) is scheduled more than its forecasted. Moreover, forced outage of unit i3 occurs in some scenarios during actual operation. Thus, the operator compensates the forced outage and the wind power uncertainty by allocating the non-spinning reserves for unit i1 and i2. For compensating outage of transmission lines L2 and L3, unit i3 is scheduled as down spinning reserve. In the cases 2 and 3, 95% and 90% of load is considered as the maximum involuntary load shedding, respectively. Table 3 shows that at hour 2, the operator allocates less non-spinning reserve to unit i2 (18.41 MW) to cover the uncertainties. Since using of DR is economic, the operator schedules 4 MW reserve. At hour 1, the wind power is scheduled which is less than it’s forecasted, the allocated down spinning reserve is equal to 4.85MW. In case 3, 10% of consumers provide system reserve.
Figure 3. Single line diagram of 3-bus system
TABLE 1. DRP offers in 3-bus system
Section 1 2 3
DR reserve 33%of total responses 66% of total responses 100% of total responses
Capacity cost of
reserve ($/MWh) 2.5 3.5 4.5
Energy cost of
reserve ($/MW) 20 28 36
TABLE 2. results of case 1
T(hour) Unit
4 3
2 1
0 0
0 0
i1
S it
P (MW) i2 0 0 0 0
36.6 50
50 27.5 i3
0 0
0 0
i1
U it
R (MW) i2 0 0 0 0
0 0
0 0
i3
0 0
0 0
i1
D it
R (MW) i2 0 0 0 0
4.9 0
5.1 5.8
i3
31.6 39.1
32.4 23.1
i1
NS it
R (MW) i2 0 22.4 29.2 0
0 0
0 0
i3
3.4 60
30 2.5
S WP, t
P (MW)
TABLE 3. Results of case2
T (hour) Unit
4 3
2 1
0 0
0 0
i1
S it
P (MW) i2 0 0 0 0
31.66 50
50 26.54 i3
0 0
0 0
i1
U it
R (MW) i2 0 0 0 0
0 0
0 3.66 i3
0 0
0 0
i1
D it
R (MW) i2 0 0 0 0
0 0
5.13 4.85
i3
29.66 40.32
32.44 21.68
i1
NS it
R (MW) i2 0 18.41 23.70 0
0 0
0 0
i3
8.34 60
30 3.46
S WP, t
P (MW)
2 5.5 4
1.5
jt
DR (MW)
is increased, because uncertainty of wind power makes the operator allocate the reserve to the demand side. Thus in case2 and case3, by increasing the demand-side participation, the operator prefers to schedule the wind power more and therefore all of DRP offers are accepted. In fact, more expensive unit has less role in providing the system reserve by allocating DR. Thus, the total cost is decreased. Table 5 summarizes results of cases 1 to 3. According to Table 5, the total operating cost is significantly decreased by increasing participation of consumers in DR program. Participation of consumers at the amount of 5% and 10% has decreased the total cost by 3.02% and 6.22%, respectively. This is due to the decrease in production of thermal units and allocating reserve to these units. In case2 and case3, cost of the expected load not served is also decreased by increasing participation of DR program. This causes decreasing involuntary load shedding. Therefore, even by increase in the cost of DR, the total cost of system is decreased. Consequently, using DR program not only reduces the total cost, but also increases the system reliability.
TABLE 4. Results of case3
T (hour) Unit
4 3 2
1
0 0 0
0 i1
S it
P (MW) i2 0 0 0 0
34.1 50
50 25.8 i3
0 0 0
0 i1
U it
R (MW) i2 0 0 0 0
0 0 0
0 i3
0 0 0
0 i1
D it
R (MW) i2 0 0 0 0
2.46 0
0.41 4.1
i3
27.6 40.06 32.4
20.1 i1
NS it
R (MW) i2 0 14.41 20.41 0
0 0 0
0 i3
5.9 60
30 4.2
S WP, t
P (MW)
4 11 8
3
jt
DR (MW)
TABLE 5. Costs of 3-bus system
Case 1 Case 2 Case 3
Operation cost )$( 6351.11 6158.91 5955.76
Energy cost )$( 4429.19 4252.38 4069.11
Reserve cost of units )$( 980.55 899.42 789.17
DR cost )$( 0 174.35 367.88
Expected load not served cost )$( 941.37 832.76 729.60
Also, consumers benefit from DR program, because they buy more reliable electrical power and pay less money.
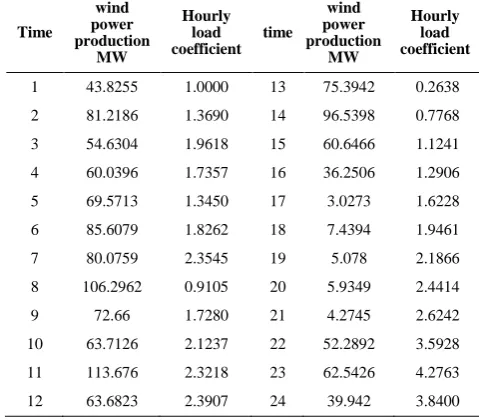
3. 2. MREC Network The second case is the MAZANDARAN regional electric company (MREC network. Single-line diagram of MREC network is shown in Figure 4 consisting of 16 load buses [23-24]. The scheduling horizon is assumed to be 24 hours. Table 6 shows the average demand for the first hour. A 140 MW wind power plant is assumed to be installed at
bus DARYASAR. The expected wind power
productions in each hour are given in Table 7. Also, Table 7 shows the hourly demand coefficients which are used to calculate average hourly demand. There is one DRP at each load bus, which is registered by ISO. Offers of DRPs at each load bus are given in Table 8.
It is assumed that generating units submit 40% and 100% of the highest incremental cost of their energy production to the ISO as the operation cost, up, down-spinning and non-down-spinning reserves and energy, respectively.
TABLE 6. Demand of MREC network for first hour (MW)
Bus Load Bus Load
HASANKIF 8.9 AMOL 98.2
GONBAD 61.9 DARYASAR 37.5
GORGAN 89.8 ROYAN 46.4
MINO DASHT 29.8 ALIABAD 31.5
KORDKUY 53.5 DANYAL 40.4
SARI 34.5 SAVAD KOH 9.5
DEHAK 57.1 BABOL 59.5
KAGHAZ SAZI 38.1 GHAEMSHAHR 62.6
TABLE 7. Forecasted wind power and hourly load coefficient
Time
wind power production
MW
Hourly load coefficient
time wind power production
MW
Hourly load coefficient
1 43.8255 1.0000 13 75.3942 0.2638
2 81.2186 1.3690 14 96.5398 0.7768
3 54.6304 1.9618 15 60.6466 1.1241
4 60.0396 1.7357 16 36.2506 1.2906
5 69.5713 1.3450 17 3.0273 1.6228
6 85.6079 1.8262 18 7.4394 1.9461
7 80.0759 2.3545 19 5.078 2.1866
8 106.2962 0.9105 20 5.9349 2.4414
9 72.66 1.7280 21 4.2745 2.6242
10 63.7126 2.1237 22 52.2892 3.5928
11 113.676 2.3218 23 62.5426 4.2763
TABLE 8. DRP offers for MREC
1 2 3
DR reserve 33%of total responses 66% of total responses 100% of total responses
Capacity cost of
reserve ($/MW) 3 4 5
Energy cost of
reserve ($/MWh) 24 32 40
Available transmission capacity and capacity of units are shown in Figure 4. Also, susceptances of existing transformers of NEKA, NARIVARAN, HASANKIF and ALIABAD are 33, 20, 16.67 and 20 (p.u.), respectively, in the base of 100 MVA. Data for generating units are given in the Table 9. It is assumed that 10% of consumers participate in supplying operating reserve.
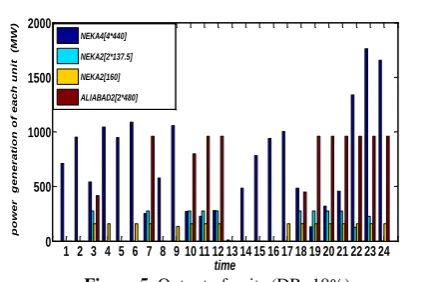
In order to simulate wind power and demand uncertainties, 1000 scenarios were generated. The standard deviation () of the wind power uncertainty and load forecast was assumed 10% for wind and 5% for demand. Then, the number of scenarios was reduced to 5 and 10 for the wind and demand, respectively. Figures (5)- (8) depict scheduled power, down-spinning reserve, up spinning reserve and non-spinning reserve of units in the case which 10% of consumers participate in
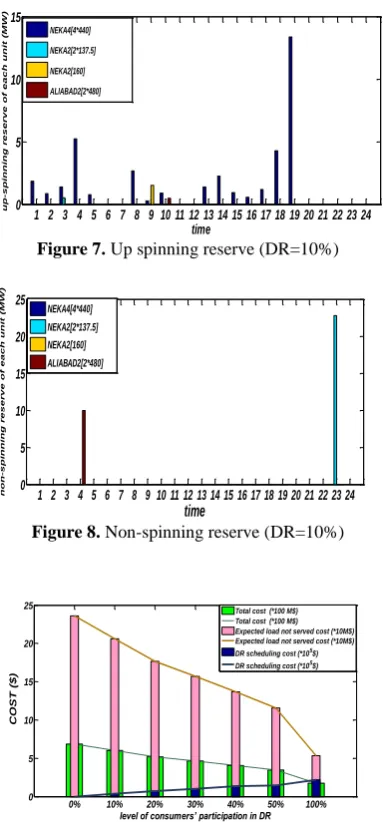
DR. The total energy produced by NEKA4, NEKA2 and ALIABAD2 are obtained equal to 17317, 5363 and 10303 MWh, respectively over the planning period. The total down-spinning reserves for these units are 2973.1, 348.7 and 17.4 MWh, respectively. In addition, the total up-spinning reserves are 37.8, 2.0, and 0.5 MWh, respectively. At hours 1 and 2, only unit 1 of NEKA4 has been scheduled for up-spinning reserve due to its lower operating cost. On the other hand, the unit having higher operating cost of NEKA2 has been scheduled for non-spinning reserve, equal to 22.78 MW. At hour 5, 10 MW has been scheduled for ALIABAD2 as no-spinning reserve. The total non-spinning reserve for NEKA4, NEKA2 and ALIABAD are 78, 22 and 10 MWh, respectively. Figure 9 depicts the sensitivity of consumers’ participation in DR scheduling cost, the cost of expected load not served and total cost of power system. By increasing participation of DR program, the total operating cost is significantly decreased. The cost of expected load not served is decreased. This shows that use of ASDRP reduces the risk of involuntary load shedding. Thus, implementing DR program not only reduces the total operating cost, but also can increase the reliability of system and all the consumers can benefit because less money is paid and also the electricity is used with more reliability.
Figure 4. Single-line diagram of MREC transmission network
TABLE 9. Data for generating units of MREC
Bus NEKA4 NEKA2 NEKA2 ALI ABAD2
Unit Capacity
(MW)
4*440 2*137.5 160 2*480
Generation block (MW)
500/1000
/ 1760 40/80/275
40/80/18
0 320/640/960
Marginal cost ($/MWh)
16.92/16. 98/ 17.02
40.72/40.79 / 40.87
23.35/ 22.73/ 23.09
37.72/37.79/ 37.87
MAX.
Production 4*480 2*137.5 160 2*480
MIN.
Production 4*100 2*10 10 2*10 Figure 5. Output of units (DR=10%)
1 2 3 4 5 6 7 8 9 10 11 12 13 14 15 16 17 18 19 20 21 22 23 24 0
500 1000 1500 2000
p
o
wer
g
en
er
ati
o
n
o
f
eac
h
u
n
it
(M
W
)
time
Figure 6. Down spinning reserve of units (DR=10%)
Figure 7. Up spinning reserve (DR=10%)
Figure 8. Non-spinning reserve (DR=10%)
Figure 9. System costs in terms of consumers’ participation in DR
4. CONCLUSION
A new model was proposed to examine impacts of uncertainties associated to component failures, load
demand and wind power on the generation scheduling in the presence of DR programs. The proposed model determines the optimal schedule of energy and reserve of generation and demand-side, dealing with system reliability by considering simultaneous impact of demand uncertainties and wind power generation following by random outage of generating units and transmission lines in combination with DRP. The considered problem has been solved in the form of a two-stage stochastic optimization problem with both continuous and binary decision variables. Scenarios were generated using Monte Carlo simulation, while normal distribution was used. In order to reduce the number of scenarios backward technique was used. Simulation results show that implementing the ASDRP in power system under uncertainties can improve the system reliability, since by increasing the participation of consumers in DR programs; the cost of ELNS is significantly decreased. It means that with participation of consumers in the ASDRP, the reduction in involuntary load shedding is gained for all consumers. Furthermore, by increasing the level of consumers’ participation and increasing the use of allocated DRP reserve, the cheaper generating units are committed. This leads to decreasing in the operating cost, because utilizing from demand-side leads to decreasing the costs of energy, reserve and involuntary load shedding.
5. REFERENCES
1. Albadi, M.H. and El-Saadany, E., "A summary of demand
response in electricity markets", Electric Power Systems
Research, Vol. 78, No. 11, (2008), 1989-1996.
2. Goel, L., Wu, Q. and Wang, P., "Reliability enhancement of a deregulated power system considering demand response", in Power Engineering Society General Meeting, IEEE., (2006), 6-14.
3. Allan, R., "Reliability evaluation of power systems, Springer Science & Business Media, (2013).
4. Anstine, L., Burke, R., Casey, J., Holgate, R., John, R. and Stewart, H., "Application of probability methods to the determination of spinning reserve requirements for the
pennsylvania-new jersey-maryland interconnection", IEEE
Transactions on Power Apparatus and Systems, Vol. 82, No. 68, (1963), 726-735.
5. Gooi, H., Mendes, D., Bell, K. and Kirschen, D., "Optimal scheduling of spinning reserve", IEEE Transactions on Power Systems, Vol. 14, No. 4, (1999), 1485-1492.
6. Morales, J.M., Conejo, A.J. and Pérez-Ruiz, J., "Economic
valuation of reserves in power systems with high penetration of wind power", IEEE Transactions on Power Systems, Vol. 24, No. 2, (2009), 900-910.
7. Wang, J., Redondo, N.E. and Galiana, F.D., "Demand-side
reserve offers in joint energy/reserve electricity markets", IEEE Transactions on Power Systems, Vol. 18, No. 4, (2003), 1300-1306.
8. Li, Z. and Shahidehpour, M., "Security-constrained unit
commitment for simultaneous clearing of energy and ancillary services markets", IEEE Transactions on Power Systems, Vol. 20, No. 2, (2005), 1079-1088.
1 2 3 4 5 6 7 8 9 10 11 12 13 14 15 16 17 18 19 20 21 22 23 24 0
200 400 600 800 1000
d
o
w
n
-s
p
in
n
in
g
r
e
s
e
r
v
e
o
f
e
a
c
h
u
n
it(M
W
)
time
NEKA4[4*440] NEKA2[2*137.5]
NEKA2[160] ALIABAD2[2*480]
1 2 3 4 5 6 7 8 9 10 11 12 13 14 15 16 17 18 19 20 21 22 23 24 0
5 10 15
u
p
-s
p
in
n
in
g
r
e
s
e
r
v
e
o
f
e
a
c
h
u
n
it
(M
W
)
time NEKA4[4*440]
NEKA2[2*137.5]
NEKA2[160]
ALIABAD2[2*480]
1 2 3 4 5 6 7 8 9 10 11 12 13 14 15 16 17 18 19 20 21 22 23 24 0
5 10 15 20 25
n
o
n
-s
p
i
n
n
i
n
g
r
e
s
e
r
v
e
o
f
e
a
c
h
u
n
i
t
(M
W
)
time
NEKA4[4*440] NEKA2[2*137.5] NEKA2[160] ALIABAD2[2*480]
0% 10% 20% 30% 40% 50% 100%
0 5 10 15 20 25
level of consumers’ participation in DR
C
OS
T
(
$
)
Total cost (*100 M$) Total cost (*100 M$) Expected load not served cost (*10M$) Expected load not served cost (*10M$) DR scheduling cost (*105$)
9. Galiana, F.D., Bouffard, F., Arroyo, J.M. and Restrepo, J.F., "Scheduling and pricing of coupled energy and primary, secondary, and tertiary reserves", Proceedings of the IEEE, Vol. 93, No. 11, (2005), 1970-1983.
10. Haghighat, H., Seifi, H. and Kian, A.R., "Gaming analysis in joint energy and spinning reserve markets", IEEE Transactions on Power Systems, Vol. 22, No. 4, (2007), 2074-2085. 11. Wu, L., Shahidehpour, M. and Li, T., "Stochastic
security-constrained unit commitment", IEEE Transactions on Power
Systems, Vol. 22, No. 2, (2007), 800-811.
12. Wu, L., Shahidehpour, M. and Li, T., "Cost of reliability
analysis based on stochastic unit commitment", IEEE
Transactions on Power Systems, Vol. 23, No. 3, (2008), 1364-1374.
13. Parvania, M. and Fotuhi-Firuzabad, M., "Demand response scheduling by stochastic scuc", IEEE Transactions on Smart Grid, Vol. 1, No. 1, (2010), 89-98.
14. Parvania, M., Fotuhi-Firuzabad, M., Aminifar, F. and Abiri-Jahromi, A., "Reliability-constrained unit commitment using stochastic mixed-integer programming", in Probabilistic Methods Applied to Power Systems (PMAPS), IEEE 11th International Conference on, IEEE., (2010), 200-205.
15. Amjady, N., Dehghan, S., Attarha, A. and Conejo, A.J., "Adaptive robust network-constrained ac unit commitment", IEEE Transactions on Power Systems, Vol. 32, No. 1, (2017), 672-683.
16. Fernández-Blanco, R., Dvorkin, Y. and Ortega-Vazquez, M.A., "Probabilistic security-constrained unit commitment with generation and transmission contingencies", IEEE Transactions on Power Systems, Vol. 32, No. 1, (2017), 228-239.
17. Shao, C., Wang, X., Shahidehpour, M., Wang, X. and Wang, B., "Security-constrained unit commitment with flexible uncertainty
set for variable wind power", IEEE Transactions on
Sustainable Energy, Vol. 8, No. 3, (2017), 1237-1246.
18. Tejada-Arango, D.A., Sanchez-Martin, P. and Ramos, A., "Security constrained unit commitment using line outage distribution factors", IEEE Transactions on Power Systems, (2017).
19. Conejo, A.J., Carrión, M. and Morales, J.M., "Decision making under uncertainty in electricity markets, Springer, Vol. 1, (2010).
20. Aminifar, F., Fotuhi-Firuzabad, M. and Shahidehpour, M., "Unit commitment with probabilistic spinning reserve and interruptible
load considerations", IEEE Transactions on Power Systems,
Vol. 24, No. 1, (2009), 388-397.
Stochastic Unit Commitment in the Presence of Demand Response Program
under
Uncertainties
J. Valinejada, Z. Oladib, T. Barforoushia, M. Parvaniac
a Department of Electrical and Computer Engineering, Babol Noshirvani University of Technology, Babol, Iran b Mazandaran University of Science and Technology, Babol, Iran
c Department of Electrical and Computer Engineering, University of California Davis, Davis, California
P A P E R I N F O
Paper history:
Received 03 August 2016
Received in revised form 06 May 2017 Accepted 07 July 2017
Keywords:
Ancillary Services Demand Response Stochastic Optimization Uncertainty
Wind Power
ديكچ ه
تیعطق مدع تارثا هلاقم نیا رد و راب ینیب شیپ یاطخ ،لاقتنا طوطخ و دیلوت یاهدحاو یفداصت جورخ ریظن فلتخم یاه
همانرب روضح رد یداب ناوت دیلوت ( اضاقت ییوگخساپ یاه
DR
نامز رب ) یم هعلاطم دیلوت یدنب هب رظن دروم هلئسم .دوش
هلحرمود یفداصت هلئسم کی تروص ( دیلوت یاهدحاو نتفرگ رارق رادمرد یا
UC
یم لدم ) دوش یاهباوج نآ لح اب هک
هنیهب
UC
و
DR
یم نییعت همانرب ،دیلوت یاهدحاو یاهتیدودحم .دنوش
DR
نا هکبش دودح و یم هتفرگ رظن رد لاقت
.دنوش
همانرب ،هلاقم نیا رد
DR
یم هتفرگ رظنرد هریخذ یبناج تامدخ تروصب مهارف طسوت هک دوش
یم هئارا نآ ناگدننک هب .ددرگ
هدایپ روظنم ( ولراک تنوم یزاس هیبش زا ،اهتیعطق مدع یزاس
MC
یم هدافتسا ) هدنیامن هک ییاهویرانس ،روظنم نیا هب .دوش
یعطق مدع یم دیلوت ولراک تنوم یزاس هیبش ساسا رب دنتسه اهت هدافتسا یعطقریغ یاهرتماراپ لامرن عیزوت زا نآ رد هک دنوش
یم یم هدافتسا ورسپ کینکت زا ویرانس شهاک یارب ، .دوش تخرد اضاقت و یداب ناوت یاهویرانس بیکرت اب سپس .دوش
یم لیکشت ویرانس یفداصت یزاس هنیهب هلئسم .ددرگ
همانرب هلئسم کی تروصب ( هتخیمآ حیحص یطخ یزیر
MILP
لدم )
یم یم هتفرگ راکب نومزآ متسیس ود یور یداهنشیپ لدم .دوش یم ناشن یزاس هیبش جیاتن .دوش
هک دهد
DR
دوبهب نمض
هرهب لک هنیزه ،متسیس نانیمطا تسلیاق یم شهاک تیعطق مدع طیارش تحت ار یرادرب
.دهد