AN APPROACH FOR THE ESTIMATION OF AGGREGATE
POTENTIAL TELECOMMUTING DEMAND
A. R. Mamdoohi
*
Faculty of Civil & Environmental Engineering, Tarbiat Modares University, Tehran, Iran Tel: (98) 21 82884925, Fax: (98) 21 88367945
A. Ardeshiri
Transportation Eng., Civil Engineering, Sharif University of Technology, Tehran, Iran, Tel: (98) 21 22091840, Fax: (98) 21 44663320
(Received: February 13, 2010 – Accepted in Revised Form: October 20, 2011)
doi: 10.5829/idosi.ije.2011.24.04a.02
Abstract
Development of technology has made possible the invention of innovative and modern methods to partially solve the problems caused by traffic congestion through decreasing the need for physical transportation; one such method being telecommuting. Although, research has been conducted to model employees' and employers’ attitude towards telecommuting at micro levels, few predictions have been reported regarding its aggregate demand at the macro level of a city, generally because of the complexity and multi-dimensionality of the subject. In this paper, an approach for the estimation of potential aggregate telecommuting demand is proposed to partly fill the gap in the literature; and applied for the city of Tehran, Iran, using a 3-level generalization process to compensate for the incompleteness of the unattainable vast and expensive data. In the first level of the proposed approach, the matrix of average potential telecommuting demand for 36 job categories, defined by 6 different organizational positions and 6 different organizational units, is derived from a 670-sized sample. In the second level, the data of 14 percent of the government employees are collected despite the effort of aiming for the 100 percent and hence, in the third level, the geographic distribution of all government employees with telecommuting potential is determined. Results of this research regarding potential telecommuting demand for the city of Tehran show that 53,898 out of 148,551 government employees (about 36 percent) are able to participate in telecommuting programs on a daily basis, removing 53,898 peak hour work trips on a daily basis which is equivalent to 269,490 employees quitting their commute trip to work one day per week. Although based on rather strong assumptions, forced by the limitation of data, the approach is implemented for Tehran.
Keywords telecommuting, aggregate demand, transportation engineering.
ﮏﻴﻓﺍﺮﺗ ﺝﻭﺍﺖﻋﺎﺳﺭﺩﻱﺭﺎﮐ ﺮﻔﺳ ﺩﺍﺪﻌﺗ ﻦﻴﻤﻫ ﻑﺬﺣ ﺚﻋﺎﺑﻪﮐ،ﺪﻨﻨﮐ ﺖﮐﺮﺷ ﻱﺭﺎﮐﺭﻭﺩﻪﻣﺎﻧﺮﺑ ﺭﺩﻪﻧﺍﺯﻭﺭﺭﻮﻃ ﻪﺑﺪﻨﻧﺍﻮﺗﻲﻣ (ﺪﺻﺭﺩ ۳۶ ﺩﻭﺪﺣ) ﺮﻔﻧ۵۳۸۹۸ ،ﻲﻣﻮﻤﻋﻭ ﻲﺘﻟﻭﺩ ﺶﺨﺑﺪﻨﻣﺭﺎﮐ۱۴۸۵۵۱ ﻦﻴﺑﺯﺍ ﻪﮐﺪﻫﺩﻲﻣ ﻥﺎﺸﻧ ﺞﻳﺎﺘﻧ .ﺖﻓﺮﮔﺕﺭﻮﺻﻥﺍﺮﻬﺗﺮﻬﺷﻥﻼﮐﻱﺎﺿﺎﻘﺗﺯﺍﻱﺩﺭﻭﺁﺮﺑ،ﻪﻟﺎﻘﻣﻦﻳﺍﻱﺩﺎﻬﻨﺸﻴﭘﺩﺮﮑﻳﻭﺭﺯﺍﻩﺩﺎﻔﺘﺳﺍﺎﺑﻥﺁﺱﺎﺳﺍ ﺮﺑﻪﮐﺪﺷﻦﻴﻴﻌﺗﻱﺭﺎﮐﺭﻭﺩﻞﻴﺴﻧﺎﺘﭘﻱﺍﺭﺍﺩﻥﺍﺪﻨﻣﺭﺎﮐﻡﺎﻤﺗﻲﻳﺎﻴﻓﺍﺮﻐﺟﻊﻳﺯﻮﺗﻡﻮﺳﺢﻄﺳﺭﺩ،ﺎﻫﻩﺩﺍﺩﻦﻳﺍﺪﺻﺭﺩ۱۰۰ ﻱﺭﻭﺁﺩﺮﮔﻥﺎﮑﻣﺍﻡﺪﻋﻪﺑﻪﺟﻮﺗﺎﺑ .ﺪﺷﻱﺭﻭﺁﺩﺮﮔﻥﺍﺮﻬﺗﺮﻬﺷﻲﻳﺍﺮﺟﺍﻱﺎﻫﻩﺎﮕﺘﺳﺩﻥﺍﺪﻨﻣﺭﺎﮐﺯﺍﺪﺻﺭﺩ ۱۴ﻱﺎﻫﻩﺩﺍﺩ ،ﻡﻭﺩﺢﻄﺳﺭﺩ .ﺩﻮﺷﻲﻣﺩﺭﻭﺁﺮﺑﻲﻳﺎﺗ ۶۷۰ﻪﻧﻮﻤﻧ ﺎﺑﻱﺮﻴﮔﺭﺎﻣﺁﮏﻳﺞﻳﺎﺘﻧ ﺱﺎﺳﺍﺮﺑ (ﻲﻧﺎﻣﺯﺎﺳﺖﺴﭘ ۶ﻭﻲﻧﺎﻣﺯﺎﺳ ﺪﺣﺍﻭ ۶ ﮏﻴﮑﻔﺗﻪﺑ) ﻞﻐﺷ ﻪﺘﺳﺩ۳۶ ﻱﺍﺮﺑ ﻱﺭﺎﮐﺭﻭﺩ ﻱﺎﺿﺎﻘﺗ ﻦﻴﮕﻧﺎﻴﻣ ﺲﻳﺮﺗﺎﻣ،ﻝﻭﺍ ﺢﻄﺳ ﺭﺩ .ﺖﺳﺍ ﻲﺑﺎﻳﺖﺳﺩ ﻞﺑﺎﻗﺕﺎﻋﻼﻃﺍﻭﺎﻫﻩﺩﺍﺩ ﺭﺩﺩﻮﺟﻮﻣﺺﻘﻧ ﻥﺍﺮﺒﺟﺖﻬﺟﻱﺍﻪﻠﺣﺮﻣ ﻪﺳﻢﻴﻤﻌﺗﺪﻨﻳﺁﺮﻓ ﮏﻳﻞﻣﺎﺷ ﻪﮐﺩﻮﺷﻲﻣﻪﺘﺴﺑ ﺭﺎﮐﻪﺑﻭﺩﺎﻬﻨﺸﻴﭘﻥﺍﺮﻬﺗﺮﻬﺷﺢﻄﺳﺭﺩﻱﺭﺎﮐﺭﻭﺩﻥﻼﮐﻱﺎﺿﺎﻘﺗﺩﺭﻭﺁﺮﺑﻱﺍﺮﺑﻱﺩﺮﮑﻳﻭﺭ،ﺩﻮﺒﻤﮐﻦﻳﺍﻊﻓﺭﻱﺍﺮﺑﻪﻴﻟﻭﺍ ﺪﻨﭼﺮﻫﻲﺷﻼﺗﺭﺩﻪﻟﺎﻘﻣﻦﻳﺍ ﺭﺩ .ﺖﺳﺍﻪﺘﻓﺮﮔﺕﺭﻮﺻ ﻉﻮﺿﻮﻣ ﻱﺎﻫﻲﮔﺪﻴﭽﻴﭘﻭﻥﺩﻮﺑﻲﻬﺟﻭﺪﻨﭼﺮﻃﺎﺧﻪﺑﹰﺎﻣﻮﻤﻋ ،ﺮﻬﺷﮏﻳﺢﻄﺳﺭﺩﻥﺁﻥﻼﮐﻱﺎﺿﺎﻘﺗﻱﺍﺮﺑﻲﮐﺪﻧﺍﻱﺎﻫﻲﻨﻴﺑﺶﻴﭘﻲﻟﻭ،ﺖﺳﺍﻩﺪﺷﻡﺎﺠﻧﺍﺩﺮﺧ ﺢﻄﺳﺭﺩﻱﺭﺎﮐﺭﻭﺩ ﻪﺑﺖﺒﺴﻧ ﻥﺎﻳﺎﻣﺮﻓﺭﺎﮐ ﻭﻥﺍﺪﻨﻣﺭﺎﮐﺭﺎﺘﻓﺭ ﻱﺯﺎﺳﻝﺪﻣﻱﺍﺮﺑ ﻲﻳﺎﻫﺵﻼﺗﻪﭼﺮﮔﺍ .ﺖﺳﺍﻩﺩﺮﮐﺮﻳﺬﭘﻥﺎﮑﻣﺍ ﻲﮑﻳﺰﻴﻓ ﺮﻔﺳ ﻪﺑﺯﺎﻴﻧﺶﻫﺎﮐﻖﻳﺮﻃﺯﺍ ﮏﻴﻓﺍﺮﺗﻞﻀﻌﻣﻞﺣ ﻱﺍﺮﺑ (ﻱﺭﺎﮐﺭﻭﺩﺪﻨﻧﺎﻣ) ﺍﺭ ﻲﻨﻳﻮﻧﻱﺎﻫﺵﻭﺭﻱﺭﻭﺎﻨﻓﻪﻌﺳﻮﺗ
ﻩﺪﻴﮑﭼ
1. INTRODUCTION
The development of cities, the growth in population and the fact that the number of private autos is increasing every day, result in an increase in traffic congestion that causes a waste in time and energy. Alleviation of traffic congestion
through planning and management of
transportation is one of the main concerns of transportation and urban researchers and planners. In large cities, particular effort has been, and still is being, made to limit the use of private autos as a main remedy and encourage the use of public transportation to alleviate traffic problem.
Development of technology has made possible the invention of innovative and modern methods to solve, at least partially, the problems caused by
traffic congestion, through elimination or
decreasing the need for physical and conventional transportation. One such method introduced about 30 years ago, gaining more inertia due to developing ICT (information and communication technologies) is telecommuting. From the very beginning of the advent of formal telecommuting in America, as early as 1976, different predictions
were reported regarding its demand partly
unrealistic, divergent or inconsistent, generally
because of the complexity and
multi-dimensionality of the subject [1] (social, economic, cultural and psychological, to name a few) and also due to optimistic and not enough detailed procedures and computations [2].
Telecommuting as defined by Niles, is sending
the work to the workers, instead of sending the workers to work; the partial or total substitution by telecommunications technology, possibly with the aid of computers, for the commute to and from
work [3]. Telecommuting can be implemented in
two general ways, depending on the place substituting the conventional work place or office, as home-based and center-based telecommuting. Telecenters, as places specially and specifically designed for this purpose, hold (among others) the advantage that home and work issues are kept apart so that the atmosphere is that of formal work, unlike home-based, which mainly suffers from this
issue. Another major issue is the amount of telecommuting (generally reported in number of days per week) that different employees can
actually adopt, regarding different factors,
particularly their job and organizational
characteristics. This paper is based on the results of the first official research effort to estimate potential telecommuting demand at the aggregate level of a metropolitan area, here Tehran, the capital city of Iran [4].
Previous researches [5, 6] attempting to model telecommuting suitability was conducted on a much smaller sample (245 size) to illustrate mainly the implementability of the concept of abstract job approach to model telecommuting feasible and suitable demand to identify significant job tasks. Multi-stage heuristic techniques to overcome tradeoffs between attributes have lead to reliable results [7]. Although, research has been conducted to model employees' and employers’ attitude toward telecommuting at micro levels, there is a gap for scientific research to estimate the aggregate potential demand for telecommuting at macro levels, especially in a developing country. This paper, aiming to fill this gap, estimates feasible telecommuting demand using a heuristic approach at the macro level of the city of Tehran. After reviewing the literature in the field, the process of data gathering and survey administration will be discussed, and a heuristic approach will be presented to generalize the results obtained from the sample to population levels 1 and 2 (because of the lack of full cooperation of the governmental organizations) by the use of the heuristic method (three-level generalization process). The paper ends with the conclusions and suggestions for further research.
2. LITERATURE SURVEY
Although telecommuting is not yet formally practiced in Iran, and there are not many companies that have adopted telecommuting yet, it has been brought to notice, particularly due to the traffic congestion problem of Tehran and its .ﺪﻧﺭﺍﺩﺍﺭﻪﺘﻔﻫﺭﺩﺯﻭﺭﮏﻳﻱﺭﺎﮐﺭﻭﺩﺖﻴﻠﺑﺎﻗﺪﻨﻣﺭﺎﮐ۲۶۹۴۹۰
related heavy transportation costs. There are different estimations of telecommuters around the world, partly because there is not a standard definition of telecommuting [8].
In an effort to develop a methodology that combines academic and practitioner experiences within a theoretical framework that captures consumers’ price responsiveness to diverse transportation options by embracing the most relevant trade-offs faced under income, modal price and availability constraints, Concas and Winters [9] evaluated some related case studies. In the case of the AT&T Telework Program, which initiated in 1992 to encourage its managers to work from home, it was observed that beginning with modest forecast predictions of about 10 percent in 1992; by early 2000, the program had grown to an extent where nearly 56 percent of its managers telecommuted at least once a month while 27 percent telecommuted at least once a week. In their evaluation of the AT&T Telework Program, they noticed that the fact-sheet of the AT&T annual survey of its employees on telework indicated that in 2000, AT&T's employee telework program resulted in 56 percent of participants teleworking at least one day per month.
In a survey [10] of the City of Tucson, Arizona, due to and emphasizing the notable achievement and the fact that it ranks third in the United States on the 2006 Digital Cities Survey (which examines
how city governments are using digital
technologies to better serve their citizens and streamline operations), it is aimed to use emerging technologies to communicate with the residents and businesses of Tucson. To build upon this
achievement, the City is researching
methodologies to increase the affordability and availability of connectivity services for residences and small businesses. Based on the results of this survey, with the sample size of 249, it is concluded
that nearly one-half of businesses allow
telecommuting, and another three percent indicate that they were likely to allow telecommuting within the next two years.
In an attempt to analyze the reduction in overestimation in forecasting telecommuting as a TDM Policy, Tal [11] posits that overestimates are virtually inevitable in forecasting the effect of new policies that aim to change travel behavior, but these biases eventually decline over time. He
observes that 1- the sources of overestimated forecast are the prediction tools used, and the ways in which modelers use these tools and 2- the sources of the reduction in overestimation are the changes made to the modeling tools results from knowledge and data gained over time.
In a research aiming to establisha formal
telework/telecommuting program for North
Carolina State employees with the goal to improve the economy and efficiency of State government operations, Campbell [12] conducted a survey to determine current agency use of working-from-home positions and a corresponding review of research on the use of telecommuting. Based on survey results, state agencies employed telework for only 2.2 percent of positions (726 out of 32,947), and the State could receive $23,297,416 in benefits from a telework/ telecommuting program, involving 5 percent of eligible state employees. The actual benefit to the State depends on the number of employees participating in the program. According to the Office of State Personnel, there are 85,288 state employees (excluding all exempt positions within the University system) who would potentially be telecommuters. The amount of benefits gained depends on the number of employees participating and the number of days each week the employees telecommute. It has been calculated for 1 to 5 percentages of total employees.
large amount of self-employed teleworkers, professionals who use the Internet to keep in touch with customers or acquire new ones, rather than by
telecottages (which, however, are several
hundreds). In Italy, where telework concerns only a minority - a bit less than 250,000 teleworkers -, and it is hard to find original examples and best practices, a new original way now seems to be opening up: the public sector is dragging the private [13].
In a case study of telework in Italian public administration surveyed in Perugia by Patrizio Di
Nicola & Annamaria Vallarelli, 279 valid
questionnaires were collected representing the complete staff as for age and length of service. They believe since teleworking is not suitable for everybody, it should be voluntary and the choice of working far from the office should be eventually reversible. Therefore, there are people who would like to try it, but cannot because of the kind of work they do (more than 30 percent). On the other side, there are some others who technically speaking could telework but do not intend to leave their work environment, clearly dear to them (near
27 percent). Therefore against a theoretic
willingness to telework expressed by more than 40 percent of the interviewees, the ones who can and at the same time want to telework decrease to a bit little less than 12 percent of the persons questioned [13].
3. DATA COLLECTION AND SURVEY ADMINISTRATION
Since data collection at the level of a city (particularly in a developing country) confronts many barriers and obstacles, a good deal of effort was made, and at the same time, some assumptions
were needed to make possible this estimation with acceptable error level. A lack of complete and impeccable cooperation of organizations lead to the gathering of the data at three levels, instead of the standard and conventional two levels (sample and population) normally used. Hence, data gathering and survey administration became an even more important section of the research since one objective of the research was to implement the proposed approach and estimate the aggregate feasible demand for the city of Tehran with as much accuracy as possible, regarding the circumstances. Thus, in the first level, data of 670 government employees in Tehran was gathered through an in-person interview to brief the respondents and complete the questionnaires comprising their job, organizational, personal,
work trip characteristics and telecommuting
feasibility.
The second level of information contains employees' job and organizational characteristics needed to estimate telecommuting demand. It was hoped and so planned to cover the whole statistical population, however of all the ministries with whom correspondence were made, about 50 percent did not reply at all. For these missing data, further correspondence was made with the ''Management and Planning Organization'' the organization responsible for the organizational chart of the government sector. From among these, another 30 percent was collected. Eventually
21,284 records were obtained which is
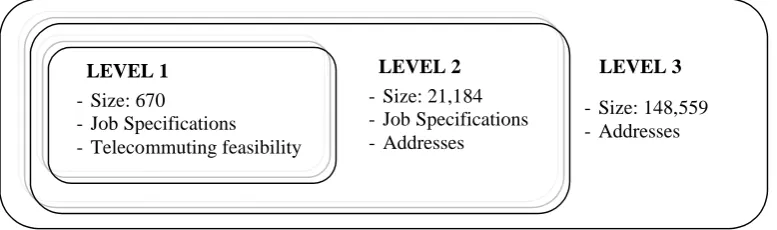
approximately a 10 percent sample of the desired statistical population. Finally, the third level of information includes all the government employees, but with less detail: only the addresses of these organizations. Figure 1 depicts the relationship between these three levels and their main characteristics.
Figure 1.The three levels of data gathered in the research
LEVEL 1
- Size: 670
- Job Specifications - Telecommuting feasibility
LEVEL 2
- Size: 21,184 - Job Specifications - Addresses
LEVEL 3
Job and organizational characteristics and data available at large scale for different jobs according to the ''Management and Planning Organization'' of Iran are: 1- organizational position which shows the position of the employee and its level in the
organization (denoted here by the superscript p),
2-organizational unit or office type which is a smaller section of an organization responsible for some homogeneous tasks fulfilling partly the overall aim of the organization (denoted here by
the superscript u), and 3- job category, a set of job
classes holding similar tasks, education and
experience (denoted by the superscript c). The
third element (c) proved to be insignificant using
correlation analysis and was thus eliminated from the models. Tables 1 and 2 show the definition and
description of the two significant factors,
distinguishing employees' job characteristics,
namely organizational positions and units,
respectively.
No. Organizational
position Description
1 Junior employee High school graduate or university degree below bachelors
2 Senior
employee
At least undergraduate education with usually less than 10 years experience
3 Very senior
employee
At least undergraduate education with at least than 10 years experience (usually)
4 Lower manager Directly responsible for employees not holding a management degree
(also referred to as supervisor)
5 Middle manager responsible for lower managers and (indirectly for) their employees
6 Other* Any position except for the above
*Due to the very low frequency of the other organizational positions, they were aggregated in this category
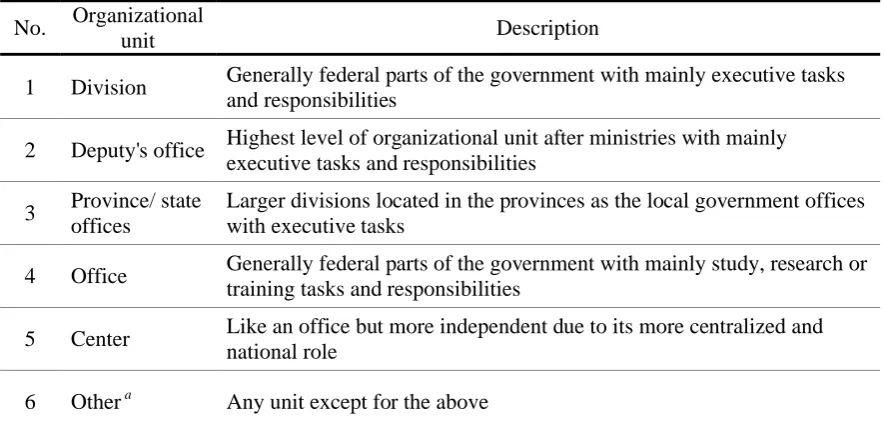
No. Organizational
unit Description
1 Division Generally federal parts of the government with mainly executive tasks
and responsibilities
2 Deputy's office Highest level of organizational unit after ministries with mainly
executive tasks and responsibilities
3 Province/ state
offices
Larger divisions located in the provinces as the local government offices with executive tasks
4 Office Generally federal parts of the government with mainly study, research or
training tasks and responsibilities
5 Center Like an office but more independent due to its more centralized and
national role
6 Othera Any unit except for the above
aDue to the very low frequency of the other organizational units, they were aggregated in this category
TABLE 1.Organizational positions and their description as used in this study
4. METHODOLOGY
Since there are 3 levels of data with different data and variable contents available, and the objective is to ultimately estimate potential telecommuting demand at level 3 (Tehran city), the following is proposed.
Pp U
u
u p u p
F
E
DTC
1 1
1 , , 1 , , 1
(1)
Pp U
u
u p u p
F
E
DTC
1 1
1 , , 2 , , 2
(2)
Pp U
u
u p u p
F
E
DTC
1 1
1 , , 3 , , 3
(3)
Where:
DTC1: demand for telecommuting at level 1;
DTC2: demand for telecommuting at level 2;
DTC3: demand for telecommuting at level 3;
E p,u,1: number of employees working in
position pand unit uat level 1;
E p,u,2: number of employees working in
position pand unit uat level 2;
E p,u,3: number of employees working in
position pand unit uat level 3, and
F p,u,1: feasible telecommuting demand for
employees working in position pand
unituat level 1 (days per week).
The two job characteristics found significant in
telecommuting demand are: organizational
positions and organizational units denoted by
superscripts p and u, respectively. Each of these
factors takes six different values or sub-categories as indicated in Tables 1 and 2.
Telecommuting demand at all levels is
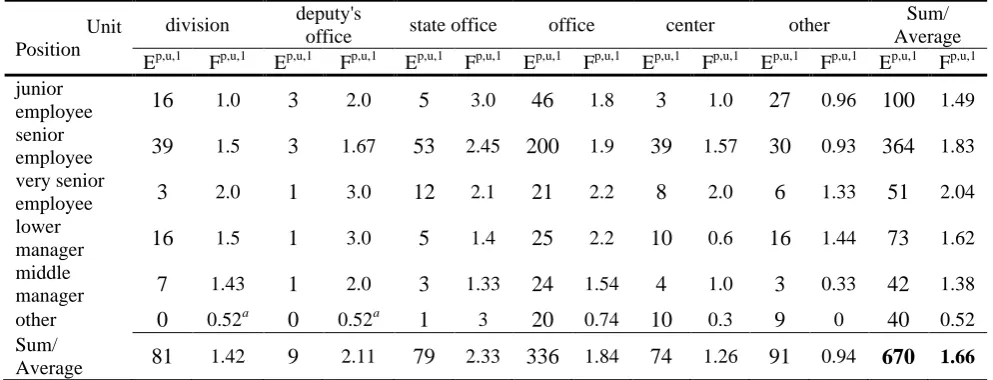
calculated as the summation of the product of its two components: number of employees in each class and telecommuting feasibility per each class of employees. Feasibility of telecommuting for
each employee class (with specific job
characteristics) was solely surveyed at level 1 by questioning their managers who are aware of their job tasks. Table 3 shows the variety of 670 employees at level 1 as a 6x6 matrix in different
job categories including their average
telecommuting feasibility. For example, the
organizational position ‘senior employee’ in the
organizational unit ‘office’ has 200 frequencies in
which the average estimate or judgment of their managers leads to 1.91 days of telecommuting per week.
As shown in Equations (1) to (3), this matrix (telecommuting feasible demand by organization) is assumed to hold for all levels, and is thus also used at levels 2 and 3. Level 2 which was aimed to collect job specifications for the whole employees working in Tehran’s governmental organizations, prepared the information about 21,184 people as shown in Table 4. To estimate telecommuting
Unit Position
division deputy's
office state office office center other
Sum/ Average
Ep,u,1 Fp,u,1 Ep,u,1 Fp,u,1 Ep,u,1 Fp,u,1 Ep,u,1 Fp,u,1 Ep,u,1 Fp,u,1 Ep,u,1 Fp,u,1 Ep,u,1 Fp,u,1
junior
employee 16 1.0 3 2.0 5 3.0 46 1.8 3 1.0 27 0.96 100 1.49
senior
employee 39 1.5 3 1.67 53 2.45 200 1.9 39 1.57 30 0.93 364 1.83
very senior
employee 3 2.0 1 3.0 12 2.1 21 2.2 8 2.0 6 1.33 51 2.04
lower
manager 16 1.5 1 3.0 5 1.4 25 2.2 10 0.6 16 1.44 73 1.62
middle
manager 7 1.43 1 2.0 3 1.33 24 1.54 4 1.0 3 0.33 42 1.38
other 0 0.52a 0 0.52a 1 3 20 0.74 10 0.3 9 0 40 0.52
Sum/
Average 81 1.42 9 2.11 79 2.33 336 1.84 74 1.26 91 0.94 670 1.66
a
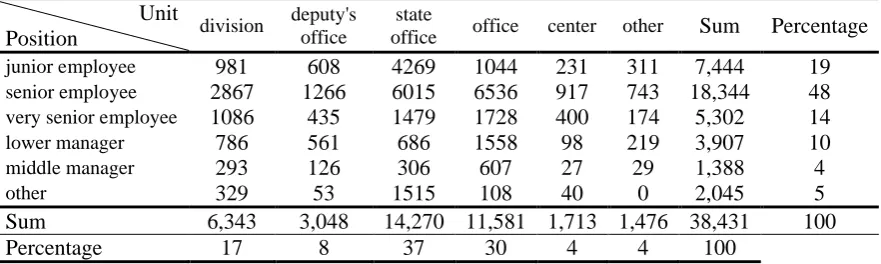
adoption at this level, corresponding elements in Table 1 and Table 2 were multiplied and added as in Equation (2). A total of 38,431 days per week of telecommuting is estimated to be suitable at this level (Table 5).
For the city of Tehran (level 3), the estimation process is more complicated; since not all
ministries were able to have full cooperation in data gathering stage. It is assumed that the job distribution at level 2 holds for the city (Table 6). This generalization of the matrix E is based on the 21,184 pieces of data gathered at level 2 and used for the 148,559 population (almost 14 percent sample size) of Tehran government employees.
Unit
Position division
deputy's office
state
office office center other Sum Percentage
junior employee 981 304 1423 577 231 324 3,840 18
senior employee 1899 758 2455 3422 584 799 9,917 47
very senior employee 543 145 711 789 200 131 2,519 12
lower manager 524 187 490 708 163 152 2,224 10
middle manager 205 63 230 394 27 88 1,007 5
other 633 101 505 146 134 158 1,677 8
Sum 4,785 1,588 5,814 6,036 1,339 1,652 21,184 100
Percentage 23 7 27 28 6 8 100
Unit
Position division
deputy's office
state
office office center other Sum Percentage
junior employee 981 608 4269 1044 231 311 7,444 19
senior employee 2867 1266 6015 6536 917 743 18,344 48
very senior employee 1086 435 1479 1728 400 174 5,302 14
lower manager 786 561 686 1558 98 219 3,907 10
middle manager 293 126 306 607 27 29 1,388 4
other 329 53 1515 108 40 0 2,045 5
Sum 6,343 3,048 14,270 11,581 1,713 1,476 38,431 100
Percentage 17 8 37 30 4 4 100
Unit
Position division
deputy's office
state
office office center other Sum
junior employee 4.6 1.4 6.7 2.7 1.1 1.5 18.1
senior employee 9.0 3.6 11.6 16.2 2.8 3.8 46.8
very senior employee 2.6 0.7 3.4 3.7 0.9 0.6 11.9
lower manager 2.5 0.9 2.3 3.3 0.8 0.7 10.5
middle manager 1.0 0.3 1.1 1.9 0.1 0.4 4.8
other 3.0 0.5 2.4 0.7 0.6 0.7 7.9
Sum 22.6 7.4 27.4 28.5 6.3 7.8 100
TABLE 4. Job frequency distribution at level 2 (Ep,u,1)
TABLE 5.Telecommuting estimation at level 2 based on job characteristics
5. APPLYING THE MODEL FOR THE CITY OF TEHRAN
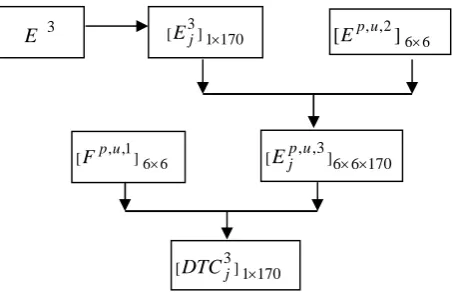
Predicting aggregate telecommuting demand at the level of a city is a main objective of urban and transportation policy makers and planners and the concern of this paper. The schematic approach to calculate the aggregate telecommuting demand and its constituent stages are depicted in the flow chart presented in Figure 2.
Figure 2.Stages in the approach to calculate aggregate telecommuting demand
According to its Comprehensive Transportation and Traffic Studies [14], Tehran is divided into 560 traffic zones in its transportation master plan.
Adding the subscript j denoting the traffic
analysis zone (TAZ) of the current conventional work place, Equation (3) can be transformed into Equation (4) at the first stage with a partial difference. Because of the 5 workdays in a week, the estimation should be divided by 5 in order to stabilize its minimum traffic impacts in the network. Thus, the process which was used in level 2 resulting in Table 5 is also utilized here for level 3.
170 ,..., 1 5
/
1 1
1 , , 3 , ,
3
j F
E DTC
P
p U
u
u p u p j
j (4)
In which,
DTCj
3
: demand for telecommuting at level
3 potential for TAZ j of
conventional office, and
E j
p,u,3
: number of employees working in
TAZ j, position pand unit uat level 3.
Searching for addresses of the current
conventional offices at level 3 resulted in 170 zones (out of the 560 zones of Tehran), where government organizations are located. For each of these 170 zones containing 148,559 employees, a job frequency distribution matrix was estimated similar to Table 4 of level 2 by exploiting job
distribution in Table 6 to have an estimate of Ej
p,u,3 . Equation (4) can now be applied to estimate current telecommuting potential demand in each
zone (DTCj
3 ).
6. AGGREGATE POTENTIAL TELECOMMUTING DEMAND MODEL
RESULTS
Results of this research regarding potential telecommuting demand for the city of Tehran showed that 53,898 out of 148,551 government
employees (about 36 percent) are able to
participate in telecommuting program on a daily basis, eliminating 53,898 peak hour work trips. The geographic distribution by zone is shown in Table 7. Quiet expectedly, there is a noticeable correlation between a zone’s occupation level and telecommuting demand.
7. CONCLUSION
In this paper, an approach for the estimation of potential telecommuting demand was proposed and implemented for Tehran, Iran using a 3-level generalization process to compensate for the incomplete data. In the first level, the matrix of average telecommuting feasibility for 36 job categories defined for 6 different organizational positions and 6 different organizational units was derived from a 670-sized sample and applied in both the second and third levels. In the second level, despite the effort to collect the data for the whole government employees, the data of only 14 percent of the population (21,184 employees) was collected. In the third level, the geographic distribution of government employees having telecommuting potential was determined (148,559 employees).
3 E
170 6 6 ] 3 , , [Epj u
6 6 ] 1 , , [Fpu
170 1 ] 3 [DTCj
170 1 ] 3
TABLE 7. Telecommuting estimation for the 3rd level based on job characteristics
Z
o
n
e
w
o
rk
er
s
te
le
-co
m
m
u
te
rs
Z
o
n
e
w
o
rk
er
s
te
le
-co
m
m
u
te
rs
Z
o
n
e
w
o
rk
er
s
te
le
-co
m
m
u
te
rs
zo
n
e
w
o
rk
er
s
te
le
-co
m
m
u
te
rs
zo
n
e
W
o
rk
er
s
te
le
-co
m
m
u
te
rs
1 1816 659 88 1865 677 167 3317 1203 274 201 73 429 115 42
2 1366 496 89 172 62 168 172 62 275 627 227 431 64 23
3 130 47 108 367 133 169 249 90 281 192 70 432 64 23
13 159 58 111 159 58 170 3703 1344 284 1437 521 434 87 32
14 2131 773 113 360 131 177 2555 927 285 159 58 437 1924 698
15 992 360 116 637 231 178 38 14 286 1694 615 438 130 47
17 159 58 118 3544 1286 179 552 200 288 115 42 443 1864 677
18 2171 788 119 4826 1751 180 242 88 293 1865 677 445 89 32
21 1865 677 120 3701 1343 181 196 71 304 79 29 446 414 150
27 1113 404 121 3077 1116 191 375 136 305 159 58 465 130 47
28 2253 817 123 2024 734 193 172 62 306 130 47 481 130 47
30 87 32 124 1202 436 198 130 47 315 113 41 484 9352 3393
31 172 62 125 545 198 207 2476 898 316 912 331 485 172 62
32 305 111 126 502 182 215 130 47 318 543 197 504 130 47
33 644 234 127 1716 623 229 130 47 326 543 197 506 1865 677
34 159 58 128 149 54 230 862 313 332 1865 677 515 159 58
35 769 279 129 888 322 231 1100 399 335 129 47 519 172 62
36 144 52 130 404 147 234 233 85 336 130 47 525 159 58
39 235 85 131 3004 1090 236 7 3 344 182 66 526 159 58
41 1865 677 136 271 98 240 69 25 359 1865 677 529 134 49
42 130 47 137 295 107 248 355 129 360 172 62 530 757 275
43 1865 677 138 481 175 249 8 3 368 130 47 531 130 47
46 492 179 139 0 0 257 2220 805 371 159 58 532 129 47
50 13 5 141 917 333 260 61 22 373 305 111 533 1865 677
52 779 283 144 993 360 261 59 21 381 1995 724 535 775 281
53 305 111 147 1152 418 263 130 47 389 159 58 537 104 38
54 159 58 149 671 243 264 407 148 394 543 197 538 160 58
58 1816 659 150 260 94 265 411 149 395 109 40 539 130 47
61 2318 841 153 88 32 266 1083 393 401 1865 677 545 274 99
65 2183 792 155 130 47 269 261 95 412 217 79 547 2625 952
66 1628 591 158 2107 764 270 28 10 414 1865 677 551 38 14
75 130 47 159 877 318 271 519 188 425 104 38 552 110 40
82 1865 677 162 159 58 272 2952 1071 427 172 62 557 744 270
84 130 47 166 3563 1293 273 113 41 428 172 62 559 3720 1350
Zones 170 workers 148,551 telecommuters 53,898
For estimating the trip distribution matrix of
potential telecommuters, employees were
distributed on their geographical places of work and residence. Then for each zone, the occupation matrix was formed by using the job configuration
to center-based telecommuting are work trips during peak hours, telecommuting can influence the worst traffic period during the day. According to this study, on the average 53,898 work trips can be removed each day or 269,490 telecommuters will be quitting commuting to work one day per week.
Results of this paper regarding potential telecommuting demand for the city of Tehran showed that 53,898 out of 148,551 government employees (about 36 percent) are able to participate in telecommuting program on a daily basis, eliminating 53,898 peak hour work trips.
The geographic distribution of potential
telecommuters by zone is shown in Table 7. Quiet expectedly, there is a noticeable correlation
between a zone’s occupation level and
telecommuting demand.
Besides the data limitation which made some assumptions inevitable to estimate telecommuting demand, it should also be noted that, the methodology applied in this study has the limitation that the distance from home to workplace does not influence the telecommuting feasibility of employees and also individual characteristics like age, gender, educational degree, and car ownership are not considered, which are suggested as areas of future research. Another next extension to the current research is the estimation of telecommuting trip distribution matrix to predict its impact on traffic on a large scale of a city with more details.
7. ACKNOWLEDGMENT
This paper presents parts of a research project funded by the Institute for Management and Planning studies (IMPS). The authors would like to thank the management of this Institute and also
those of the Management and Planning
Organization (MPO) for their support. Our sincere thanks also go to our research colleagues without whose help, this research would not have been completed. The help of all those in the different ministries and departments who kindly supported or participated in the surveys and data gathering process is also highly appreciated. Careful and vigilant comments of the reviewers are deeply
appreciated.
8. REFERENCES
1. United States Department of Transportation, Transportation Implications of Telecommuting, US DOT, Washington DC, 1993.
2. Mokhtarian, P. L. "A Synthetic Approach to Estimating the Impacts of Telecommuting on Travel",
Urban Design, Telecommuting and Travel Forecasting Conference, Virginia, 1996.
3. Nilles, J. M., The State of California Telecommuting Pilot Project, Final Report, JALA Associates, Inc., 971 Stonehill Lane, Los Angeles, CA, 90049-1412, 1990. 4. Mamdoohi, A. R., “Introduction, Database Formation
and Preliminary Analysis, Teleworking Impact Study for the City of Tehran”, First Phase Final Report, Institute for Management and Planning Studies,2007. 5. Mamdoohi, A. R., “Role of Telecommuting in
Transportation Demand Management: Theoretical Foundations and Applied Models”, PhD Dissertation, Civil Engineering Dept, Sharif University of Technology, Tehran, Iran, 2005.
6. Mamdoohi, A. R., Kermanshah, M. and Poorzahedy, H., “Telecommuting Suitability Modeling: An Approach based on the Concept of Abstract Job”,
Transportation, Vol. 33, No. 4, (2006), pp. 329-346. 7. Aryanejad, M. B. and Ghavampour, S., “Two Stage
Multiple Attribute Decision Making Problem in Iranian Gas Distribution Systems”, International Journal of Engineering, Vol. 17, No. 2, (2004), pp. 135-144. 8. Mokhtarian, P. L., Salomon, I. and Choo, S.,
“Data and Measurement Issues in Transportation, with Telecommuting as a Case Study”, Report Number UCD-ITS-RR-04-29, 2004.
9. Concas, S. and Winters, P. L., “Economics of Travel Demand Management: Comparative Cost Effectiveness and Public Investment”, Florida Department of Transportation, BD-549-26, National Center for Transit Research, Center for Urban Transportation Research, Final Report, 2007.
10. Columbia Telecommunications Corporation, Wireless Feasibility Study Prepared for the City of Tucson, Arizona, Communications Engineering & Analysis for the Public interests, 2007.
11. Tal, G., “Overestimation Reduction in Forecasting Telecommuting as a TDM Policy”, Institute of Transportation Studies, University of California, Davis, 2008.
12. Campbell, R., “Establishing a Formal Telework/Telecommuting Program for State Employees”, North Carolina General Assembly, 1997. 13. Millard, J., “Telework 99, The European Telework
Development”, Centre for Competence and IT, Danish Technological Institute, 2000.