Please cite this article as: B. Haihong, Z. Weiping, C. Bing, Control Simulation and Experimental Verification of Maximum Power Point Tracking Based on RT-LAB, International Journal of Engineering (IJE), TRANSACTIONS A: Basics Vol. 29, No. 10, (October 2016) 1372-1379
International Journal of Engineering
J o u r n a l H o m e p a g e : w w w . i j e . i rControl Simulation and Experimental Verification of Maximum Power Point
Tracking Based on RT-LAB
B. Haihong*a, Z. Weipingb, C. Bingb
a School of Power Engineering, Nanjing Institute of Technology, Nanjing, China b State Grid Jiangsu Electric Power Company, Nanjing, Jiangsu, China
P A P E R I N F O
Paper history:
Received 15 February 2016 Received in revised form 25 July 2016 Accepted 31 August 2016
Keywords: RT-LAB
Maximum Power Point Tracking (MPPT) Digital-analog Hybrid
Real-time simulation
A B S T R A C T
The maximum power point tracking (MPPT) control in a Photovoltaic system is the key control technology, however present controllers have the disadvantages of long development cycle, high cost and complex verification, and there are some disadvantages carrying out totally physical simulation or totally digital simulation of different control algorithms. This paper carried out design of hardware controller by researching different kinds of MPPT algorithms together with the improved MPPT algorithm, then digital-analog hybrid real-time simulation was carried out based on the digital main circuit using RT-LAB developed by Opal-RT company. Effectiveness and superiority of the improved MPPT algorithm were verified in comparison with control effects of the improved MPPT algorithm and control effects of traditional MPPT algorithms.
doi: 10.5829/idosi.ije.2016.29.10a.07
1. INTRODUCTION1
How to realize the maximum power point tracking is the key point of Photovoltaic Power System. Recently, research on MPPT controller is mostly carried out by building simulation in MATLAB/Simulink [1-3], which is pure digital simulation [4], also, pure physical simulation is carried out by building Photovoltaic Power System model with hardware to verify the pros and cons of controllers. Although digital simulation has the advantage of simple operation and varying parameter, its accuracy is not as good as pure physical simulation, furthermore, some physical phenomena can’t be simulated; Although pure physical simulation is intuitive and believable, its maneuverability is not good enough, which can’t carry out sufficient simulation of actual situation.
So, in this paper physical simulation and digital simulation is combined, MPPT algorithm is simulated with hardware. Digital simulation of main circuit is built in the real time simulation software RT-LAB [5-7], then the real time simulation platform is established together with real time simulator of RT-LAB, on which
1*Corresponding Author’s Email:[email protected] (B. Haihong)
analog hybrid simulation is carried out. On the real time simulation platform, the simulation time scale is the same with the clock time scale, experimental verification of different kinds of extreme situations can be simulated.
There are also papers that have carried out digital-analog hybrid simulation combining real time simulation technology of RT-LAB and characteristics of MPPT [8, 9], however, none of them has carried out comparison of different kinds of MPPT algorithms to research the applicability and superiority-inferiority. In this paper, a kind of advanced MPPT algorithm is compared with traditional MPPT algorithms, digital-analog hybrid simulation is carried out on the real time simulation platform to analyze the control effect and to verify effectiveness and superiority of the advanced MPPT algorithm.
2. MODEL OF PHOTOVOLTAIC SYSTEM
2. 1. Model of Photovoltaic Cell Mathematical
model of photovoltaic cell [10, 11] is widely used in theoretical analysis of output characteristics about solar cell, testing parameters on standard conditions (sunshine intensity is 1000 W/m2, cell temperature is 25℃) are
offered by manufacturer: short circuit current Isc, open circuit voltage Uoc, current of the maximum power point Im, voltage of the maximum power point Um. Parameters under the new environment is calculated as the formulas below:
I I ref 1 α T
scref sc
S S
(1)
Uocref U (1oc T ln) 1 β S (2)
Imref ImSref 1 α T
S
(3)
Umref U (1m T ln) 1 β S (4)
As for the formulas above, ΔT is the difference between reference cell temperature and actual cell temperature, ΔS is the ratio of variation sunshine intensity and reference sunshine intensity, Iscref is short circuit current of photovoltaic cell with the conditions changing, Uocref is open circuit voltage of photovoltaic cell with the conditions changing, Imref is current of the maximum power point with the conditions changing, Umref is voltage of the maximum power point with the conditions changing, α, β and γ are constants, typical values are applied as 0.0025, 0.5, 0.00288. Current equation can be calculated as the formulas below:
2 1
I I [1 ( OC 1)]
U C U
sc C e
(5)
2
1 (1 )
I m OC U C U m sc I C e
(6)
1
2 1 [ln(1 )]
I m m OC sc U I C U
(7)
In this paper, photovoltaic cell of BP Solar is used for parameter simulation, cell parameters on standard conditions are shown in Table 1.
2. 2. Photovoltaic Output Characteristics
Performance of photovoltaic cell can be affected by PN junction parameters, sunshine intensity, cell temperature and so on, Therefore, the performance of photovoltaic cell is nonlinear.
TABLE 1.Parameters of photovoltaic cell
Parameter name Value Unit
Open circuit voltage 37.2 V
Voltage of the maximum power point 29.8 V
Short circuit current 8.37 A
Current of the maximum power point 7.72 A
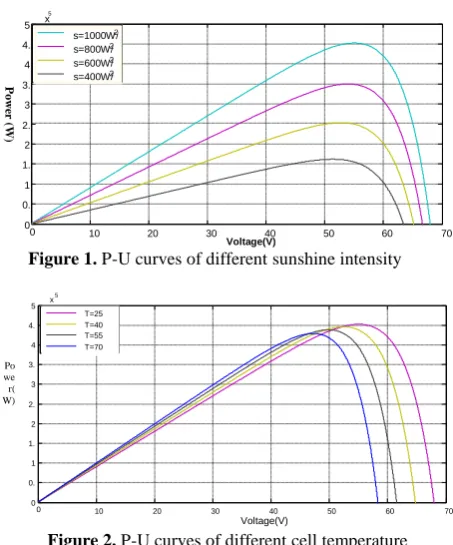
Among these factors, the effects of sunshine intensity and cell temperature are the most significant. For better use of photovoltaic cell, we need to analyze performance of photovoltaic cell under different conditions. P-U curves of different sunshine intensity are shown in Figure 1.
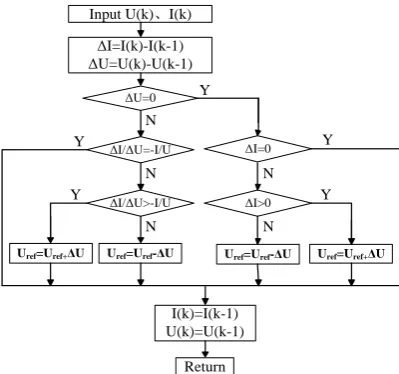
Figure 1 illustrates that with the sunshine intensity changing with 400W/m2, 600W/m2, 800W/m2, 1000W/m2, power of the maximum power point increases constantly, voltage of the maximum power point changes little. From the relationship of power, voltage and current, we can find that current of the maximum power point increases. P-U curves of different cell temperatures are shown in Figure2.
Figure 2 illustrates that the power of photovoltaic cell is increasing up to the maximum power point, with the cell temperature changing with 25℃, 40℃, 55℃, 70℃. Beyond that, power begins to decline. On the other hand, the power of photovoltaic cell decreases with the increase of cell temperature, when the voltages are the same.
3. ANALYSIS OF MPPT ALGORITHMS
In this paper a developed MPPT algorithm is adopted to carry out real time simulation, which is called Perturbation and Observation (P&O) based on |(dP/dU)/P| [12], then comparison with common MPPT algorithms is conducted. Furthermore, common algorithms include P&O method [13-15] and incremental conductance (INC) method [16-18].
Figure 1. P-U curves of different sunshine intensity
Figure 2. P-U curves of different cell temperature
0 10 0 20 0 30 0 40 0 50 0 60 0 70 0 0 0. 5 1 1. 5 2 2. 5 3 3. 5 4 4. 5 5 10x
5 Voltage(V) P owe r (W) s=1000W/ m 2 s=800W/ m 2 s=600W/ m 2 s=400W/ m 2 0 10 0 20 0 30 0 40 0 50 0 60 0 70 0 0 0. 5 1 1. 5 2 2. 5 3 3. 5 4 4. 5 5 10x
P&O method is the most common self-optimization method, firstly, voltage and current are disturbed, secondly, changing trend of cell power is observed, according which disturbance direction is changed, at last, the photovoltaic cell will work at the maximum power point. The control flow chart is shown in Figure 3.
When the intersection point of load characteristic and photovoltaic cell characteristics is on the left of the maximum power point, the MPPT control will increase the voltage, while on the right the voltage will decrease, holding on the process, the system will work at the maximum power point at last.
P&O method with fixed step has the problem of oscillation and misjudgment [19], which will lead to inaccurate tracing of the maximum power point, so improvement needs to be carried out.
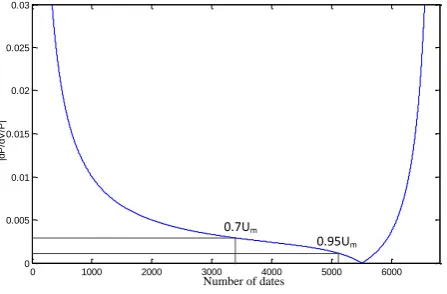
INC method comes from the rule that power of photovoltaic cell changes over voltage regulation, relationship between conductance and conductance regulation of the system is derived at the maximum power point, then the MPPT algorithm can be raised. Actually, dI/dU is replaced by ΔI/ΔU, the criterion of INC method is as below:
I
the intersection point is on the left of MPP
I
the intersection point is at the MPP
I
the intersection point is on the right of MPP
I
U U
I
U U
I
U U
,
,
,
(8)
The control flow chart of INC algorithm is shown in Figure 4.
The computational complexity of INC algorithm is large, which means complex operation and high demand for the system, also, it has high requirements for the hardware especially for the sensor, then the cost for hardware will increase [20].
Concerning the controlling defects of P&O algorithm and INC algorithm, in this paper, the
N Y
Samping U、I
Power calculation P=UI
P(k)≤P(k-1)
U(k)>U(k-1) U(k)>U(k-1)
Uref=Uref+ΔU Uref=Uref-ΔU Uref=Uref-ΔU Uref=Uref+ΔU
N
Y Y N
Return
Figure 3.Control flow chart of P&O algorithm
N Y Input U(k)、I(k)
ΔI=I(k)-I(k-1) ΔU=U(k)-U(k-1)
ΔU=0
ΔI/ΔU=-I/U
N
ΔI/ΔU>-I/U
ΔI=0
N
ΔI>0
N N
Uref=Uref-ΔU Uref=Uref+ΔU
Y
Uref=Uref-ΔU Y
Uref=Uref+ΔU
Y Y
I(k)=I(k-1) U(k)=U(k-1)
Return
Figure 4.Control flow chart of INC algorithm
developed MPPT algorithm P&O algorithm based on |(dP/dU)/P| is adopted to carry out real time simulation, which can avoid the problem of oscillation and misjudgment as well as high requirements for controller. The developed algorithm add a step judgment module based on traditional P&O algorithm, |(dP/dU)/P| is used as judgment factors, when the external conditions change, the curve of |(dP/dU)/P| changes little, so the algorithm can be adapted to the changeable external conditions for the stable operation of the system. In this paper, two-hierarchical photovoltaic system is adopted, boost circuit is used for DC-DC module, actual control quantity is duty ratio of the switch in boost circuit, which is controlled by IGBT signal, the control flow chart of P&O algorithm based on |(dP/dU)/P| is shown in Figure 5.
Characteristics of photovoltaic cell is nonlinear, the tracking speed is slow when the working voltage U is far from voltage of the maximum power point Um, especially on the left of Um.
N Y
Sampling U、I
|(dP/dU)/P|
|(dP/dU)/P|>xmax
step of ΔDmid
N Y
Return
|(dP/dU)/P|>xmin
step of ΔDmin step of ΔDmax
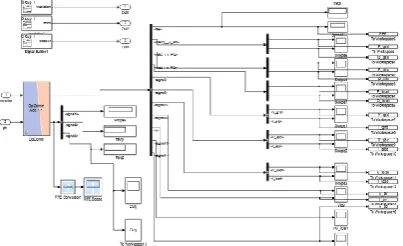
So on the left of Um we set that the system adopts big tracing step if U<0.7Um, the system adopts small tracing step if U>0.95Um. Curve of |(dP/dU)/P| is shown in Figure 6 according to the mathematical model of photovoltaic cell. Then boundary value of step can be calculated.
Figure 6 illustrates that the value of |(dP/dU)/p| is 0.003 at the point of 0.7Um, the system adopts the big step 0.003 when |(dP/dU)/p|>0.003, the value of |(dP/dU)/p| is 0.001 at the point of 0.95Um, the system adopts the small step 0.0001 when |(dP/dU)/p|<0.001, the system adopts the middle step 0.001 when 0.001<|(dP/dU)/p|<0.003.
4. REAL TIME SIMULATION AND EXPERIMENTAL VERIFICATION
4. 1. Establishment of Real Time Simulation
Platform RT-LAB real time simulation platform
is based on Matlab/Simulink, which realizes system design and testing perfectly based on models, also, power electronics and power system control algorithm interacts with simulation model adequately on the platform, and the system is open and flexible. Structural diagram of RT-LAB real time simulation platform is shown in Figure 7.
The platform consists of OP5600 simulation target machine, host computer, physical controller, oscilloscope and signal generator. Target machine is equipped with 4U crate, 3.3GHz Intel six nuclear, two CPU, 4G memory, 5142 FPGA board card, I/O loading board and Redhat linux operating system. Host computer is equipped with 2.60GHz Core(TM)i5-3230M CPU, 4G memory, win764-bit operating system. Physical controller is chip MC56F8257 of Freescale company Code Warrior for Microcontrollers10.5 is chosen as software development environment, C language is used to compile program, real time debugging tool FreeMASTER1.4 is used for debugging,
0 1000 2000 3000 4000 5000 6000
0 0.005 0.01 0.015 0.02 0.025 0.03
采 集 点 数
|d
P
/d
V
/P
|
0.7Um
0.95Um
Number of dates
Figure 6. curve of |(dP/dU)/P|
Simulation Host
Simulation Target Machine
RT-LAB supporting environment TCP/IP
I/O
Physical controller
Figure 7. Structure diagram of RT-LAB real time simulation platform
target machine and host computer are connected by TCP/IP, target machine and physical controller are connected by OP5142 FPGA board card and conductors. Oscilloscope and signal generator are used for data observation and verification of real simulation.Three MPPT algorithms are adopted for design of physical controller, analog output of RT-LAB (input of controller) are voltage and current of photovoltaic cell, digital input of RT-LAB (output of controller) is IGBT signal for boost circuit, structure diagram of photovoltaic grid-connected circuit is in Figure 8.
Analog input of physical controller ranges from 0V to 3.3V, so the voltage and current of photovoltaic cell are decreased by 300 times before sending to physical controller, simulation step of RT-LAB is 1e-5s, sampling period of MPPT controller is 1e-4s, the signal sent back to RT-LAB from MPPT controller is square wave of 5V and 10kHz to drive the boost circuit, realizing the maximum power point tracking.
In this paper, MPPT controller needs to detect the voltage and current of photovoltaic cell, the ADC module inside of MC56F8257 is used to realize AD conversion.
PV
C1
L I
Signal Acquisition
U+
U-I I
MPPT Physical Controller PWM Signal
D1
C2 R
IGBT
Physical controller needs to output one path of PWM signal as the controlling signal of boost circuit. Concerning that MC56F8257 is integrated with eFlexPWM module, which has powerful function and superior performance, the needs of controller can be satisfied. The hardware configuration is shown in Table 2.
4. 2. Model of RT-LAB Real Time simulation
RT-LAB real time simulation model is established to carry out real time simulation of three kinds of MPPT algorithms, parameter optimization is conducted according to function of adjusting parameter online, the real time simulation model consists of SM main subsystem and SC monitoring subsystem, the model are shown as below.
TABLE 2. Hardware configuration of physical controller
Port Pin Pin Number Function Signal
A GPIOA0 13 ANA0 Vpv
B GPIOB0 24 ANB0 Ipv
E GPIOE0 45 PWM0B PWM
Figure 9. Main model of RT-LAB real time simulation model
Figure 10. SM main circuit subsystem of RT-LAB real time simulation model
Figure 11. SC monitoring subsystem of RT-LAB real time simulation model
From the main model of RT-LAB in Figure 9, we can see the simulation step of 10µs is adopted to conduct experimental verification, the main model concludes SM main circuit subsystem and SC monitoring subsystem, the SM main circuit subsystem is in charge of calculation of photovoltaic grid-connected system, simulation of external conditions and exchange of analog signal and digital signal, while SC monitoring subsystem is responsible for sending controlling signal to the SM main circuit subsystem, including change of sunshine intensity, cell temperature and system conditions, in addition, it collect the system observed quantities, displaying in the oscilloscope to realize the real time monitoring of grid-connected system.
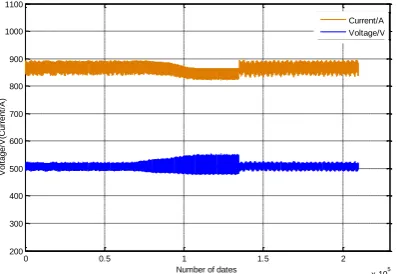
Three kinds of MPPT physical controllers are connected to RT-LAB respectively to carry out comparative analysis. Cell temperature remains 25℃, sunshine intensity changes as below, the value is 1000W/m2 before 0.5s, it changes to 200W/m2 at 0.5s, then it rises to 1000W/m2 at 0.75s, the simulation results based on three kinds of MPPT algorithms is shown in Figure 12, 13 and 14.
Figure 12. Voltage and current waveforms of P&O algorithm with changing sunshine intensity
0 1 2 3 4 5 6
x 105 100
200 300 400 500 600 700 800 900
Number of dates
V
o
lt
a
g
e
/V
(C
u
rr
e
n
t/
A
)
Figure 13. Voltage and current waveforms of INC algorithm with changing sunshine intensity
Figure 14. Voltage and current waveforms of P&O Algorithm Based on |(dP/dU)/P| with changing sunshine intensity
From Figure 12, 13 and 14, we can conclude that when the sunshine intensity is 1000W/m2, voltage of photovoltaic cell is 550V and the current is 820A, voltage and current of photovoltaic cell changes to 497V and 155A when the sunshine intensity turns to 200W/m2, which agrees well with the theory. Meanwhile, the system can track to the maximum power point with the sunshine intensity changing, which verifies the effectiveness and rapidity of the physical controllers.
Among the three MPPT algorithms, oscillations of P&O algorithm and INC algorithm are more serious at the maximum power point, while P&O Algorithm Based on |(dP/dU)/P| has little oscillation, which reflects good stability of the algorithm. Meanwhile, with the change of sunshine intensity, the tracking time to the new stable point of the advanced algorithm is less than P&O algorithm and INC algorithm, which means that P&O Algorithm Based on |(dP/dU)/P| has good environmental adaptability and well operation stability.
When sunshine intensity remains 1000 W/m2, cell temperature changes as below, the value is 50℃ before 0.5s, it changes to 15℃ at 0.5s, then it rises to 50℃ at 0.75s, the simulation results based on three kinds of MPPT algorithms is shown in Figure 15, 16 and 17.
From Figure 15, 16 and 17, we can conclude that when the cell temperature is 50℃, voltage of photovoltaic cell is 510V and the current is 860A, voltage and current of photovoltaic cell changes to 560V and 810A when the cell temperature turns to 15℃, which agrees well with the theory. Meanwhile, the system can track to the maximum power point with the cell temperature changing, which verifies the effectiveness and rapidity of the physical controllers.
Figure 15. Voltage and current waveforms of P&O algorithm with changing cell temperature
Figure 16. Voltage and current waveforms of INC algorithm with changing cell temperature
Figure 17. Voltage and current waveforms of P&O Algorithm Based on |(dP/dU)/P| with changing cell temperature
0 1 2 3 4 5 6
x 105 100 200 300 400 500 600 700 800 900
Number of dates
V o lt a g e /V (C u rr e n t/ A ) Current/A Voltage/V
0 2 4 6 8 10 12 14 16
x 105 100 200 300 400 500 600 700 800 900
Number of dates
V o lt a g e /V (C u rr e n t/ A ) Current/A Voltage/V
0 0.5 1 1.5 2
x 105 200 300 400 500 600 700 800 900 1000 1100
Number of dates
V o lt a g e /V (C u rr e n t/ A ) Current/A Voltage/V
0 0.5 1 1.5 2
x 105 200 300 400 500 600 700 800 900 1000 1100
Number of dates
V o lt a g e /V (C u rr e n t/ A ) Current/A Voltage/V
0 2 4 6 8 10 12 14 16
x 105 200 300 400 500 600 700 800 900 1000 1100
Number of dates
Among the three MPPT algorithms, oscillations of P&O algorithm and INC algorithm are more serious at the maximum power point, while P&O Algorithm Based on |(dP/dU)/P| has less oscillation than other two MPPT oscillations, which reflects good stability of the algorithm. Meanwhile, with the change of cell temperature, the tracking time to the new stable point of the advanced algorithm is less than P&O algorithm and INC algorithm, which means that P&O Algorithm Based on |(dP/dU)/P| has good environmental adaptability and well operation stability.
5. CONCLUSION
In this paper an advanced MPPT algorithm together with two traditional MPPT algorithms is researched from the view of physical controller, digital main circuit is established on RT-LAB, then digital-analog hybrid real-time simulation was carried out based on the digital main circuit using RT-LAB, effectiveness and superiority of the improved MPPT algorithm were verified in comparison with control effects of the improved MPPT algorithm and control effects of traditional MPPT algorithms.
The experiment result shows that among the three MPPT algorithms, oscillations of P&O algorithm and INC algorithm are more serious at the maximum power point, while P&O Algorithm Based on |(dP/dU)/P| has less oscillation than other two MPPT oscillations, which reflects good stability of the algorithm. Meanwhile, with the change of sunshine intensity and cell temperature, the tracking time to the new stable point of the advanced algorithm is less than P&O algorithm and INC algorithm, which means that P&O Algorithm Based on |(dP/dU)/P| has good environmental adaptability and well operation stability.
6. ACKNOWLEDGEMENTS
This work was financially supported by the Natural Science Foundation of Jiangsu Province (BK20130742).
7. REFERENCES
1. Subramanian, N., Prasanth, P., Srinivasan, R., Subhesh, R. and Seyezhai, R., "Analysis and experimentation of soft switched interleaved boost converter for photovoltaic applications",
International Journal of Engineering-Transactions A: Basics, Vol. 28, No. 10, (2015), 1469-1478.
2. Ke, L. and Liu, Y., "Modeling and simulation of variable frequency pump control fatigue test machine", International Journal of Engineering-Transactions A: Basics, Vol. 29, No. 1, (2016), 96-102.
3. Kondawar, S.S. and Vaidya, U., "A comparison of two mppt techniques for pv system in matlab simulink", International
Journal of Engineering Research and Development, Vol. 2, No. 7, (2012), 73-79.
4. Salih, S., Jabur, Y.K. and Kadhim, L., "Analysis of temperature effect on a crystalline silicon photovoltaic module performance",
International Journal of Engineering-Transactions B: Applications, Vol. 29, No. 5, (2015), 722-727.
5. Benigni, A. and Monti, A., "A parallel approach to real-time simulation of power electronics systems", IEEE Transactions on Power Electronics, Vol. 30, No. 9, (2015), 5192-5206. 6. Jung, J.-H., "Power hardware-in-the-loop simulation (phils) of
photovoltaic power generation using real-time simulation techniques and power interfaces", Journal of Power Sources, Vol. 285, No. 5, (2015), 137-145.
7. Friedman, A., Dyke, S.J., Phillips, B., Ahn, R., Dong, B., Chae, Y., Castaneda, N., Jiang, Z., Zhang, J. and Cha, Y., "Large-scale real-time hybrid simulation for evaluation of advanced damping system performance", Journal of Structural Engineering, Vol. 141, No. 6, (2014), 401-415.
8. Myaing, A. and Dinavahi, V., "Fpga-based real-time emulation of power electronic systems with detailed representation of device characteristics", IEEE Transactions on Industrial Electronics, Vol. 58, No. 1, (2011), 358-368.
9. Maity, S., Bhunia, C. and Sahuc, P., "Experimental study of some effective surface parameters of crystalline silicon solar cell for getting better performance", International Journal of Engineering-Transactions A: Basics, Vol. 28, No. 1, (2014), 81-87.
10. Elbasit, W., El–Maksood, A. and Soliman, F., "Mathematical model for photovoltaic cells", Leonardo J. Sci, Vol. 23, No. 2, (2013), 13-28.
11. Kumari, J. and Babu, C.S., "Mathematical modeling and simulation of photovoltaic cell using matlab-simulink environment", International Journal of Electrical and Computer Engineering, Vol. 2, No. 1, (2012), 26-34. 12. Ahmed, J. and Salam, Z., "An improved perturb and observe
(p&o) maximum power point tracking (mppt) algorithm for higher efficiency", Applied Energy, Vol. 150, No. 5, (2015), 97-108.
13. Femia, N., Petrone, G., Spagnuolo, G. and Vitelli, M., "A technique for improving p&o mppt performances of double-stage grid-connected photovoltaic systems", IEEE Transactions on Industrial Electronics, Vol. 56, No. 11, (2009), 4473-4482. 14. Amrouche, B., Belhamel, M. and Guessoum, A., "Artificial
intelligence based p&o mppt method for photovoltaic systems",
Revue des Energies Renouvelables ICRESD-07 Tlemcen, (2007), 11-16.
15. Gu, Y. and Zhang, D., "Interleaved boost converter with ripple cancellation network", IEEE Transactions on Power Electronics, Vol. 28, No. 8, (2013), 3860-3869.
16. Mei, Q., Shan, M., Liu, L. and Guerrero, J.M., "A novel improved variable step-size incremental-resistance mppt method for pv systems", IEEE Transactions on Industrial Electronics, Vol. 58, No. 6, (2011), 2427-2434.
17. Gomathy, S., Saravanan, S. and Thangavel, S., "Design and implementation of maximum power point tracking (mppt) algorithm for a standalone pv system", International Journal of Scientific & Engineering Research, Vol. 3, No. 3, (2012), 1-7. 18. Chao, K.-H. and Li, C.-J., "An intelligent maximum power point
tracking method based on extension theory for pv systems",
Expert Systems with Applications, Vol. 37, No. 2, (2010), 1050-1055.
20. Elgendy, M.A., Zahawi, B. and Atkinson, D.J., "Assessment of the incremental conductance maximum power point tracking
algorithm", IEEE Transactions on Sustainable Energy, Vol. 4, No. 1, (2013), 108-117.
Control Simulation and Experimental Verification of Maximum Power
Point Tracking Based on RT-LAB
TECHNICAL NOTE
B. Haihonga, Z. Weipingb, C. Bingb
a School of Power Engineering, Nanjing Institute of Technology, Nanjing, China b State Grid Jiangsu Electric Power Company, Nanjing, Jiangsu, China
P A P E R I N F O
Paper history:
Received 15 February 2016 Received in revised form 25 July 2016 Accepted 31 August 2016
Keywords: RT-LAB
Maximum Power Point Tracking (MPPT) Digital-analog Hybrid
Real-time simulation
ديكچ ه
یريگ در لرتٌک (Tracking)
ٌِيشيب ىاَت ِطقً (MPPT)
،تسا یذيلک يياتلٍَتف ًِاهاس کي رد دَجٍ ييا اب
ُذٌٌک لرتٌک
شرتسگ يًلاَط ُرٍد ليبق زا يياّ بيع دَجَه یاّ (Development cycle)
ذًراد ُذيچيپ يياهزآ يتسار ،لااب ٌِيسّ ،
ٍ .ذًراد يلرتٌک تٍافته یاّ نتيرَگلا زا يلاتيجيد اي يکيسيف یزاس ِيبش لهاک ماجًا رد يياّداريا کي يحارط ِلاقه ييا
یاّ نتيرَگلا فلتخه عاًَا رد شٍاک اب ار یراسفا تخس ُذٌٌک لرتٌک MPPT
نتيرَگلا اب ُاروّ ِتفاي دَبْب
MPPT
زا ُدافتسا اب ٍ يلاتيجيد يلصا راذه یاٌبه رب سپس ،تسا ُداد ماجًا RT-LAB
تکرشرد ِتفاي ِعسَت Opal-PT
ِيبش
گًرد يب یزاس (Real Time)
ِگر ٍد (Hybrid) لاتيجيد
-.تسا ُداد ترَصار گَلاًآ یرترب
نتيرَگلا ىدَب رثَه ٍ
يلرتٌک تارثا اب ىآ يلرتٌک تارثا ِسياقه رد ِتفاي دَبْب يتٌس یاّ نتيرَگلا