Please cite this article as: H. Ayremlouzadeh, J. Ghafouri, Computational Fluid Dynamics Simulation and Experimental Validation of Hydraulic Performance of a Vertical Suspended API Pump, International Journal of Engineering (IJE), TRANSACTIONS B: Applications Vol. 29, No. 11, (November 2016) 1612-1619
International Journal of Engineering
J o u r n a l H o m e p a g e : w w w . i j e . i rComputational Fluid Dynamics Simulation and Experimental Validation of Hydraulic
Performance of a Vertical Suspended API Pump
H. Ayremlouzadeh, J. Ghafouri*
Department of Mechanical Engineering, Tabriz Branch, Islamic Azad University, Tabriz, Iran
P A P E R I N F O
Paper history:
Received 07 June 2016
Received in revised form 30 September 2016 Accepted 30 September 2016
Keywords:
Vertical Suspended API Pump Computational Fluid Dynamics Flow Rate
Performance Test
A B S T R A C T
For a long period of time, design and manufacturing technology of high flow rated vertically suspended pumps (VSPs) which have an extensive applications in many industries such as water and wastewater, mining, petrochemical and oil and gas industries, used to be imported from European countries. For the first time in Iran's pump industry, with the support of Ministry of Petrochemical and great effort of Iranian experts, VS1-1200.1300 API pump with a flow rate of 10330 m3/h was designed, manufactured and tested successfully. This pump is now installed in Persian Gulf Star Oil Refinery. The main purpose of this research is computational fluid dynamic (CFD) analysis of VS1-1200.1300 pump. Based on the requirement, hydraulic profile of impeller and diffuser blades were extracted from CFTurbo software, 3D mechanical model designed in Catia software and CFD analysis carried out using ANSYS-FLUENT software based on realizable k- turbulent model and SIMPLEC algorithm for different flow rates. Experimental performance tests were carried out on manufactured VS1 pump for 6 different flow rates and the results were compared with numerical ones. The outcomes illustrated good agreement of experimental and numerical data even in high flow rates which expand the understanding of the flow in this type of pump, guide design optimizations and provide a basis to investigate flow in more vertical pumps.
doi: 10.5829/idosi.ije.2016.29.11b.16
1. INTRODUCTION1
Pumps have continued to grow in size, speed and energy level, revealing new problems that are being addressed by innovative materials and mechanical and hydraulic design approaches [1]. Centrifugal pumps are used in a wide range of applications and they can handle a variety of liquids like water and oil at relatively high pressures and/or temperatures. According to American Petroleum Institute standard API610, A VS1 pump is a wet pit, vertically suspended, single-casing diffuser pump with discharge through the column [2]. The difference of VS pumps with electric submersible pump (ESP) is the location of motor. An ESP system consists of a centrifugal pump, a motor, a power cable and a seal, all inside the wellbore, whereas in a VSP system, motor is located on the ground and easier to repair. Lobanoff [3]
1*Corresponding Author’s Email: [email protected]
(J. Ghafouri)
stated that for a well depth down to 400 feet, a surface mounted driver is normally used, whereas for well over 400 feet depth, a submersible unit is usually cost-effective and reliable.
Pessoa and Prada [4] studied experimental single-phase and two-single-phase performance data of a 22-stage mixed flow ESP. Zhou and Sachdeva [5] presented a model for ESP performance pumping gas–liquid mixture using regression analysis. Gamboa and Prado [6] experimentally visualized flow pattern within an ESP impeller at different operating conditions and fluid properties. Experimental study of flow field phenomena is very difficult due to high cost of manufacturing and test equipment.
Experimental investigations are costly and time consuming. Furthermore, there are many performance details that cannot be easily measured; hence, numerical simulation approach provides comprehensive details which are very useful to understand the flow physics [7]. Through the increase in computing capacity,
Computational Fluids Dynamics (CFD) simulations of large problems could be achieved in rotating machinery, especially pumps. CFD technique has been applied by researchers to carryout different investigations on centrifugal pumps viz. performance prediction at design and off-design conditions [8, 9], parametric studies [10], cavitation analysis [11, 12], diffuser pump analysis [13], performance of pump running in turbine mode [14, 15] etc. Submersible pumps are remained competitive in CFD analysis, as well. Caridad and Kenyery [16] performed a CFD simulation on a two-phase liquid-gas flow within an ESP impeller without considering the diffuser and studied pressure, liquid and gas velocity and gas void fraction distribution. Maitelli [17] simulated the stationary flow in the impeller and stator of an ESP using CFD techniques and evaluated the interface connection between impeller and diffuser. Stel et al. [18] investigated the influence of turbulence models and number of stages on performance of a multistage mixed-type ESP using CFD method. They also compared the results with experimental results derived from a three-stage ESP and found a good agreement. Pineda et al. [19] analyzed the void fraction at the inlet of an ESP in presence of a two-phase (liquid-gas) flow and investigated the effect of the gas in the head delivered by this pump. They used Volume of Fluid (VOF) model of CFD method and performed a comparison between numerical and experimental results.
The mixed-flow pump is widely applied in hydraulic engineering applications, so the study on the mixed-flow pump has become a hot research topic for many researchers. In a mixed-flow pump, the flow is remarkably influenced by parameters like turbulence and viscosity [20].
In this article, a 3-D investigation of flow in a VS1-1200.1300 pumps (vertically suspended API pump with suction diameter of 1200mm and impeller diameter of 1300mm) with a flow rate of 10330 m3/h, was carried out. This pump is the first homemade pump of this kind. For this purpose, impeller and diffuser blade hydraulic profile were derived from CFTurbo software. Based on these profile and details, 3D CAD model of impeller, diffuser, pump casing and other pump parts were designed and assembled in Catia software. Fluid model was extracted and imported to Ansys-Fluent software and meshed. Considering realizable K- turbulent model, pump performance for 6 different flow rates were compared with experimental data acquired at Hydraulic Lab, PETCO, IRAN.
2. CFD SIMULATION
Simulation is an efficient way to analyze a real-world process or system. The act of simulating something first requires that a model be developed. The model
represents the system itself, whereas the simulation represents the operation of the system over time [21]. For the simulation of mixed-flow of the VSP following methodology is followed:
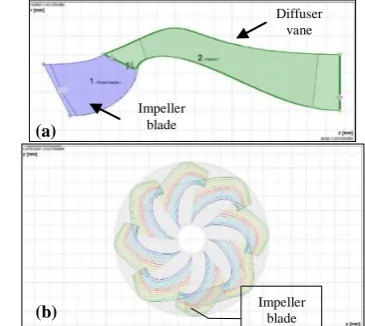
2. 1. Hydraulic Design The first step of pump design is hydraulic design of impeller and diffuser. For this, CFTurbo software was selected due to high accuracy and manifold capabilities. Flow-conducting parts of the machine can be designed by CFturbo. The input data are flow rate of 10330 m3/h, head of 32.92 m and rotational speed of 500 rpm. The liquid was water at 20˚C with the density of 1050 kg/m3 and the direction of rotation was clockwise. CFTurbo recommended 5 blades for impeller and 8 for diffuser. Figure 1.a presents hydraulic profile of impeller blade and diffuser vane and Figure 1.b shows a view of diffuser vanes profile along with one blade of impeller. Pump geometric characteristics are listed in Table 1.
2. 2. Mechanical Design According to impeller and diffuser profile extracted from CFTurbo, 3D CAD design of impeller, diffuser and other parts of pump were prepared using Catia software in real dimension (not scaled).
Figure 1. a) Hydraulic profile of an impeller blade and a
diffuser vane and b) up view of diffuser vanes.
TABLE 1. Pump geometric characteristics.
Value Characteristics
860 Impeller inlet diameter (mm)
1334 Impeller outlet diameter (mm)
13 Impeller inlet blade angle (˚)
68 Impeller outlet blade angle (˚)
20 Impeller thickness (mm)
1350 Diffuser inlet diameter (mm)
915 Diffuser outlet diameter (mm)
60 Diffuser inlet blade angle (˚)
20 Diffuser outlet blade angle (˚)
1240 Diffuser height (mm)
(a)
Impeller blade
Diffuser vane
Impeller blade
CAD models of bell suction, impeller guide, impeller, diffuser bowel and taper pipe are illustrated in Figure 2. Figure 3-a shows the assembled VS1 pump in Catia software. Flow region for simulation was selected from beginning of the pump suction to the end of the taper pipe which is presented in Figure 3-b.
2. 3. Mesh Generation and Governing Equations The meshing was generated by Ansys-Fluent software. Fluid domains extracted from Catia software were imported to Ansys as .stp file and meshed. Meshes of rotational and stationary domains were generated separately. The total number of nodes and elements were obtained as 1178158 and 6247413, respectively. Girds appearance of the computational domains can be observed in Figure 4. Fluent is a general purpose commercial CFD package that solves the Navier–Stokes equations using a finite volume method and SIMPLEC algorithm. In this work, Ansys-Fluent 16.0 was used to solve the momentum, continuity and turbulence equations for fluid flow.
Since the flow fluid is turbulence, realizable k
-
turbulence model was selected.(C) (b)
(a)
(e) (d)
Figure 2. 3D CAD model of a) bell suction, b) impeller guide,
c) impeller, d) diffuser bowel and e) taper pipe.
(a) (b)
Figure 3. a) Assembled model of VSP and b) flow region
extracted in Catia software.
(b) (a)
Figure 4. Computational grid on flow inside a) suction,
diffuser and taper pipe and b) impeller.
The modeled transport for k and
in the realizable k-
model are:( k) ( ku ) t
j
j j k j
k b M k
k
t x x x
G G Y S
(1)
2
1 2 1 3
( ) ( u ) t
j
j j j
t x x x
C S C C C
k k
(2)
where
1 max 0.43, 5
C
(3)
k S
(4)
2 ij
S S (5)
In these equations, Gk represents the generation of turbulence kinetic energy due to the mean velocity gradients, Gb the generation of turbulence kinetic energy due to buoyancy, YM represents the contribution of the fluctuating dilatation in compressible turbulence to the overall dissipation rate, and C2 and C1 are
constants. k and are the turbulent Prandtl numbers for k and
, respectively. Sk and S are user-definedsource terms.
. vr 0 t
(6)
( )
.( ) ( ) .
r
r v
v v v P t F
t
(7)
( )
.( r r) .(k )
E
v H u T
t
(8)
where
v
ris relative speed, v absolute speed andu
rrotational speed.
2. 4. Boundary Conditions and Physical Properties of Working Fluid At the inlet surface of the fluid domain, an inlet pressure was set. The total pressure and initial (static) pressure are 6000 Pa and 57525 Pa, respectively. Initial pressure is equal to total pressure minus dynamic pressure where dynamic pressure is calculated using . At the outlet surface, mass flow inlet boundary condition with a mass flow rate of 2869.44 kg/s ( ̇ ) was specified. In MRF technique, impeller was selected as moving frame with a constant rotational speed of 500 rpm and suction, diffuser and taper pipe speeds were set to zero. Water with the density of 998.2 kg/m3 and viscosity of 0.001 kg/m.s was selected as the working fluid.
3. EXPERIMENTAL WORK
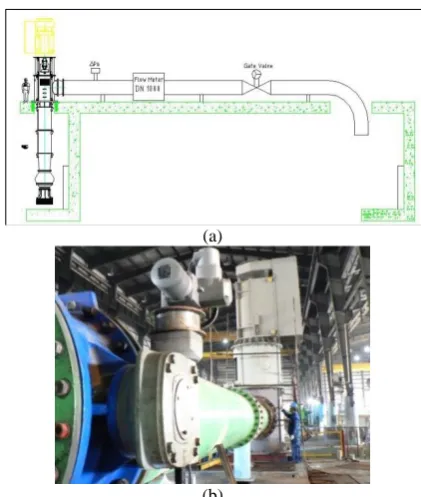
Experimental performance test setup schematic of VS1-1200.1300 is presented in Figure 5-a. The pump was installed in a tank with surface area of 360 m2 and height of 12 m containing clean water. Figure 5-b shows the location of installed pump in Hydraulic Lab of PETCO. Experimental liquid specifications are listed in Table 2.
Pump efficiency is calculated as following:
pump
gQH P
(9)
where P is pump power and is calculated as:
. . E M E M
P P (10)
where PEM and
η
EM are electromotor power andefficiency, respectively.
4. RESULTS AND DISCUSSION
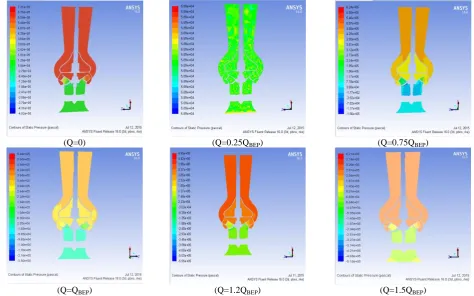
The simulations were performed for six flow rates corresponding to about 0% (shut off point), 25%, 75%, 100%, 120% and 150% of the nominal flow rate (QBEP). Figures 6 and 7 show static pressure contours for different flow rates in x and y-axis directions, respectively.
(a)
(b)
Figure 5. VS1 pump a) test setup and b) test location
TABLE 2. Test water characteristics
Value Characteristics
30 Temperature (˚C)
1.75 × 10⁻⁶ Viscosity (m2/s)
1050 Density (kg/m3)
2.5 Insoluble solid particle amount (kg/m3)
50 Dissolved particle amount (kg/m3)
As these figures reveal, the pressure increases gradually along both impeller and diffuser passage and has higher pressure on pressure side than suction side for each flow rate.
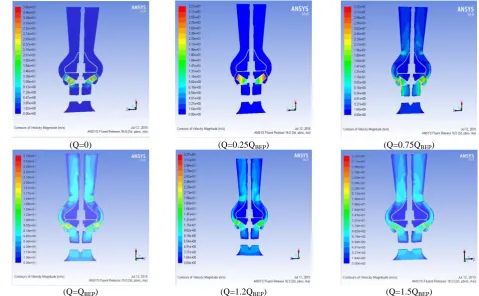
Normally, the higher pressure appears on the pressure surface rather than on the suction surface on each blade as illustrated in Figure 6. Pressure increase in y-axis as seen in Figure 7, confirm the correct impeller rotating direction. Velocity contour in the numerical simulations performed at each flow rate in x-axis and y-axis can be observed in Figures 8 and 9. Here is clearly visible that the velocity increases as the fluid moves towards to the discharge of the impeller and diffuser.
(Q=0) (Q=0.25QBEP) (Q=0.75QBEP)
(Q=QBEP) (Q=1.2QBEP) (Q=1.5QBEP)
Figure 6. Static pressure contour in x-axis direction.
(Q=0) (Q=0.25QBEP) (Q=0.75QBEP)
(Q=QBEP) (Q=1.2QBEP) (Q=1.5QBEP)
(Q=0) (Q=0.25QBEP) (Q=0.75QBEP)
(Q=QBEP) (Q=1.2QBEP) (Q=1.5QBEP)
Figure 8. Velocity distribution contour in x-axis direction.
(Q=0) (Q=0.25QBEP) (Q=0.75QBEP)
(Q=QBEP) (Q=1.2QBEP) (Q=1.5QBEP)
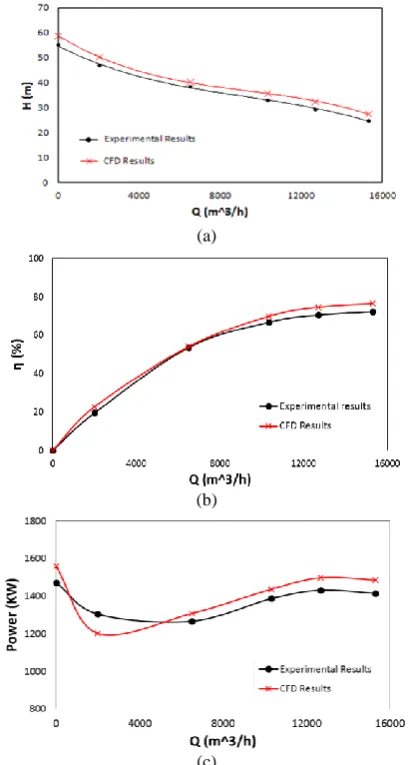
(a)
(b)
(c)
Figure 10. Experimental and numerical results comparison for
a) head, b) efficiency and c) power.
As illustrated in Figure 10-b, in higher flow rates, the difference between numerical efficiency and experimental one is increasing which is due to turbulent flow in high flow rates. Figure 10-c shows that numerical and experimental power-flow rate curve is sinusoidal.
5. CONCLUSION
In this research the CFD analysis of first homemade mixed-flow vertically suspended VS1 pump with flow rate of 10330 m3/h was performed. Impeller, diffuser, suction, discharge and other parts of pump were designed in Catia according to hydraulic profile of impeller blade and diffuser vane extracted from CFTurbo. The simulation was conducted in Ansys-Fluent using realizable k- turbulence model for 6
different flow rates (Q=0, Q=2000 m3/h, Q=6500 m3/h, Q=10330 m3/h, Q=12700 m3/h and Q=15300 m3/h). The static pressure and velocity distribution contours confirmed correct rotational direction of impeller. Numerical results were compared with the experimental ones, and acceptable correlation was found between the two sets of results. CFD proved to be a reliable tool to qualitatively investigate trends.
6. ACKNOWLEDGEMENT
The authors thank Pump and Turbine Company (PETCO) and Persian Gulf Star Oil Company (PGSOC) for their kind cooperation and financial support.
6. REFERENCES
1. Bhawar, P.D. and Patwardhan, M., "Design and analysis of boiler feed pump casing working at high temperature by using ansys".
2. Standard, A., 610: Centrifugal pumps for petroleum, petrochemical and natural gas industries., American Petroleum Institute, Washington, (2003).
3. Lobanoff, V.S. and Ross, R.R., "Centrifugal pumps: Design and application, Elsevier, (2013).
4. Pessoa, R. and Prado, M., "Two-phase flow performance for electrical submersible pump stages", SPE Production & Facilities, Vol. 18, No. 01, (2003), 13-27.
5. Zhou, D. and Sachdeva, R., "Simple model of electric submersible pump in gassy well", Journal of Petroleum Science and Engineering, Vol. 70, No. 3, (2010), 204-213.
6. Gamboa, J. and Prado, M.G., "Visualization study of performance breakdown in two-phase performance of an electrical submersible pump", in Proceedings of the Twenty-Sixth International Pump Users Symposium., (2010).
7. Moosavi, B., Alemrajabi, A., Jafarian, A. and Arablu, M., "Cfd simulation of a multi-mesh pulse tube regenerator (research note)", International Journal of Engineering-Transactions A: Basics, Vol. 28, No. 1, (2014), 121.
8. Skrzypacz, J., "Numerical modelling of flow phenomena in a pump with a multi-piped impeller", Chemical Engineering and Processing: Process Intensification, Vol. 75, (2014), 58-66. 9. Barrio, R., Parrondo, J. and Blanco, E., "Numerical analysis of
the unsteady flow in the near-tongue region in a volute-type centrifugal pump for different operating points", Computers & Fluids, Vol. 39, No. 5, (2010), 859-870.
10. Spence, R. and Amaral-Teixeira, J., "A cfd parametric study of geometrical variations on the pressure pulsations and performance characteristics of a centrifugal pump", Computers & Fluids, Vol. 38, No. 6, (2009), 1243-1257.
11. Medvitz, R.B., Kunz, R.F., Boger, D.A., Lindau, J.W., Yocum, A.M. and Pauley, L.L., "Performance analysis of cavitating flow in centrifugal pumps using multiphase cfd", Journal of Fluids Engineering, Vol. 124, No. 2, (2002), 377-383.
13. Jafarzadeh, B., Hajari, A., Alishahi, M. and Akbari, M., "The flow simulation of a low-specific-speed high-speed centrifugal pump", Applied Mathematical Modelling, Vol. 35, No. 1, (2011), 242-249.
14. Li, W.-G., "Effects of viscosity on turbine mode performance and flow of a low specific speed centrifugal pump", Applied Mathematical Modelling, Vol. 40, No. 2, (2016), 904-926. 15. Su, X., Huang, S., Zhang, X. and Yang, S., "Numerical research
on unsteady flow rate characteristics of pump as turbine",
Renewable Energy, Vol. 94, (2016), 488-495.
16. Caridad, J. and Kenyery, F., "Cfd analysis of electric submersible pumps (esp) handling two-phase mixtures", Journal of Energy Resources Technology, Vol. 126, No. 2, (2004), 99-104.
17. Maitelli, C.d.P., Bezerra, F. and Mata, W., "Simulation of flow in a centrifugal pump of esp systems using computational fluid dynamics", Brazilian Journal of Petroleum and Gas, Vol. 4, No. 1, (2010).
18. Stel, H., Sirino, T., Ponce, F., Chiva, S. and Morales, R., "Numerical investigation of the flow in a multistage electric submersible pump", Journal of Petroleum Science and Engineering, Vol. 136, (2015), 41-54.
19. Pineda, H., Biazussi, J., Lopez, F., Oliveira, B., Carvalho, R.D., Bannwart, A.C. and Ratkovich, N., "Phase distribution analysis in an electrical submersible pump (esp) inlet handling water–air two-phase flow using computational fluid dynamics (cfd)",
Journal of Petroleum Science and Engineering, Vol. 139, (2016), 49-61.
20. Vazifeshenas, Y., Farhadi, M., Sedighi, K. and Shafaghat, R., "Numerical simulation of cavitation in mixed flow pump",
International Journal of Engineering-Transactions C: Aspects, Vol. 28, No. 6, (2015), 956.
21. Shojaeefard, M., Tahani, M., Ehghaghi, M., Fallahian, M. and Beglari, M., "Numerical study of the effects of some geometric characteristics of a centrifugal pump impeller that pumps a viscous fluid", Computers & Fluids, Vol. 60, (2012), 61-70.
Computational Fluid Dynamics Simulation and Experimental
Validation of Hydraulic Performance of a Vertical Suspended API
Pump
RESEARCH NOTE
H. Ayremlouzadeh, J. Ghafouri
Department of Mechanical Engineering, Tabriz Branch, Islamic Azad University, Tabriz, Iran
P A P E R I N F O
Paper history:
Received 07 June 2016
Received in revised form 30 September 2016 Accepted 30 September 2016
Keywords:
Vertical Suspended API Pump Computational Fluid Dynamics Flow Rate
Performance Test
ديكچ ه
پوپ ذیلَت ٍ یحارط یرٍاٌف ُدرتسگ یاّدرتراک ِک قرغتسه یدَوع یاّ
عياٌص سیً ٍ ىداعه ،بلاضاف ٍ بآ عياٌص رد یا
لاس یارت ذًراد زاگ ٍ تفً ٍ یویشٍرتپ یاّ
ٍ تفً ترازٍ تياوح ات .تشاد رارل یترغ یاّرَشک رایتخا رد یداوته
يیسذٌْه شلات پوپ ،)َکتپ( يیترَت ٍ پوپ تکرش
VS1-1200.1300
یتد ات 01001 يیلٍا یارت تعاس رت ةعکه رته
کٌخ رَظٌه ِت سراف جیلخ ُراتس تفً ُاگشيلااپ رد ىٌَکا ٍ ُذیسر ذیلَت ٍ تست ِلحره ِت ٍ یحارط ىاريا رد رات ،یراک
ُرْت ٍ ةصً ِیثش ،رضاح كیمحت ماجًا زا فذّ .تسا ُذش یرادرت
یزاس
CFD
یدَوع پوپ لخاد ىايرج
VS1-1200.1300
یه .ذشات مرً زا ُدافتسا ات لٍا ِلحره رد راسفا
CFTurbo
ُرپ یکیلٍرذیّ لیفٍرپ پوپ رزَیفيد ٍ ًِاٍرپ یاّ
ِس لذه سپس ُذش ذیلَت ِطَتره مرً رد ،تاعطل رياس ٍ ءاسجا ييا یکیًاکه یذعت
راسفا
Catia
رظًدرَه لایس .ذيدرگ ذیلَت
جارختسا مرً دراٍ ٍ ُذش راسفا
Ansys-Fluent
یسًلاَترَت لذه طسَت ِتشگ
K - realizable
نتيرَگلاٍ
SIMPLEC
یتد رد رظً درَه پوپ .ذهآ تسذت تعرس ٍ راشف عيزَت یاّرَتًاک ٍ ِتفرگ رارل لیلحت تحت فلتخه یاّ
ِتفرگ رارل یدرکلوع تست درَه َکتپ تکرش ُاگشياهزآ رد ،شاتًَه ٍ تخاس زا سپ ت جياتً ات یدرکلوع تست جياتً ٍ
ِ
رایست كتاطت ،یدذع لیلحت زا لصاح جياتً ِک ذش ُذّاشه .ذيدرگ ِسيامه یدذع لیلحت زا ُذهآ تسد جياتً ات یتَخ
یتد رد یتح یترجت تسلاات پوپ لخاد لایس ىايرج شاشتغا ٍ یگذیچیپ ِک لاات یاّ
، ىاشً ِک دراد یيَگشیپ ُذٌّد
طسَت لایس ىايرج ةساٌه پوپ رياس ِت ىآ نیوعت تیلتال ٍ ُذش ِئارا یدذع لذه
یه اّ .ذشات