IJE TRANSACTIONS C:Aspects Vol. 26, No. 9, (September 2013) 1017-1030
International Journal of Engineering
J o u r n a l H o m e p a g e : w w w . i j e . i r
Short-term Price-based Unit Commitment of Hydrothermal GenCos: A Pre-emptive
Goal Programming Approach
M. M. Lotfi* a, S. F. Ghaderib
a Department of Industrial Engineering, Yazd University, Yazd, Iran
b Department of Industrial Engineering, University of Tehran, Tehran, Iran
P A P E R I N F O
Paper history:
Received 08 February 2013 Received in revised form 07 April 2013 Accepted 16 May 2013
Keywords:
Unit Commitment Scheduling Goal Programming Deregulated Market Emission
A B S T R A C T
The solution of single-objective unit commitment problems for generation companies participating in deregulated markets may not directly be implementable mainly because of neglecting some conflicting secondary objectives arising from policy-making at internal/external environment. Benefiting an efficient multi-objective approach to improve the applicability of price-based unit commitment solutions, a novel mixed integer linear preemptive goal programming model is developed in which several complementary objectives with lower relative importances are also incorporated. Non-linear characteristic curves of generating units are approximated by piece-wise linear ones. The experimental results inspiring by a real case demonstrate the efficiency of our approach. An important capability of the model is that it can easily and efficiently be matched with a various line of unit commitment problems.
doi:10.5829/idosi.ije.2013.26.09c.09
NOMENCLATURE
t Hourly time period (t=1,2,…,T) allow
rt
P Transmission capacity toward region r in hour t
e Emission index (e=Co2,So2,Nox) Prrtcont Negotiable BLC price in region r and hour t k Thermal technology (k={st,gt,cc} for steam, gas-turbine, combined cycle) Prpool
rt PCM price in region r and hour t
i/j Thermal/hydro unit index Probres
t Probability that spinning reserve in region GLN and hour t is called
r Tradable regions of national grid r={GLN, MZN, ZJN, AZN, RAZ} Prres
t Price of allocated spinning reserve in region GLN and hour t
Ik Set of thermal units with generation technology k Prtfu Fuel price in region GLN and hour t
min max/
i
i P
P Nominal/minimal generation capacity of thermal unit i Prem
e Price of allowance for emission e
1
0£Avit£ Availability of thermal unit i in hour t. It converts nominal generation capacities into maximum actual ones. Probeme Probability of trading allowance for emission e
dn up/
i
i Rmp
Rmp Ramping up/down limit of thermal unit i max
e
Em Available allowance for emission e in scheduling horizon
sd su/
i
i Rmp
Rmp Start-up/Shut-down ramping limit of thermal unit i PF Payoff of scheduling horizon (G1) max
i
Rmp Maximum sustained ramp rate for thermal unit i (MW/Min)
share
rt
P GEMS in region r and hour t (G2)
i
i Sd
Su / Start-up/shut-down cost for thermal unit i (without fuel
off on/
i
i H
H Minimum on/off hours of thermal unit i θ Portion of BLCs in payoff of scheduling horizon (G4)
off 0 on
0 / i
i R
R Number of hours in which thermal unit i has been on/off at the beginning lrealk
Contribution of technology k in generation (G5)
å
real=1k k l off on/ i i X
X Number of hours in which unit i must be on/off if on/off at the beginning
res gt
l Contribution of gas-turbine units in spinning reserve (G6) }} ). ( , min{ , 0 max{ cmt 0 on 0 on on i i i
i T H R I
X = - (2) β Portion of startup/shutdown costs in total costs (G7)
)}} 1 ).( ( , min{ , 0 max{ cmt 0 off 0 off off i i i
i T H R I
X = - - (3) Decision Variables
max
i
Fu Maximum supply of fuel in thermal unit i and scheduling horizon res real/ t i t i P
P hour t (MW) Real generation/Allocated spinning reserve of thermal unit i in
m i
f Slope of segment m in linearized heat rate curve of thermal unit i
prod
m it
P unit i (MW) Generation (real+reserve) of segment m in heat rate curve of
min 1i
f Required fuel in thermal unit i to startup and bring up to minimal capacity
cmt t i
I Commitment status of thermal unit i in hour t
min 2i
f Required fuel to maintain thermal unit i at minimal capacity ( min 2
min 1i fi
f > ) duit/udit
0/1 start-up/shutdown indicator for thermal unit i in hour t
duit=1 when Iitcmt-Iitcmt-1=1
udit=1 when Iitcmt-1-Iitcmt =1
prod
m i
P Possible generation of segment m in linearized heat rate
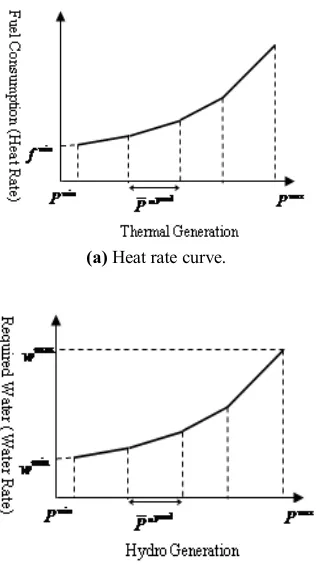
curve of unit i Fit(x) Figure 1a) Required fuel for generation x in thermal unit i and hour t (see
eei Coefficient of producing emission e in thermal unit i
ï î ï í ì + -+ = £ £ + =
å
å
m m it m i it it i it i it m i m it m m it it P f du I f du f x F P P P I P x prod prod prod prod . ) .( . ) ( ; 0 , . cmt min 2 min 1 cmt min i (4) min max/ j j PP Nominal/minimal generation capacity of hydro unit j real/ res
t j t
j P
P Real generation/Allocated spinning reserve of hydro unit j in hour t(MW)
1
0£Avjt£ Availability of hydro unit j in hour t
prod
n jt
P Generation (real+reserve) of segment n in water-to-power curve of unit j
j
j Sd
Su / Start-up/shut-down cost for hydro unit j cmt t j
I Commitment status of hydro unit j in hour t
off on/
j
j H
H Minimum on/off hours of hydro unit j dujt/udjt
0/1 start-up/shutdown indicator for hydro unit j in hour t
dujt=1 when Icmtjt -Icmtjt-1=1
udjt=1 when Icmtjt-1-Icmtjt =1
off 0 on
0/ j
j R
R Number of hours in which unit j has been on/off at the beginning
n jt
s
0/1 variable for generation at segment n of water-to-power curve of unit j in hour toff on/
j
j X
X Number of hours in which unit j must be on/off if on/off at the beginning Wjt(x) Water discharge for generation x in unit j and hour tFigure 1b) (see
n j
w Slope of segment n in linearized water-to-power
conversion curve of unit j ï
î ï í ì Î + = £ £ + =
å
å
+ } 1 , 0 { ; . . ) ( ; . . , . prod prod prod prod prod cmt min 1 cmt min n jt n n jt n j jt j jt n jt n j n jt n jt n j n n jt jt j s P w I w x W s P P s P P I P x (5) max min/ j j ww Lower and upper limits on water discharge for hydro unit j
As shown in Figure 1 and expressed by Equation sets (4)-(5), the linearized heat rate and water rate curves of thermal/hydro units are approximated to avoid non-linearity.
max min/
j
j V
V Lower and upper limits on reservoir volume of unit j (V0:
initial volume) Prts-cont/Prtb-cont Selling/buying via BLCs in region r and hour t(MW) jt
NI Net inflow of unit j in hour t (natural inflow-spillage+upstream discharge)
pool b pool s- /
-rt
rt P
P Selling/buying through PCM in region r and hour t (MW)
prod
n j
P Possible generation of segment n in linearized
water-to-power curve of unit j s s
G
G p
1019 M. M. Lotfi and S. F. Ghaderi/ IJE TRANSACTIONS C:Aspects Vol. 26, No. 9, (September 2013) 1017-1030
1. INTRODUCTION
Unit commitment scheduling (UCS) in regulated electric power systems was to optimize generating sources (i.e., cost minimization) for serving load while satisfying some prevailing constraints. Generation companies (GenCo), as the major entities in supply-side of power systems, operate and maintain power generating plants [1]. As electric power markets are deregulated, GenCos are engaged in a more complex and competitive problem referred to as price-based unit commitment (PBUC). Consequently, they search for the efficient tools to solve their own PBUC for a compromise solution taking operational efficiency and market responsiveness simultaneously into account.
GenCos usually own a diverse collection of power plants with different technologies each one has its advantageous and limitations. Although combustion turbine units are of low efficiency, they are ideal sources for providing reserves due to quick start-up [2]. In contrast, steam units are reliable and high-capacity sources for real generation even though they suffer from the long outage periods and serious emission damages. Combined-cycle units usually have the key advantageous of heat-rate efficiency as well as cost effectiveness. Hydroelectric generation with low costs, high efficiency and no emission damage is, meanwhile, a function of some limiting factors. Thus, each technology has its place in generation and GenCos could benefit this diversity to gain more flexibility and responsiveness in the markets. In restructured power markets, short-term PBUC models of GenCos- usually run over a day up to a week time horizon- are developed for maximizing the profit. Satisfying load is not as a mandatory task; rather, the motivating factor to change commitment status of generating units is price which, as stated in [3], always is not fully directive due to some market inefficiencies. In addition, GenCos may be entered in any market; so they should have accurate forecasts of market parameters. To handle such market environment, numerous optimization models and solution techniques have been presented for the single-objective PBUC problem.
The use of MILP approach and corresponding techniques is growing due to some apparent advantageous including global optimality, a more accurate measure of optimality, and enhanced modeling capabilities [3]. An MIP-based formulation for a hydrothermal problem is proposed and its efficiency compared to the Lagrangian Relaxation is demonstrated [3]. A model and solution methodology for PBUC problem of a price-taker GenCo in a day-ahead deregulated power market is developed [4]. A dual approach is proposed for the short-term hydrothermal UCS problem taking bilateral transactions and spot market trades simultaneously into account [5]. A weekly optimization process including data estimation, linearized
UCS, and nonlinear scheduling refinement is proposed for a GenCo in competitive markets [6]. An MILP formulation for day-ahead hydrothermal UCS is provided in which non-convex variable and non-linear start-up cost functions of thermal as well as non-concave power-discharge characteristics of hydro units are considered [7]. An optimization method for UCS of pumped-storage plants is proposed considering the energy demand, economics, and environmental constraints [8]. A dynamic programming solution is developed for the nonlinear and non-concave short-term UCS of a hydro plant in a pool-based electricity market [9]. An efficient method is presented for the profit-based optimal self-scheduling of a hydroelectric company in the pool-based day-ahead electricity market [10]. A mixed-integer non-linear optimization approach is developed for short-term UCS of hydro plants considering the non-linear operational characteristics [11]. A mixed-integer quadratic programming is proposed to solve the UCS problem of large-scale power systems considering interruptible loads [12]. The problem of optimal economic operation of hydrothermal electric power systems is solved using powerful continuation method [13].
In general, the solution of single-objective PBUC models may not immediately be implemented in the operations of power systems because the decision makers really have the other criteria besides the profit to be well-satisfied while they do not address such criteria when developing and solving PBUC models. Accordingly, to single-objective solutions be applicable in practice, they should usually be modified based on the other secondary criteria. So, a critical question would arise in the time of using PBUC solutions: if GenCo is somehow indifferent to a range of profit goal, what are the other objectives to have a well-satisfied decision maker? For example, what decision will be made if the credibility and market share of the GenCo can be improved through meeting a larger portion of the market demand or providing the reserves even though with a lesser revenue? Or, what if the assignment of a suitable contribution to the stable-revenue bilateral contracts can mitigate the risk of trade portfolio in the competitive market? Therefore, to improve the satisfaction and applicability of the profit-based solutions of short-term UCS problems, the other complementary criteria are needed in model development. In this regards, all types of the multi-objective approach and corresponding solution techniques are as straightforward choices.
emission objectives is taken simultaneously into account [16]. A bi-objective nonlinear emission/economic dispatch model is formulated for a regulated system [17]. The simultaneous address of emission along with the fuel cost for short-term UCS problem of thermal units is modeled by a multi-objective optimization approach [18].
As observed, the existing models are all bi-objective assuming demand fulfillment or emission reduction as the second objective. However, in our belief, the other more-or-less critical objectives should be incorporated to improve the applicability and rationality of solutions. In fact, we think that in real-world conditions, GenCos must make the preferred decision through establishing a reasonable trade-off between several conflicting goals beloved by the different stakeholders. This is demonstrated by the aid of some experiments using the numerical data in section 3.
Our idea and motivation is basically emanated by observations gained in Guilan regional electric company (GREC) in Iran enjoying two gas-fired thermal (“Lushan” and “Guilan”) and one hydro (“Sepidroud”) plants in the province of Guilan. Applying a single-objective PBUC model for day-ahead market scheduling, GREC usually needs to modify corresponding outcomes when implementing them in real operations of generating units. However, The time-consuming modification process, becomes disturbing together with significant errors because in this manner, final implemented solution may be far from optimality. It seems that adoption of a relevant multiple-objective modeling approach can be an open sesame.
Among various multi-objective approaches, goal programming (GP) originated by Charnes, et al. [19], is one of the most powerful and well-applied ones for the modeling, analyzing and solving real-world problems through assigning specific targets to several objectives. A key element of a GP model is the achievement function that minimizes the degree of unwanted deviation variables of the goals [20]. Each type of achievement function leads to a different GP variant. A most widely used form of GP is the pre-emptive GP (PGP). The achievement function of a PGP model which implies a non-compensatory structure of preferences consists of an ordered vector whose dimension coincides with a number of priority levels established in the model. Each component in this vector represents the unwanted deviation variables of the goals placed in the corresponding priority level. Since the multi-objective UCS problem is the place of competition for several conflicting objectives with actually different preemptive priorities, we propose a PGP approach in this paper. The analytical structure of a PGP model is as Equation (1) [21]:
Achievement function:
} ) (
,..., ) (
,..., ) (
{ Min Lex
1
å
å
å
Î Î
Î
+ +
+
K
r iP
i i i i P
i
i i i i P
i
i i i
in bp an b p an b p
a
Goals and strict constraints:
F X
K r P i k i p n G p n X
fi i i i i i r
Î
= Î =
³ =
-+ ; , 0 1,2,..., ; ; 1,2,... )
( (1)
Gi is the target level for ith goal, ni and pi are the negative and positive deviations from Gi, Pr is the index set of goals placed in rth priority level, X is the vector of decision variables, F is the feasible set of strict constraints, and αi and βi are defined as follows:
;
i i
i k
w
-=
a ni is unwanted ;
i i
i k
w+
=
b pi is unwanted
where, wi and ki are the weights reflecting preferential and normalizing purposes attached to achievement function of ith goal. “Lex” means that there are no finite trades-off among the goals placed in different priority levels.
Thus, The scope of the paper is to remove the disturbing modification phase after the solution of PBUC problems and to improve the applicability short-term PBUC solutions for hydrothermal GenCos in deregulated hybrid markets. This task is done by proposing a new mixed-integer linear pre-emptive goal programming (MILPGP) model by which a reasonable trade-off between several important conflicting objectives with different priorities is provided. The yielded solution will directly implantable- i.e., without any retouching- in real operation of power systems. The problem description and model formulation is presented in section 2. We implement the proposed approach for GREC and provide computational and analytical results in section 3. Finally, section 4 is devoted to concluding remarks and future direction.
2. PROBLEM FORMULATION
1021 M. M. Lotfi and S. F. Ghaderi/ IJE TRANSACTIONS C:Aspects Vol. 26, No. 9, (September 2013) 1017-1030
reserve market applying “payment for reserve allocated” method under which reserve price is received even for the periods in which it is allocated and not called. If it is called to generate, the electricity spot price is received. We need to provide accurate estimations of market prices (for electric power, reserve, fuel, and emission allowance) which all are introduced regionally in our models. In this regard, we will discuss later in section 3. Environmental damage, especially emission, of power generation can be quite serious; hence, a special heed should be taken in this area. Several mechanisms of emission involvement have been introduced in the literature. Some models take emission limits as inviolable constraints [3] while the other ones permit breaking emission allowances with imposed charges [22]. A recent approach is that emission production as a second objective is minimized [16-18]. Another recent approach is to consider cap-and-trade emission mechanism. A possibilistic programming approach for mid-term PBUC is developed in which cap-and-trade mechanism is addressed through assuming a given probability and price for trading emission allowances [23]. In the PBUC models, periodic variations in the energy price (i.e., the value of generation) as a function of the demands can lead to an increase or decrease in the generation and so in the demand for emission allowance. This can seriously affect the emission price and its trade probability from period to period. So, in this work, we apply the method of [23] to formulate emission trade scheme.
Notably, in the proposed approach, we try to appropriately incorporate the competition elements through (1) targeting market share in the considered multi-participant markets; (2) proposing a system based on the "probability of calling" in spinning reserve market; (3) Modeling "cap-and-trade" mechanism for emission allowances which is consistent to the competitive markets [2]; (4) introducing the model regionally through which the differences between the regions due to the presence of multiple competitors are properly addressed; (5) Using certain bilateral transactions to reduce the risk of pool-based trades emanated by the uncertain competitive markets.
2. 1. Goals and Hierarchy Hereunder, the
proposed objectives with different preemptive priorities for the short-term operation of considered power system and the structure of PGP are presented.
The goal in the first priority level:
G1: As the primary and most important objective, at least a given total payoff is desired.
The goals in the second priority level:
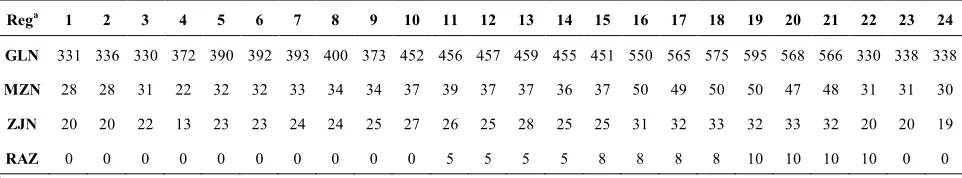
G2: It is preferred to meet a targeted market share in each region and period.
G3: GREC would like to allocate a desired spinning reserve in GLN region.
In PBUC environments with several market participants, instead of forecasting market load and required spinning reserve, GenCos, with the aim of efficient challenging in the competition, need to target the electricity market share (GEMS) and the allocated spinning reserve (ASR) in each region. The idea of targeting market share was first introduced by [23] which are also considered in this paper with some adjustments. This parameter can be specified using an appropriate short-term load forecasting algorithm inspired by some aspects of goal setting. Reserves should be provided locally; so, we consider providing spinning reserve only for GLN. As usual, ASR is assumed to be as a percentage of GEMS.
The goals in the third priority level:
G4: At least a given portion of BLCs in trade portfolio is desired.
BLCs provide a stable source of revenue due to certainty. Sale contracts significantly reduce revenue-creation risks while buy contracts protect against the outages. Sales in PCM are usually more profitable than those through BLCs; however, revenue from PCM is not consistent across time. Accordingly, an interesting problem is to design a portfolio of BLCs and PCM trades in order to reduce the risk of yielded payoff. The decisions regarding the BLCs must naturally be made in a long-term/mid-term time window and the results be imposed on the short-term models. Therefore, we assume that the target value of this goal comes from the solution of a long-term model such as the one in [23].
G5: It is desired to assign a given contribution in generation to each technology.
G6: It is desired to assign a given contribution in ASR to gas-turbine units.
In the solution of single-objective PBUC models, non-efficient technologies will, in essence, lose the competition whereas, as mentioned in section 1, each technology has its place in generation and reserve. Therefore, GenCos naturally would like to assign to each technology an appropriate contribution both in generation and reserve in order to reach the best operation combination of plants.
G7: At most a given portion of startup/shutdown costs in total costs is desired.
(a) Heat rate curve.
(b) Water-to-power conversion curve
Figure 1. Linearized characteristic curve of a thermal/hydro
unit.
2. 2. Proposed FMILGP Model In this subsection,
we present a three level pre-emptive goal program through models A to C in order to hierarchicallyincorporate the proposed goals in UCS formulation. The proposed hierarchical modeling approach shows the pre-emptive priorities of the goals at different levels.
Model A for the first priority level:
1
G
min zA =n (6)
Subject to:
Goal constraint:
G1: R-C+nG1 =PF, nG1 ³0 (7)
Notably, the negative unwanted deviation from the target value of profit goal in the first priority level is calculated in (7) and minimized in (6).
Hourly balance equation:
t P P P P P P
r rt rt rt rt
j jt i it " = -+ +
+
å
å
å
real real ( b-pool b-cont s-pool s-cont) 0 (8)Hourly generation limits: (9)
t i I P Av P P I
Pimin.itcmt£ itreal+ itres£ it. imax.itcmt ",
t j I P Av P P I
Pj . jt jt jt jt. j .jt ,
cmt max res
real cmt
min £ + £ "
(10)
Thermal ramping limits:
t i I Rmp I Rmp P
Pit it i . it i .(1 icmtt ); ,
1 , su cmt 1 , up real 1 ,
real- £ + - "
-- (11) t i I Rmp I Rmp P
Pirealt itreal idn. itcmt isd.(1 itcmt); , 1
,- - £ + - " (12)
t i I
Rmp
Pitres£10. imax.itcmt; ", (13)
Allocation of spinning reserve based on the maximum sustained ramp rates is done in (13).
Minimum up/down limits and startup/shutdown scheduling
i I I i i X t it X t
it + = "
-
å
å
= = ; 0 ) 1 ( off on 1 cmt 1 cmt j I I j j X t jt X tjt + = "
-
å
å
= = ; 0 ) 1 ( off on 1 cmt 1 cmt (14) t i I I duudit- it = icmt,t-1- itcmt; ",
t j I
I du
udjt- jt = cmtj,t-1- cmtjt ; ",
(15) t j du ud t i du
udit+ it£1; ", jt+ jt£1; ", (16)
i T Y t du ud i H t T t i it i " + = £ +
å
+-+ = ; ,..., 1 ; 1 on ) 1 , ( min 1 off x x i T Y t ud
du Tt H i
t i it i " + = £ +
å
+-+ = ; ,..., 1 ; 1 off ) 1 , ( min 1 on x x (17) j T Y t du ud j H t T t j jt j " + = £ +
å
-+ + = ; ,..., 1 ; 1 on ) 1 , ( min 1 off x x j T Y t ud du j H t T t j jt j " + = £ +å
-+ + = ; ,..., 1 ; 1 off ) 1 , ( min 1 on x x (18) t j i du du ud ud IIitcmt, cmtjt , it, jt, it, jtÎ{0,1}; ", , (19)
Constraint (14) forces the number of hours in which units need to be on/off at the beginning. Constraint (15) denotes the relation between startup/shutdown indicators and commitment status of units. Based on the startup/shutdown indicators, the minimum up/down limits of units after the first startup/shutdown are addressed in (17)-(18).
1023 M. M. Lotfi and S. F. Ghaderi/ IJE TRANSACTIONS C:Aspects Vol. 26, No. 9, (September 2013) 1017-1030 i Fu P P F i T t it it
it + £ "
å
= ; ) ( max 1 res real e Em EM EM P Pe e e e
T
t i ei it it
" = D -D -+ + -=
åå
.( ) ( ) max;1
res
real
(21)
Constraint (21) calculates two variables DEm+/DEm- to determine the upper/lower-side deviations from emission allowances. They are used to present emission payoff in (26). For better understanding of (21), the interested reader can see the work of authors in [23].
Balance equation, reservoir limits and water discharge limit for hydro units: t j P P W NI V
Vjt jt jt jt( jt jt ) 0; ,
res real 1
,- - + - + = " (22)
t j V
V
Vj jt j ; ,
max
min£ £ "
(23) t j I W P P
Wjt( jtreal+ jtres)£ jmax. cmtjt ; ",
(24) Equations (4)-(5) are applied, constraints (20), (22), and (24).
Hourly transmission capacity limit:
t r P P P P
Prtb-pool+ rts-pool+ rtb-cont+ rts-cont£ rtallow; ", (25)
Revenue, startup/shutdown costs and total costs functions:
åå
å
å
å
= -= + + + + -= T t r rt rt rt rt T
t t t t t i it j jt
P P P P R 1 cont s cont pool s pool 1 res res pool res res res ) . Pr . (Pr )} ].( Pr . Prob ).Pr Prob 1 {[(
å
D --D ++
e e e e e
EM
EM )
.( Pr . Probem em
(26)
å å
=å
ïþ ï ý ü ï î ï í ì + + + -+ = T t j jt jt jt jt
i it t i i it it it
ud Sd du Su ud Sd du f f Su C 1 min 2 min 1 fu sd ] . . [ ]} . )]. .( Pr {[( (27)
å
å
= ïþ ï ý ü ïî ï í ì -+ + -= Tt i i i it
it it it t it it t t du f f P P F P F C
1 2min
min 1 res real res real res fu ] )]. ( ) ( . Prob ) ( ). Prob 1 [( . Pr sd T t r rt rt rt
rt P + P +C
+
åå
= -1 cont b cont pool bpool. Pr . ]
[Pr (28)
Total revenues in (26) are equal to the sum of revenues of PCM and BLC sales, revenues of spinning reserve, and outcome of emission trades. Total costs in (28) is including fuel costs for real and reserve generation, expenses of PCM and BLC buys, and startup/shutdown costs (Equation (27) is used).
Model B for the second priority level:
å
å
= + + + = T t t t rt r rtB w n p w n p
z 1 G G G G G
G. ( ) .( )]
[
min 2 2 2 3 3 3 (29)
Subject to:
Strict constraints (8)-(25)
Constraint for imposing solution of model A on model B: ; 1 G n PF C
R- ³ - (30)
Minimum value of nG1 (solution of model A) is imposed on model B by constraint (30).
Goal constraints:
G2:(Prts-pool +Prts-cont)+nrtG2 -prtG2 =Prtshare, "r,t (31)
G3: P P n p P t
t t t j jt i
it +
å
+ - = "å
res res G3 G3 res,; 0 , ,
, 2 3 3
2 G G G
G ³
t t rt
rt p n p
n
(32)
Notably, the negative and positive unwanted deviations from the target values of two goals in the second priority level are calculated in (31)-(32) and their weighted sum is minimized in (29). As seen in (2), the relative importances of the goals at a same priority level may be different; so, we introduce the weight coefficients in (29) to denote the relative importances of G2 and G3.
Model C for the third priority level:
7 7 6 6 5 5 5 4 4 G G G gt G 1 G G G G G . . . ) ( . . . min n w n C w p n C w n w z K k k k C + + + + =
å
= (33)
Subject to:
Strict constraints (8)-(25), (30)
Constraints for imposing solution of model B on model C: t r p n P P
Prt rt ) rt ( rt rt ); ,
( s-pool + s-cont = share - G2 - G2 " (34)
t p
n P P
P t t t
j jt i
it +
å
= - - "å
res res res ( G3 G3); (35)Again, the minimum values of unwanted deviations from G2 and G3 (solution of model B) are imposed on model C by constraints (34)-(35).
Goal constraints:
G4: [Pr .
(
)
] G4 .( );1
cont b cont
cont P P n R C
T
t r
rt s rt
rt - + =
-å -å
=
-- q (36)
G5: P n p P k
T t i it k k k T
t i I it k " = -+
åå
åå
= = Î , . ) ( 1 real real G G 1real 5 5 l
(37)
G6: . , {gt}
1 res res gt G gt 1
res + 6 =
å å
=å å
= = Î k P n P T t i it Tt i I it
k
l (38)
G7: Csd-pG7 =b.C, nG4,nkG5,pkG5,nkG6,pG7 ³0 (39)
the various terms of (33) have different measurement units, which forbid them to add, the normalizing parameter C, as the average generation cost for each MW, is multiplied by the second and third terms.
3. IMPLEMENTATION AND ANALYSIS
In this section, the proposed approach is implemented to determine hourly unit commitment scheduling of GREC’s units in day-ahead market. Tables 1-6 give the details of input data for GREC while Tables 7-8 denote the goal target values and their relative weights. The goal target values and weights were specified using the existing historical data as well as GREC’s criteria. Mathematical models were developed by GAMS modeling language using the CPLEX solver. First, model A was solved for the minimum unwanted deviation from the goal placed at 1th priority level (i.e., profit). After that, by imposing the solution of model A on model B through connecting constraint (30), the weighted sum of unwanted deviations from the goals placed at 2th priority level (i.e., GEMS and ASR) were minimized. Finally, through imposing the optimum solutions of A and B on model C, it was solved to establish a compromise between the remaining less important goals placed at 3th priority level of goal hierarchy by minimizing the weighted sum of unwanted deviations. The solution of model C is in fact as a trade-off between the profit and the other complementary objectives so that the corresponding preemptions at different levels as well as the relative importances at a same level are simultaneously considered.
3. 1. Discussion At first, we provide a discussion
on the proposed model structure. Different formulations of short-term UCS problems are among the complex mathematical programming models. The constraints including ramp rate limits, unit start-up and shut-down, hydro balance in the reservoir of hydroelectric systems, and spinning reserve limits are, in essence, as the complicating ones.
The MIP optimization packages such as GAMS can solve the models to global optimality or guarantee the solutions with acceptable relative optimality gaps. These packages benefit from a very efficient technique named as branch-and-cut which is an effective combination of two well-known MIP solution techniques- i.e., branch-and-bound and cutting plane. The required computation time for optimizing a large-scale MIP depends basically upon the capabilities of formulation. As Williams [24] stated, a capable MIP formulation (1) employs the binary variables to facilitate the branching process in MIP technique and (2) includes meaningful constraints for a more tightening of the related LP-relaxation. Table 9 summarizes the structure of the proposed model for medium-sized GREC (13 thermal and 5 hydro units) as well as a typical large-scale GenCo (80 thermal and 20 hydro units).
TABLE 2. Linearized heat rate curve
Segment Slope (M
3×10³/MW) Possible Generation (MW)
1-2 3-4 1-9 1-2 3-4 1-6 7-9
1 0.246 0.294 0.192 13.8 6.0 14.3 16.5
2 0.253 0.301 0.197 16.4 7.2 17.2 19.8
3 0.258 0.306 0.202 20.6 9.1 21.5 24.9
4 0.261 0.309 0.205 16.4 7.2 17.2 19.8
5 0.265 0.313 0.210 13.8 6.0 14.3 16.5
Fuel at min capacity (startup) 10.0 4.5 9.5 9.5
Fuel at min capacity (on) 6.5 3.0 6.25 6.25
TABLE 3. Emission data
Type Max (tons)
Price ($/ton)
Trade Probability
Coefficient (tons/MW)
st gt cc
Co2 1600 14.5 0.45 0.24550 0.0017410 0.0004488
So2 13 50.5 0.22 0.20825 0.0014769 0.0003807
Nox 3 50.5 0.22 0.15200 0.0010780 0.0002778
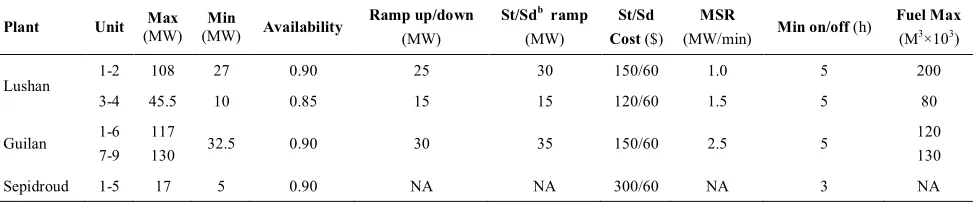
TABLE 1. Thermal/hydro capacity (MW/h) and fuel a
Plant Unit (MW) Max (MW) Min Availability Ramp up/down (MW)
St/Sdb ramp (MW)
St/Sd Cost ($)
MSR
(MW/min) Min on/off (h)
Fuel Max (M3×103)
Lushan 1-2 108 27 0.90 25 30 150/60 1.0 5 200
3-4 45.5 10 0.85 15 15 120/60 1.5 5 80
Guilan 1-6 7-9
117
130 32.5 0.90 30 35 150/60 2.5 5
120 130
Sepidroud 1-5 17 5 0.90 NA NA 300/60 NA 3 NA
1025 M. M. Lotfi and S. F. Ghaderi/ IJE TRANSACTIONS C:Aspects Vol. 26, No. 9, (September 2013) 1017-1030
TABLE 4. Water-to-power conversion curvea
Segment Slope (M
3×10³/MW) Possible Generation Net Inflow (103×M3/h)
1 2 3 4 5 (MW) 1 2 3 4 5 6 7 8 9 10 11 12
1 6.00 6.03 6.00 6.10 6.10 3.4 83.9 87.4 89.6 82.1 89.4 87.6 87.6 87.4 83.4 89.3 86.1 86.1
2 6.07 6.10 6.08 6.16 6.17 5.2 13 14 15 16 17 18 19 20 21 22 23 24
3 6.12 6.15 6.12 6.17 6.17 3.4 83.5 82.7 85.3 81.3 86.9 80.9 82.1 84.1 85.1 88.3 82.1 84.8 a Min/max water discharge and reservoir volume for hydro units (M3×103): 25/100; 100000/500000.
TABLE 5. Energy and reserve prices ($/MWH)
1 2 3 4 5 6 7 8 9 10 11 12 13 14 15 16 17 18 19 20 21 22 23 24
BLC
All 27.0 25.5 20.5 20.0 22.3 28.0 29.5 35.0 36.5 37.5 39.0 39.0 41.0 39.5 41.0 43.5 45.0 44.0 43.0 43.0 36.0 30.0 30.0 27.0
P
CM
GLN 27.2 25.4 20.5 20.1 22.2 28.9 29.6 35.4 36.7 38.1 39.4 39.5 41.0 39.4 42.1 43.6 45.2 44.9 44.6 43.6 36.6 30.7 30 27.5
MZN 27.6 25.6 20.6 20.5 22.5 28.6 29.5 35.6 36.6 38.5 39.6 39.6 41.6 39.6 42.6 43.6 45.6 44.6 44.6 43.6 36.6 30.5 30.6 27.6
ZJN 28.0 26.0 21.0 21.0 23.0 29.0 30.0 36.1 37.0 39.0 40.0 40.0 42.0 40.0 43.0 44.1 46.1 45.1 45.0 44.1 37.0 31.1 31.0 28.0
AZN 27.5 25.5 20.5 20.5 22.5 28.5 29.5 35.5 36.5 38.5 39.5 39.5 41.5 39.5 42.5 43.5 45.5 44.5 44.5 43.5 36.5 30.5 30.5 27.5
RAZ 27.5 25.5 20.5 20.5 22.5 28.5 29.5 35.5 36.5 38.5 39.5 39.5 41.5 39.5 42.5 43.5 45.5 44.5 44.5 43.5 36.5 30.5 30.5 27.5
SR
a
Price 1.75 1.63 1.80 2.04 2.20 2.1 2.05 2.22 1.82 2.04 2.26 2.56 2.18 2.37 2.38 2.39 2.52 2.31 2.30 2.44 2.44 1.58 1.56 1.79
POCb 0.35 0.30 0.30 0.35 0.41 0.49 0.37 0.35 0.37 0.46 0.51 0.46 0.49 0.49 0.47 0.69 0.64 0.73 0.77 0.76 0.72 0.3 0.31 0.34 a Spinning reserve b Probability of calling
TABLE 6. Beginning status of units
plant Lushan Guilan Sepidroud
Unit 1 2 3 4 1 2 3 4 5 6 7 8 9 1 2 3 4 5
Ron (h) 4 6 2 0 0 6 5 7 7 3 5 0 5 5 8 5 4 0
Roff (h) 0 0 0 1 5 0 0 0 0 0 0 3 0 0 0 0 0 2
Generation 75 30 20 0 0 35 32.5 40 35 45 35 0 32.5 5 7 5 5 0
TABLE 7. Goal target values and weights for case study
1th priority level 2th priority level 3th priority level
G1 (103$) G2 (MW) G3 (MW) G4 G5 G6 G7
Target 125 Table 8 5% of G2 20% (st,gt,cc): (0.16,0.06,0.78) 40% 2%
Weight NA 0.6 0.4 0.1 0.3 0.5 0.1
TABLE 8. GEMS (MW) in different regionsa
Rega 1 2 3 4 5 6 7 8 9 10 11 12 13 14 15 16 17 18 19 20 21 22 23 24
GLN 331 336 330 372 390 392 393 400 373 452 456 457 459 455 451 550 565 575 595 568 566 330 338 338
MZN 28 28 31 22 32 32 33 34 34 37 39 37 37 36 37 50 49 50 50 47 48 31 31 30
ZJN 20 20 22 13 23 23 24 24 25 27 26 25 28 25 25 31 32 33 32 33 32 20 20 19
RAZ 0 0 0 0 0 0 0 0 0 0 5 5 5 5 8 8 8 8 10 10 10 10 0 0
TABLE 9. The structure of GREC and a large-scale GenCo
Variables Constraints
% of integerb No of integer
No of continuous % of integerb
No of integer No of non-integer
GenCo
33 79T
163T+16 91
222T+39 22Ta+7
GREC
35 400T
740T+33 94.5
880T+210 52T+7
Large-scale
a T is the number of hourly time periods in the scheduling horizon. b In this column, T is assumed to be 24 hours.
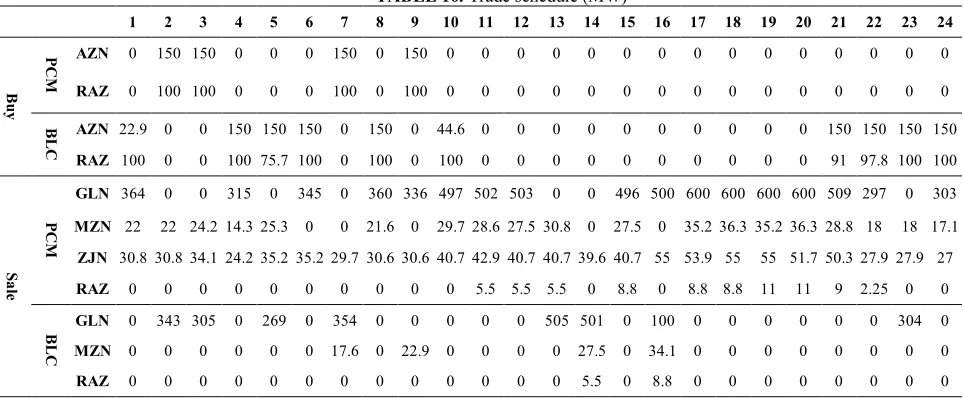
TABLE 10. Trade schedule (MW)
1 2 3 4 5 6 7 8 9 10 11 12 13 14 15 16 17 18 19 20 21 22 23 24
B
uy
P
CM AZN 0 150 150 0 0 0 150 0 150 0 0 0 0 0 0 0 0 0 0 0 0 0 0 0
RAZ 0 100 100 0 0 0 100 0 100 0 0 0 0 0 0 0 0 0 0 0 0 0 0 0
BLC AZN 22.9 0 0 150 150 150 0 150 0 44.6 0 0 0 0 0 0 0 0 0 0 150 150 150 150
RAZ 100 0 0 100 75.7 100 0 100 0 100 0 0 0 0 0 0 0 0 0 0 91 97.8 100 100
Sa
le
P
CM
GLN 364 0 0 315 0 345 0 360 336 497 502 503 0 0 496 500 600 600 600 600 509 297 0 303
MZN 22 22 24.2 14.3 25.3 0 0 21.6 0 29.7 28.6 27.5 30.8 0 27.5 0 35.2 36.3 35.2 36.3 28.8 18 18 17.1
ZJN 30.8 30.8 34.1 24.2 35.2 35.2 29.7 30.6 30.6 40.7 42.9 40.7 40.7 39.6 40.7 55 53.9 55 55 51.7 50.3 27.9 27.9 27
RAZ 0 0 0 0 0 0 0 0 0 0 5.5 5.5 5.5 0 8.8 0 8.8 8.8 11 11 9 2.25 0 0
BLC GLN 0 343 305 0 269 0 354 0 0 0 0 0 505 501 0 100 0 0 0 0 0 0 304 0
MZN 0 0 0 0 0 0 17.6 0 22.9 0 0 0 0 27.5 0 34.1 0 0 0 0 0 0 0 0
RAZ 0 0 0 0 0 0 0 0 0 0 0 0 0 5.5 0 8.8 0 0 0 0 0 0 0 0
Although the percentage of integer constraints and variables are high in the proposed model, however, through establishing the above two principles of Williams [24], we try to present a powerful formulation of UCS. First, an efficient formulation is proposed for the thermal ramping limits in (11)-(12). Second, extra binary variables (i.e., udit, udjt, duit, dujt) are introduced for facilitating the branching process. Finally, a linear, efficient and tightening form of minimum up/down limits and startup/shutdown constraints in (14)-(18) is formulated. Accordingly, the problem of GREC (and naturally the other similar medium-sized GenCos) is solved to global optimal in only multiple seconds. Furthermore, it can be confirmed that the problem of a large-scale GenCo such as the one in Table 9, can be solved to a relative optimality gap of lower than 5% in reasonable computation time. Now, in the famous and large-scale electricity markets such as PJM, California, and New England, the MIP-based solutions are employed instead of Lagrangian Relaxation [25]. However, in those markets, the optimality gap of lower than 0.5% is acceptable. Therefore, developing an efficient solution technique for the proposed model which can effectively been applied in the large-scale GenCos is really a direction for future research.
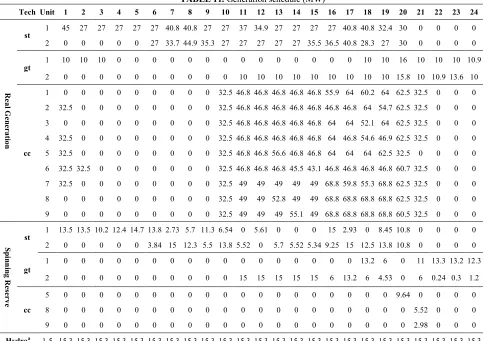
Summary of the results regarding the generation as well as the trade schedules for day-ahead market are provided in Tables 10-11. As observed, (1) contributions of steam, gas-turbine and combined cycle units in consistent with their characteristics and placement in thermal generation are 16, 4, and 80%, respectively. Notably, as an inapplicable solution for single-objective PBUC model, these contributions are 21, 0.5, and 78.5%, respectively; (2) non-efficient combustion turbine units are mainly committed at peak-GEMS hours. Moreover, the trade schedule follows the hourly GREC’s market targets well; (3) According to their features, gas-turbine units provide a significant portion of allocated spinning reserves. While, in the single-objective model, their contribution in providing spinning reserve is equal to zero; (4) forward BLCs play their true role in reducing the risk
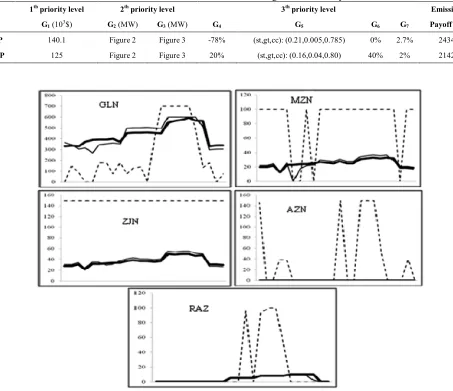
In order to show the efficiency of proposed PGP approach, in particular for improving the applicability of solutions, an experiment is established in Table 12 and Figures 2-3 through comparing the critical outcomes when using the new pre-emptive GP (PGP) with those when using single-objective profit-based model (SPP). The following observations can be deduced:
1027 M. M. Lotfi and S. F. Ghaderi/ IJE TRANSACTIONS C:Aspects Vol. 26, No. 9, (September 2013) 1017-1030
computational efforts are centralized to generate maximum profit. However, this solution is completely impractical and irrational regarding the values of the other goals. We should note that GREC completely achieves its own profit goal. GREC is satisfied with the profit of 125,000$ in lieu of reaching a logical and applicable solution through achieving the secondary goals as much as possible. ·As shown in Figure 2, the deviations of sales
schedule from GEMS for PGP are completely acceptable while those for SPP are ineligibly dreadful in all regions. As a fully erratic case, SPP schedules significant sales in MZN where no market share is forecasted. In fact, we can say that the sales plan in SPP is determined mainly based upon the price signal which is not directive due to market inefficiencies.
·As shown in Figure 3, the allocated spinning reserves in SPP model are far from the ideal values especially on hours 19-20 with high prices and probability of calling reserves while those in PGP model are almost equal to the target values.
·As given in Table 12, the payoff of BLCs has a significant negative portion in profit. This means
that BLCs are basically used to buy. However, in usual, the sales portfolio is more risky than the buy portfolio. Therefore, the results of SPP regarding the BLCs cannot fulfil the risk reduction objective. In contrast, for PGP case, the portion of BLCs in profit is equal to target (i.e., 20%) which is compatible with the corresponding goal.
· In SPP solution, gas-turbine units are not committed; therefore, as a surprisingly impractical result, their contribution in providing spinning reserve is also equal to zero. Thus, the contribution of steam technology in providing both real and reserve energy is more than what will be happen in practice. In brief, different technologies have not their placements in generation and reserve in the single-objective profit-based solution. However, applying the proposed PGP approach can make this placement nearer to the reality.
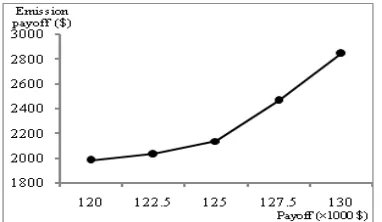
·In PGP solution, reducing the portion of start up/shutdown costs can preventively mitigate the underlying effects on the performance of generators. Emission payoff for profit-based SPP is expectedly more than PGP. However, the positive value for PGP case indicates the environmental considerations in our model.
TABLE 11. Generation schedule (MW)
Tech Unit 1 2 3 4 5 6 7 8 9 10 11 12 13 14 15 16 17 18 19 20 21 22 23 24
R
ea
l Ge
ner
at
ion
st 1 45 27 27 27 27 27 40.8 40.8 27 27 37 34.9 27 27 27 27 40.8 40.8 32.4 30 0 0 0 0 2 0 0 0 0 0 27 33.7 44.9 35.3 27 27 27 27 27 35.5 36.5 40.8 28.3 27 30 0 0 0 0
gt 1 10 10 10 0 0 0 0 0 0 0 0 0 0 0 0 0 0 10 10 16 10 10 10 10.9 2 0 0 0 0 0 0 0 0 0 0 10 10 10 10 10 10 10 10 10 15.8 10 10.9 13.6 10
cc
1 0 0 0 0 0 0 0 0 0 32.5 46.8 46.8 46.8 46.8 46.8 55.9 64 60.2 64 62.5 32.5 0 0 0
2 32.5 0 0 0 0 0 0 0 0 32.5 46.8 46.8 46.8 46.8 46.8 46.8 46.8 64 54.7 62.5 32.5 0 0 0
3 0 0 0 0 0 0 0 0 0 32.5 46.8 46.8 46.8 46.8 46.8 64 64 52.1 64 62.5 32.5 0 0 0
4 32.5 0 0 0 0 0 0 0 0 32.5 46.8 46.8 46.8 46.8 46.8 64 46.8 54.6 46.9 62.5 32.5 0 0 0
5 32.5 0 0 0 0 0 0 0 0 32.5 46.8 46.8 56.6 46.8 46.8 64 64 64 62.5 32.5 0 0 0 0
6 32.5 32.5 0 0 0 0 0 0 0 32.5 46.8 46.8 46.8 45.5 43.1 46.8 46.8 46.8 46.8 60.7 32.5 0 0 0
7 32.5 0 0 0 0 0 0 0 0 32.5 49 49 49 49 49 68.8 59.8 55.3 68.8 62.5 32.5 0 0 0
8 0 0 0 0 0 0 0 0 0 32.5 49 49 52.8 49 49 68.8 68.8 68.8 68.8 62.5 32.5 0 0 0
9 0 0 0 0 0 0 0 0 0 32.5 49 49 49 55.1 49 68.8 68.8 68.8 68.8 60.5 32.5 0 0 0
Sp
in
n
in
g R
es
er
ve
st 1 13.5 13.5 10.2 12.4 14.7 13.8 2.73 5.7 11.3 6.54 0 5.61 0 0 0 15 2.93 0 8.45 10.8 0 0 0 0 2 0 0 0 0 0 3.84 15 12.3 5.5 13.8 5.52 0 5.7 5.52 5.34 9.25 15 12.5 13.8 10.8 0 0 0 0
gt
1 0 0 0 0 0 0 0 0 0 0 0 0 0 0 0 0 0 13.2 6 0 11 13.3 13.2 12.3
2 0 0 0 0 0 0 0 0 0 0 15 15 15 15 15 6 13.2 6 4.53 0 6 0.24 0.3 1.2
cc
5 0 0 0 0 0 0 0 0 0 0 0 0 0 0 0 0 0 0 0 9.64 0 0 0 0
8 0 0 0 0 0 0 0 0 0 0 0 0 0 0 0 0 0 0 0 0 5.52 0 0 0
9 0 0 0 0 0 0 0 0 0 0 0 0 0 0 0 0 0 0 0 0 2.98 0 0 0
TABLE 12. Achievement levels of goals for case study
1th priority level 2th priority level 3th priority level Emission
G1 (103$) G2 (MW) G3 (MW) G4 G5 G6 G7 Payoff ($)
SPP 140.1 Figure 2 Figure 3 -78% (st,gt,cc): (0.21,0.005,0.785) 0% 2.7% 2434
PGP 125 Figure 2 Figure 3 20% (st,gt,cc): (0.16,0.04,0.80) 40% 2% 2142
Figure 2. Sales schedule (MW) of SPP (dashed line) and PGP (thin line) versus targeted GEMS (solid line).
Figure 3. Allocated spinning reserve of SPP (dash line) and PGP
(thin line) versus target values (solid line)
The results of proposed approach depend mainly upon the number of levels in the preemptive hierarchy as well as
the target values, priorities and weights of goals incorporated in the model. In Table 13, we compare the unwanted deviations for the PGP model with those for the case when equal weights are used for the goals at a same level (PGP1) and those for the case in which a bi-level goal hierarchy are applied (reducing the number of levels) by involving the goals G2 and G3 also in the 1th priority level (PGP2). The PGP1 solution shows the high sensitivity of the proposed method to the weights so that altering the weights of goals in different levels may generate better or worse results. Consistency of PGP method with a more regulated environment is observed in PGP2 where achieving the profit, GEMS and ASR target values receive the same priority. Anyway, our experiments demonstrate that decision maker should make a maximum of effort and attention when setting the goal-related structures and parameters.
1029 M. M. Lotfi and S. F. Ghaderi/ IJE TRANSACTIONS C:Aspects Vol. 26, No. 9, (September 2013) 1017-1030
characteristics of various UCS problems. For example, it may easily be matched with more regulated/competitive environments through (1) substituting the existing goals with new ones (2) Changing the number of levels in the goal hierarchy (3) moving goals in across of the goal hierarchy (4) specifying appropriate target values for the goals and (5) elaborating good enough weights for the same priority level goals.
Finally, the other experiments can be established for analyzing the sensitivity of results to some critical parameters such as goals’ target values and their relative importances, the forecasted prices for energy, reserve, fuel and emission, and the probability of calling spinning reserve and trading emission allowance. In this way, several guidelines to make better compromise and satisfactory multi-objective solution can be provided. For example, in Figure 4, we represent the trend of variations in the average unwanted deviations for the goals in 2th and 3th priority levels when increasing the profit target value in 1th priority level. In addition, Figure 5 depicts the corresponding variations in emission payoff.
TABLE 13. Deviations (%) from the goals target levelsa
G1 G2 G3 G4 G5 G6 G7
PGP 0 3.2 4.7 0 12 0 0
PGP1 0 3.3 0.5 0 20 46 0
PGP2 0 1.3 0 0 34 100 0
a For G
2, G3 and G5, we report the average unwanted deviation
Figure 4. Effect of payoff target value on the average
deviations of secondary goals.
Figure 5. Payoff target value versus emission payoff.
4. CONCLUSION
A novel mixed integer linear preemptive goal program with three-level hierarchy was proposed to improve the solution practicality of the short-term hydrothermal unit commitment problems and remove the modification phase during the implementation. The model handles critical aspects of power systems such as the generating unit limits as well as the limits on the fuel, emission, water reservoir and discharge, and transmission lines. Moreover, cap-and-trade emission regulation was modeled. The results inspiring by a real case showed the efficiency of proposed method in comparison with single-objective profit-based model. In particular, GenCo can benefit the advantages of our method to reach a compromised multi-objective solution along with satisfactory profit. The general characteristics of proposed method made me the sense that it can easily be adapted with a various line of unit commitment problems by setting the goal-related structures and parameters. The following directions for the future research might be considered. First, to solve the large-scale models toward very small relative optimality gap, an efficient solution technique can be developed. The parameters such as market share prices for the electricity and fuel, as well as the natural inflow in hydro system are naturally uncertain. Therefore, such parameters can be introduced as random parameters and a suitable type of stochastic/probabilistic goal programming approach is developed.
5. ACKNOWLEDGEMENT
The authors are grateful to the three anonymous referees for their valuable comments and constructive criticism.
[10-25]
6. REFERENCES
1. Shahidehpour, M. and Alomoush, M., "Restructured electrical power systems: Operation: Trading, and volatility", CRC Press, (2001).
2. Mazer, A., "Electric power planning for regulated and deregulated markets", Wiley. com, (2007).
3. Li, T. and Shahidehpour, M., "Price-based unit commitment: A case of lagrangian relaxation versus mixed integer programming", Power Systems, IEEE Transactions on, Vol. 20, No. 4, (2005), 2015-2025.
4. Yamin, H., "Profit‐based unit commitment for gencos in a deregulated power market", European Transactions on
Electrical Power, Vol. 14, No. 5, (2004), 321-330.
5. Mezger, A. J. and de Almeida, K. C., "Short term hydrothermal scheduling with bilateral transactions via bundle method",
International Journal of Electrical Power & Energy Systems, Vol. 29, No. 5, (2007), 387-396.
6. Nabona, N. and Pages, A., "A three-stage short-term electric power planning procedure for a generation company in a liberalized market", International Journal of Electrical Power & Energy Systems, Vol. 29, No. 5, (2007), 408-421.
7. Bisanovic, S., Hajro, M. and Dlakic, M., "Hydrothermal self-scheduling problem in a day-ahead electricity market", Electric
8. Nazari, M., Ardehali, M. and Jafari, S., "Pumped-storage unit commitment with considerations for energy demand, economics, and environmental constraints", Energy, Vol. 35, No. 10, (2010), 4092-4101.
9. Pérez-Díaz, J. I., Wilhelmi, J. R. and Sánchez-Fernández, J. Á., "Short-term operation scheduling of a hydropower plant in the day-ahead electricity market", Electric Power Systems
Research, Vol. 80, No. 12, (2010), 1535-1542.
10. Yuan, X., Wang, Y., Xie, J., Qi, X., Nie, H., and Su, A., "Optimal self-scheduling of hydro producer in the electricity market", Energy Conversion and Management, Vol. 51, No. 12, (2010), 2523-2530.
11. Catalao, J., Pousinho, H. and Mendes, V., "Hydro energy systems management in portugal: Profit-based evaluation of a mixed-integer nonlinear approach", Energy, Vol. 36, No. 1, (2011), 500-507.
12. Álvarez López, J., Ceciliano-Meza, J. L., Guillén Moya, I. and Nieva Gómez, R., "A miqcp formulation to solve the unit commitment problem for large-scale power systems",
International Journal of Electrical Power & Energy Systems, Vol. 36, No. 1, (2012), 68-75.
13. Raoofat, M. and Seifi, H., "Hydrothermal optimal power flow using continuation method", International Journal of
Engineering, Vol. 14, No. 2, (2000), 113.
14. Torabi, S. and Madadi, M., "A fuzzy multi objective programming model for power generation and transmission expansion planning problem", International Journal of Engineering-Transactions A: Basics, Vol. 23, No. 1, (2009), 29.
15. Georgopoulou, C. A. and Giannakoglou, K. C., "Two-level, two-objective evolutionary algorithms for solving unit commitment problems", Applied Energy, Vol. 86, No. 7, (2009), 1229-1239.
16. Catalao, J., Mariano, S., Mendes, V. and Ferreira, L., "A practical approach for profit-based unit commitment with emission limitations", International Journal of Electrical
Power & Energy Systems, Vol. 32, No. 3, (2010), 218-224.
17. Vahidinasab, V. and Jadid, S., "Joint economic and emission dispatch in energy markets: A multiobjective mathematical programming approach", Energy, Vol. 35, No. 3, (2010), 1497-1504.
18. Xie, J., Zhong, J., Li, Z. and Gan, D., "Environmental‐economic unit commitment using mixed‐integer linear programming",
European transactions on electrical power, Vol. 21, No. 1, (2011), 772-786.
19. Charnes, A., Cooper, W. W. and Ferguson, R. O., "Optimal estimation of executive compensation by linear programming",
Management science, Vol. 1, No. 2, (1955), 138-151.
20. Romero, C., "A general structure of achievement function for a goal programming model", European Journal of Operational
Research, Vol. 153, No. 3, (2004), 675-686.
21. Ignizio, J. P., "Goal programming and extensions", Lexington Books Lexington, MA, Vol. 26, (1976).
22. Pulgar-Painemal, H. A., "Short-term generation scheduling under a SO2 emissions allowances market", Electric Power
Systems Research, Vol. 74, No. 2, (2005), 257-265.
23. Lotfi, M. and Ghaderi, S., "Possibilistic programming approach for mid-term electric power planning in deregulated markets",
International Journal of Electrical Power & Energy Systems, Vol. 34, No. 1, (2012), 161-170.
24. Williams, H. P., "Model building in mathematical programming", (1999).
25. Sioshansi, R., O'Neill, R. and Oren, S. S., "Economic consequences of alternative solution methods for centralized unit commitment in day-ahead electricity markets", Power Systems,
IEEE Transactions on, Vol. 23, No. 2, (2008), 344-352.
Short-term Price-based Unit Commitment of Hydrothermal GenCos: A Pre-emptive
Goal Programming Approach
M. M. Lotfi a, S. F. Ghaderib
a Department of Industrial Engineering, Yazd University, Yazd, Iran
b Department of Industrial Engineering, University of Tehran, Tehran, Iran
P A P E R I N F O
Paper history:
Received 08 February 2013 Received in revised form 07 April 2013 Accepted 16 May 2013
Keywords:
Unit Commitment Scheduling Goal Programming Deregulated Market Emission
هﺪﯿﮑﭼ
لﺪﻣﺞﯾﺎﺘﻧ ﻪﻣﺎﻧﺮﺑﻪﻓﺪﻫﮏﺗيﺎﻫ ﺖﮐﺮﺷياﺮﺑﺖﺳاﻦﮑﻤﻣﺎﻫﺪﺣاوﺖﮐرﺎﺸﻣيﺰﯾر
تارﺮﻘﻣيﺎﻫرازﺎﺑردقﺮﺑﺪﯿﻟﻮﺗيﺎﻫ ﯽﯾادز
لﺪﻣعﻮﻧﻦﯾارداﺮﯾزﺪﻨﺷﺎﺒﻧهدﺎﻔﺘﺳاﻞﺑﺎﻗﺎﻤﯿﻘﺘﺴﻣهﺪﺷ ﺼﺗزاﯽﺷﺎﻧﺮﮕﯾدضرﺎﻌﺘﻣفاﺪﻫاﯽﺧﺮﺑﺎﻫ
ﻤ ﺖﺳﺎﯿﺳوتﺎﻤﯿ يﺎﻫ
ﺖﯾﺮﯾﺪﻣ ﯽﻧوردﻂﯿﺤﻣرد
/
ﯽﻤﻧﻪﺘﻓﺮﮔﺮﻈﻧردﯽﻧوﺮﯿﺑ ﺪﻧﻮﺷ
.
هﺮﻬﺑﺎﺑ،ﻪﻟﺎﻘﻣﻦﯾارد دﻮﺒﻬﺑياﺮﺑارﺎﮐﻪﻓﺪﻫﺪﻨﭼدﺮﮑﯾورﮏﯾزايﺮﯿﮔ
لﺪﻣﺞﯾﺎﺘﻧدﺮﺑرﺎﮐ ﻪﻣﺎﻧﺮﺑيﺎﻫ
ﻪﻣﺎﻧﺮﺑﺪﯾﺪﺟلﺪﻣﮏﯾ،ﺎﻫﺪﺣاوﺖﮐرﺎﺸﻣﺖﻤﯿﻗﺮﺑﯽﻨﺘﺒﻣيﺰﯾر ﻂﻠﺘﺨﻣﺢﯿﺤﺻدﺪﻋﯽﻄﺧيﺰﯾر
ﯽﻣﻪﺋارا ﯽﻧﺎﻣرآ ﻤﮑﻣفاﺪﻫاﯽﺧﺮﺑنآردﻪﮐدﻮﺷ
ﯽﻣﻪﺘﻓﺮﮔﺮﻈﻧردﺰﯿﻧدﻮﺳزاﺮﺘﻤﮐﯽﺒﺴﻧﺖﯿﻤﻫاﺎﺑ ﻞ ﺪﻧﻮﺷ
.
ﯽﻨﺤﻨﻣ يﺎﻫ
ﯽﻨﺤﻨﻣﺎﺑيﺪﯿﻟﻮﺗيﺎﻫﺪﺣاو ﯽﻄﺧﺮﯿﻏدﺮﮑﻠﻤﻋﯽﮔﮋﯾو ﻪﮑﺗﯽﻄﺧيﺎﻫ
ﯽﻣهدز ﺐﯾﺮﻘﺗيا ﺪﻧﻮﺷ
.
ﮏﯾسﺎﺳاﺮﺑيدﺪﻋﺞﯾﺎﺘﻧ
يدرﻮﻣﻪﻌﻟﺎﻄﻣ ،
ﯽﻣتﺎﺒﺛااريدﺎﻬﻨﺸﯿﭘدﺮﮑﯾورﯽﯾارﺎﮐ ﺪﻨﻨﮐ
.
ﺖﺳاﻦﯾايدﺎﻬﻨﺸﯿﭘلﺪﻣيﺪﯿﻠﮐﺖﯿﻠﺑﺎﻗﮏﯾ ﯽﻣﻪﮐ
ﯽﮔدﺎﺳﻪﺑﺪﻧاﻮﺗ
ﻪﻣﺎﻧﺮﺑﻞﺋﺎﺴﻣعاﻮﻧاﺎﺑﯽﺑﻮﺧﯽﯾارﺎﮐو دﻮﺷرﺎﮔزﺎﺳﺎﻫﺪﺣاوﺖﮐرﺎﺸﻣيﺰﯾر
.