A Monthly Double-Blind Peer Reviewed Refereed Open Access International e-Journal - Included in the International Serial Directories
Indexed & Listed at:
Ulrich's Periodicals Directory ©, ProQuest, U.S.A., EBSCO Publishing, U.S.A., Index Copernicus Publishers Panel, Poland, Open J-Gage, India [link of the same is duly available at Inflibnet of University Grants Commission (U.G.C.)]
VOLUME NO.2(2012),ISSUE NO.3(MARCH) ISSN2231-5756
CONTENTS
CONTENTS
CONTENTS
CONTENTS
Sr.No.
TITLE & NAME OF THE AUTHOR (S)
Page No.
1. BRAND THEOLOGY: CONDITIONING AND CONFIGURING CONSUMER BEHAVIOUR ANM FARUKH
1
2. IMPACT OF EMPLOYEE SATISFACTION AND UNION – MANAGEMENT RELATION ON ENHANCED CUSTOMER SATISFACTION- REGRESSION ANALYSIS: A STUDY OF ANDHRA PRADESH STATE ROAD TRANSPORT CORPORATION (A.P.S.R.T.C)
A. R. VIJAYA CHANDRAN, DR. MOHAMMED ABBAS ALI & DR. V. M. PRASAD
5
3. A STUDY OF THE ATTITUDE OF THE YOUTH TOWARDS ADOPTION OF INTERNET ENTERPRENEUERSHIP IN NIGERIA DR. I C NWAIZUGBO & V N O AGHARA
7
4. THE IMPACT OF SMALL BUSINESS MANAGEMENT ON SOCIETAL MARKETING PRACTICES IN LAGOS MEGA CITY, NIGERIA DR. HALIRU BALA
11
5. IMPACT OF HUMAN ERROR IN MAINTENANCE MANAGEMENT AND MINIMIZING METHODOLOGY N. K. K. PRASANNA & TUSHAR N. DESAI
15
6. INTERPERSONAL RELATIONSHIP-AN ATTEMPT AT QUANTIFYING IT T K PARAMESWARAN NAIR
21
7. PERFORMANCE APPRAISAL SYSTEM IN TEXTILE INDUSTRY WITH SPECIAL REFERENCE TO TIRUPUR- AN EXPLORATORY STUDY DR. S. KUPPUSAMY, E.DEEPA & M. STELLA
27
8. MANAGERIAL PERCEPTION TOWARDS INDUSTRIAL SUBSIDY AND ITS IMPACT ON INDUSTRIALIZATION IN UTTRAKHAND: AN EMPIRICAL STUDY
DR. D S CHAUBEY, SIDHESWAR PATRA & PRAVEEN KUKRETI
33
9. EMPLOYEE’S DISSONANCE TOWARDS SAFETY, HEALTH AND ENVIRONMENT (SHE) IN CONFECTIONERY INDUSTRY DR.MU.SUBRAHMANIAN & P. RENGANATHAN
40
10. ACCEPTANCE AND USAGE OF MANAGEMENT INFORMATION SYSTEM (MIS) IN SMALL SCALE INDUSTRIES C.G. RAMACHANDRA & T.R. SRINIVAS
43
11. DEVELOPING RIGHT HUMAN EQUATION BY SELF KNOWLEDGE FOR CHANGE MANAGEMENT: LEARNING FROM INDIAN MYTHOLOGY DR. K. V. ALIAS. BALAJI, DR. M.SIVAGNANASUNDARAM & BIDYANAND JHA
47
12. A STUDY ON WORK- LIFE BALANCE AMONG WOMEN TEACHERS WORKING IN SELF-FINANCING ENGINEERING INSTITUTIONS S.PATTU MEENAKSHI & DR. K. RAVICHANDRAN
51
13. THE EFFECT OF TEAM PROCESS AND KEY COMPENSATION FACTORS WHILE MOTIVATING HIGH PERFORMANCE IN PHARMACEUTICAL SALES TEAMS
DR. SURENDRA KUMAR
56
14. SUPPLY CHAIN MANAGEMENT IN TWO WHEELER INDUSTRY - A STUDY ON HERO HONDA AND BAJAJ AUTO SUPPLY CHAIN PRACTICES R.VENKATESHWAR RAO.
61
15. OPTIMUM PERFORMANCE OF TURMERIC EXTRACTION FIRMS: AN INPUT-OUTPUT ANALYSIS V.ABIRAMI & DR. HANSA LYSANDER MANOHAR
67
16. ANALYSIS OF PERSISTENCY IN THE MONTHLY COIMBATORE RAINFALL TAMIL SELVI .S & SAMUEL SELVARAJ. R
71
17. PROS AND CONS OF IMPLEMENTING EMPLOYEE EMPOWERMENT IN SERVICE SECTOR- A META ANALYSIS OF RESEARCH LITERATURE ELIZABETH GEORGE & DR. ZAKKARIYA K.A.
73
18. STUDY OF CONSUMER AWARENESS ABOUT E-BANKING SERVICES AND ITS APPLICATION IN SELECT AREA OF PUNE CITY KRISHNA MOHAN SHARMA & VINEETA DEOLIA
77
19. CSR – A NEW ROLE ENTRUSTED TO EDUCATIONAL INSTITUTIONS PRAGATI CHAUHAN & YOGITA SHARMA
80
20. A STUDY ON EFFECTIVENESS OF CAPITAL STRUCTURE AMONG SELECTED PRIVATE TEXTILE COMPANIES IN INDIA VIVEK SUBRAMANIAM
84
21. IMPACT OF GLOBAL FINANCIAL CRISIS ON BUSINESS CYCLES IN DEVELOPING ASIA AND THE DECOUPLING HYPOTHESIS DR. RAVI SINGLA
91
22. SYSTEMATIC RISK AND RETURN ANALYSIS IN SECURITY MARKET NIVEDHITA.J & REVATHI.P
97
23. ASSETS FORMATION AND BUSINESS IN PUNJAB NATIONAL BANK: A CASE STUDY NAMITA MAINI
102
24. GOVERNANCE AND RESPONSIBILITY - A JOINT VENTURE (WITH SPECIAL REFERENCE TO TATA) RADHAKRISHNA MISHRA & MALAVIKA PATTNAIK
105
25. FACTORS EFFECTING READING DECISION OF PRINT ADVERTISEMENT: AN EXPLORATORY AND EXPERIMENTAL STUDY ANUPAMA SUNDAR & JATIN PANDEY
108
26. WORKING CAPITAL MANAGEMENT AND PROFITABILITY –A CASE STUDY OF BALRAMPUR CHINNI MILLS LIMITED DR. P. C. NARWARE
111
27. ROLE OF ICT MICRO ENTERPRISES ON WOMEN DEVELOPMENT IN KERALA DR. C.S. SIVA PRAKASH
115
28. ENTREPRENEURSHIP AMONG RURAL WOMEN -A STUDY IN ANDHRA PRADESH DR. NANU LUNAVATH
122
29. BUSINESS EXCELLENCE MODELS: QUANTIFYING THE IMPLEMENTATION AND MATURITY LEVEL – A STATISTICAL APPROACH RUCHIK GANDHI & JUBIN MEHTA
130
30. STUDENT’S ATTITUDE TOWARDS APPLICATION OF STATISTICS: A STUDY OF UNIVERSITY OF JAMMU ANJU THAPA & ANKUSH BHARTI
135
INTERNATIONAL JOURNAL OF RESEARCH IN COMMERCE, IT & MANAGEMENT
CHIEF PATRON
CHIEF PATRON
CHIEF PATRON
CHIEF PATRON
PROF. K. K. AGGARWAL
Chancellor, Lingaya’s University, Delhi
Founder Vice-Chancellor, Guru Gobind Singh Indraprastha University, Delhi
Ex. Pro Vice-Chancellor, Guru Jambheshwar University, Hisar
PATRON
PATRON
PATRON
PATRON
SH. RAM BHAJAN AGGARWAL
Ex. State Minister for Home & Tourism, Government of Haryana
Vice-President, Dadri Education Society, Charkhi Dadri
President, Chinar Syntex Ltd. (Textile Mills), Bhiwani
CO
CO
CO
CO----ORDINATOR
ORDINATOR
ORDINATOR
ORDINATOR
AMITA
Faculty, Government M. S., Mohali
ADVISORS
ADVISORS
ADVISORS
ADVISORS
DR. PRIYA RANJAN TRIVEDI
Chancellor, The Global Open University, Nagaland
PROF. M. S. SENAM RAJU
Director A. C. D., School of Management Studies, I.G.N.O.U., New Delhi
PROF. M. N. SHARMA
Chairman, M.B.A., Haryana College of Technology & Management, Kaithal
PROF. S. L. MAHANDRU
Principal (Retd.), Maharaja Agrasen College, Jagadhri
EDITOR
EDITOR
EDITOR
EDITOR
PROF. R. K. SHARMA
Professor, Bharti Vidyapeeth University Institute of Management & Research, New Delhi
CO
CO
CO
CO----EDITOR
EDITOR
EDITOR
EDITOR
DR. BHAVET
Faculty, M. M. Institute of Management, Maharishi Markandeshwar University, Mullana, Ambala, Haryana
EDITORIAL ADVISORY BOARD
EDITORIAL ADVISORY BOARD
EDITORIAL ADVISORY BOARD
EDITORIAL ADVISORY BOARD
DR. RAJESH MODI
Faculty, Yanbu Industrial College, Kingdom of Saudi Arabia
PROF. SANJIV MITTAL
University School of Management Studies, Guru Gobind Singh I. P. University, Delhi
PROF. ANIL K. SAINI
Chairperson (CRC), Guru Gobind Singh I. P. University, Delhi
DR. SAMBHAVNA
Faculty, I.I.T.M., Delhi
DR. MOHENDER KUMAR GUPTA
VOLUME NO.2(2012),ISSUE NO.3(MARCH) ISSN2231-5756
DR. SHIVAKUMAR DEENE
Asst. Professor, Dept. of Commerce, School of Business Studies, Central University of Karnataka, Gulbarga
MOHITA
Faculty, Yamuna Institute of Engineering & Technology, Village Gadholi, P. O. Gadhola, Yamunanagar
ASSOCIATE EDITORS
ASSOCIATE EDITORS
ASSOCIATE EDITORS
ASSOCIATE EDITORS
PROF. NAWAB ALI KHAN
Department of Commerce, Aligarh Muslim University, Aligarh, U.P.
PROF. ABHAY BANSAL
Head, Department of Information Technology, Amity School of Engineering & Technology, Amity University, Noida
PROF. A. SURYANARAYANA
Department of Business Management, Osmania University, Hyderabad
DR. ASHOK KUMAR
Head, Department of Electronics, D. A. V. College (Lahore), Ambala City
DR. SAMBHAV GARG
Faculty, M. M. Institute of Management, Maharishi Markandeshwar University, Mullana, Ambala, Haryana
PROF. V. SELVAM
SSL, VIT University, Vellore
DR. PARDEEP AHLAWAT
Reader, Institute of Management Studies & Research, Maharshi Dayanand University, Rohtak
S. TABASSUM SULTANA
Associate Professor, Department of Business Management, Matrusri Institute of P.G. Studies, Hyderabad
SURJEET SINGH
Asst. Professor, Department of Computer Science, G. M. N. (P.G.) College, Ambala Cantt.
TECHNICAL ADVISOR
TECHNICAL ADVISOR
TECHNICAL ADVISOR
TECHNICAL ADVISOR
AMITA
Faculty, Government H. S., Mohali
MOHITA
Faculty, Yamuna Institute of Engineering & Technology, Village Gadholi, P. O. Gadhola, Yamunanagar
FINANCIAL ADVISORS
FINANCIAL ADVISORS
FINANCIAL ADVISORS
FINANCIAL ADVISORS
DICKIN GOYAL
Advocate & Tax Adviser, Panchkula
NEENA
Investment Consultant, Chambaghat, Solan, Himachal Pradesh
LEGAL ADVISORS
LEGAL ADVISORS
LEGAL ADVISORS
LEGAL ADVISORS
JITENDER S. CHAHAL
Advocate, Punjab & Haryana High Court, Chandigarh U.T.
CHANDER BHUSHAN SHARMA
Advocate & Consultant, District Courts, Yamunanagar at Jagadhri
SUPERINTENDENT
SUPERINTENDENT
SUPERINTENDENT
SUPERINTENDENT
SURENDER KUMAR POONIA
INTERNATIONAL JOURNAL OF RESEARCH IN COMMERCE, IT & MANAGEMENT
CALL FOR MANUSCRIPTS
CALL FOR MANUSCRIPTS
CALL FOR MANUSCRIPTS
CALL FOR MANUSCRIPTS
Weinvite unpublished novel, original, empirical and high quality research work pertaining to recent developments & practices in the area of Computer, Business, Finance, Marketing, Human Resource Management, General Management, Banking, Insurance, Corporate Governance and emerging paradigms in allied subjects like Accounting Education; Accounting Information Systems; Accounting Theory & Practice; Auditing; Behavioral Accounting; Behavioral Economics; Corporate Finance; Cost Accounting; Econometrics; Economic Development; Economic History; Financial Institutions & Markets; Financial Services; Fiscal Policy; Government & Non Profit Accounting; Industrial Organization; International Economics & Trade; International Finance; Macro Economics; Micro Economics; Monetary Policy; Portfolio & Security Analysis; Public Policy Economics; Real Estate; Regional Economics; Tax Accounting; Advertising & Promotion Management; Business Education; Management Information Systems (MIS); Business Law, Public Responsibility & Ethics; Communication; Direct Marketing; E-Commerce; Global Business; Health Care Administration; Labor Relations & Human Resource Management; Marketing Research; Marketing Theory & Applications; Non-Profit Organizations; Office Administration/Management; Operations Research/Statistics; Organizational Behavior & Theory; Organizational Development; Production/Operations; Public Administration; Purchasing/Materials Management; Retailing; Sales/Selling; Services; Small Business Entrepreneurship; Strategic Management Policy; Technology/Innovation; Tourism, Hospitality & Leisure; Transportation/Physical Distribution; Algorithms; Artificial Intelligence; Compilers & Translation; Computer Aided Design (CAD); Computer Aided Manufacturing; Computer Graphics; Computer Organization & Architecture; Database Structures & Systems; Digital Logic; Discrete Structures; Internet; Management Information Systems; Modeling & Simulation; Multimedia; Neural Systems/Neural Networks; Numerical Analysis/Scientific Computing; Object Oriented Programming; Operating Systems; Programming Languages; Robotics; Symbolic & Formal Logic and Web Design. The above mentioned tracks are only indicative, and not exhaustive.
Anybody can submit the soft copy of his/her manuscript anytime in M.S. Word format after preparing the same as per our submission guidelines duly available on our website under the heading guidelines for submission, at the email addresses: [email protected]or
GUIDELINES FOR SUBMISSION OF MANUSCRIP
GUIDELINES FOR SUBMISSION OF MANUSCRIP
GUIDELINES FOR SUBMISSION OF MANUSCRIP
GUIDELINES FOR SUBMISSION OF MANUSCRIPT
T
T
T
1. COVERING LETTER FOR SUBMISSION:
DATED: _____________ THE EDITOR
IJRCM
Subject: SUBMISSION OF MANUSCRIPT IN THE AREA OF .
(e.g. Finance/Marketing/HRM/General Management/Economics/Psychology/Law/Computer/IT/Engineering/Mathematics/other, please specify)
DEAR SIR/MADAM
Please find my submission of manuscript entitled ‘___________________________________________’ for possible publication in your journals.
I hereby affirm that the contents of this manuscript are original. Furthermore, it has neither been published elsewhere in any language fully or partly, nor is it under review for publication elsewhere.
I affirm that all the author (s) have seen and agreed to the submitted version of the manuscript and their inclusion of name (s) as co-author (s).
Also, if my/our manuscript is accepted, I/We agree to comply with the formalities as given on the website of the journal & you are free to publish our contribution in any of your journals.
NAME OF CORRESPONDING AUTHOR: Designation:
Affiliation with full address, contact numbers & Pin Code: Residential address with Pin Code:
Mobile Number (s): Landline Number (s): E-mail Address: Alternate E-mail Address:
NOTES:
a) The whole manuscript is required to be in ONE MS WORD FILE only (pdf. version is liable to be rejected without any consideration), which will start from
the covering letter, inside the manuscript.
b) The sender is required to mention the following in the SUBJECT COLUMN of the mail:
New Manuscript for Review in the area of (Finance/Marketing/HRM/General Management/Economics/Psychology/Law/Computer/IT/ Engineering/Mathematics/other, please specify)
c) There is no need to give any text in the body of mail, except the cases where the author wishes to give any specific message w.r.t. to the manuscript. d) The total size of the file containing the manuscript is required to be below 500 KB.
e) Abstract alone will not be considered for review, and the author is required to submit the complete manuscript in the first instance.
f) The journal gives acknowledgement w.r.t. the receipt of every email and in case of non-receipt of acknowledgment from the journal, w.r.t. the submission
of manuscript, within two days of submission, the corresponding author is required to demand for the same by sending separate mail to the journal.
2. MANUSCRIPT TITLE: The title of the paper should be in a 12 point Calibri Font. It should be bold typed, centered and fully capitalised.
3. AUTHOR NAME (S) & AFFILIATIONS: The author (s) full name, designation, affiliation (s), address, mobile/landline numbers, and email/alternate email address should be in italic & 11-point Calibri Font. It must be centered underneath the title.
VOLUME NO.2(2012),ISSUE NO.3(MARCH) ISSN2231-5756 5. KEYWORDS: Abstract must be followed by a list of keywords, subject to the maximum of five. These should be arranged in alphabetic order separated by
commas and full stops at the end.
6. MANUSCRIPT: Manuscript must be in BRITISH ENGLISH prepared on a standard A4 size PORTRAIT SETTING PAPER. It must be prepared on a single space and single column with 1” margin set for top, bottom, left and right. It should be typed in 8 point Calibri Font with page numbers at the bottom and centre of every page. It should be free from grammatical, spelling and punctuation errors and must be thoroughly edited.
7. HEADINGS: All the headings should be in a 10 point Calibri Font. These must be bold-faced, aligned left and fully capitalised. Leave a blank line before each heading.
8. SUB-HEADINGS: All the sub-headings should be in a 8 point Calibri Font. These must be bold-faced, aligned left and fully capitalised.
9. MAIN TEXT: The main text should follow the following sequence:
INTRODUCTION
REVIEW OF LITERATURE
NEED/IMPORTANCE OF THE STUDY
STATEMENT OF THE PROBLEM
OBJECTIVES
HYPOTHESES
RESEARCH METHODOLOGY
RESULTS & DISCUSSION
FINDINGS
RECOMMENDATIONS/SUGGESTIONS
CONCLUSIONS
SCOPE FOR FURTHER RESEARCH
ACKNOWLEDGMENTS
REFERENCES
APPENDIX/ANNEXURE
It should be in a 8 point Calibri Font, single spaced and justified. The manuscript should preferably not exceed 5000 WORDS.
10. FIGURES &TABLES: These should be simple, centered, separately numbered & self explained, and titles must be above the table/figure. Sources of data should be mentioned below the table/figure. It should be ensured that the tables/figures are referred to from the main text.
11. EQUATIONS: These should be consecutively numbered in parentheses, horizontally centered with equation number placed at the right.
12. REFERENCES: The list of all references should be alphabetically arranged. The author (s) should mention only the actually utilised references in the preparation of manuscript and they are supposed to follow Harvard Style of Referencing. The author (s) are supposed to follow the references as per the following:
•
All works cited in the text (including sources for tables and figures) should be listed alphabetically.•
Use (ed.) for one editor, and (ed.s) for multiple editors.•
When listing two or more works by one author, use --- (20xx), such as after Kohl (1997), use --- (2001), etc, in chronologically ascending order.•
Indicate (opening and closing) page numbers for articles in journals and for chapters in books.•
The title of books and journals should be in italics. Double quotation marks are used for titles of journal articles, book chapters, dissertations, reports, workingpapers, unpublished material, etc.
•
For titles in a language other than English, provide an English translation in parentheses.•
The location of endnotes within the text should be indicated by superscript numbers.PLEASE USE THE FOLLOWING FOR STYLE AND PUNCTUATION IN REFERENCES: BOOKS
•
Bowersox, Donald J., Closs, David J., (1996), "Logistical Management." Tata McGraw, Hill, New Delhi.•
Hunker, H.L. and A.J. Wright (1963), "Factors of Industrial Location in Ohio" Ohio State University, Nigeria.CONTRIBUTIONS TO BOOKS
•
Sharma T., Kwatra, G. (2008) Effectiveness of Social Advertising: A Study of Selected Campaigns, Corporate Social Responsibility, Edited by David Crowther &Nicholas Capaldi, Ashgate Research Companion to Corporate Social Responsibility, Chapter 15, pp 287-303.
JOURNAL AND OTHER ARTICLES
•
Schemenner, R.W., Huber, J.C. and Cook, R.L. (1987), "Geographic Differences and the Location of New Manufacturing Facilities," Journal of Urban Economics,Vol. 21, No. 1, pp. 83-104.
CONFERENCE PAPERS
•
Garg, Sambhav (2011): "Business Ethics" Paper presented at the Annual International Conference for the All India Management Association, New Delhi, India,19–22 June.
UNPUBLISHED DISSERTATIONS AND THESES
•
Kumar S. (2011): "Customer Value: A Comparative Study of Rural and Urban Customers," Thesis, Kurukshetra University, Kurukshetra.ONLINE RESOURCES
•
Always indicate the date that the source was accessed, as online resources are frequently updated or removed.WEBSITE
INTERNATIONAL JOURNAL OF RESEARCH IN COMMERCE, IT & MANAGEMENT
BUSINESS EXCELLENCE MODELS: QUANTIFYING THE IMPLEMENTATION AND MATURITY LEVEL – A
STATISTICAL APPROACH
RUCHIK GANDHI
GRADUATE ENGINEER TRAINEE
TATA TECHNOLOGIES
PUNE
JUBIN MEHTA
GRADUATE ENGINEER TRAINEE
TATA TECHNOLOGIES
BANGALORE
ABSTRACT
It is of utmost importance to quantify the results of any theory that is applied practically to an industry. There are numerous quality techniques which are in practice in the industry from more than half a century. Business Excellence Models for each firm encompasses the set of relevant quality and production improvement techniques. In many of the cases, after the application of these concepts, the results are either not measured at all and if inspected the grading depends heavily on the perception of the audit inspector. This paper aims at studying the concept of Business Excellence Models and proposes a systematic approach to quantify the level of implementation and the level of maturity it has achieved using the statistical tools. Further it also suggests a new approach for getting data and feedback which is not based on perception and gives more real and transparent figures. This paper aims at developing a methodology and a structure which helps in pinning a number to actual implementation level of the model or a degree to which the model has been followed. Also, the analysis will show which of the category or parameter is critical for rapid and holistic overall improvement of the organization. Thus, this methodology will help the companies conduct internal audits without the need of an audit inspector, highlight the key focus areas and aid improve the status of their firm vis-a-vis their business excellence model.
KEYWORDS
ANOVA, Business Excellence Models, Quantification, Non-Perspective based Questionnaire.
BUSINESS EXCELLENCE MODELS
usiness excellence is the systematic use of quality management principles and tools in business management, with the goal of improving performance based on the principles of customer focus, stakeholder value, and process management. There are many excellence models in existence and thousands of companies have adopted these models or its various according to its needs [1]. The following are some of the prevailing frameworks available globally: 1. Malcolm Baldrige Criteria for Performance Excellence
2. European Foundation for Quality Management (EFQM) Excellence Model 3. Singapore Quality Award Framework
4. Canadian Framework for Business Excellence 5. Australian Business Excellence Framework
6. Business Performance Improvement Resource Model 7. Corporate World Class Manufacturing
IN INDIA
8. Ram Krishna National Quality Award 9. Indira Gandhi National Quality Award 10. Rajiv Gandhi National Quality Award
Business excellence, as described by the European Foundation for Quality Management (EFQM), refers to "outstanding practices in managing the organization and achieving results, all based on a set of eight fundamental concepts." These concepts are "results orientation, customer focus, leadership and constancy of purpose, management by processes and facts, people development and involvement, continuous learning, innovation and improvement; partnership development, and public responsibility."
All the prevailing excellence models provide the framework to achieve business excellence. They provide guidelines which are to be followed by companies in order to achieve excellence in business. The guidelines are generally broadly divided into the above mentioned categories and teams or committees are specially given responsibility for the each specific category [5].
We therefore, propose to represent a methodology which based on the business excellence model adopted by the organization will help it to find out the present implementation value and the maturity level of the organization.
THE METHODOLOGY
Any company adopting the Business Excellence Model has a certain roadmap to follow. The company takes all steps in its control to follow the guidelines as closely as possible generally by dedicating a separate department which will look after the smooth and proper implementation of the practices. This Quality Assurance or Business Excellence department oversees the overall working of the company and tries to keep the working in line with the company’s vision and mission or according to the pre-decided benchmark [4]. Also continuous monitoring for validation of the implemented techniques and quality initiatives reaping expected benefits needs to be carried out for which the proposed methodology will be of utmost use.
OBJECTIVES OF THE METHODOLOGY
The purpose of the exercise is to evaluate the organisation, measure its performance and to indicate the scope of improvement. The methodology is so designed that it can be adapted to any model with a slight modification in the questionnaire to make it more relevant to the model. Objectives of the methodology are:
1. To determine the implementation level of the model as per the guidelines mentioned in the framework provided by the Business Excellence Model that is adopted by the company.
2. To determine the maturity level of the implemented model. 3. Criterion wise implementation and maturity level.
VOLUME NO.2(2012),ISSUE NO.3(MARCH) ISSN2231-5756
This methodology will help the organization to highlight the key areas where improvements are required, focus on these improvements and maximize the efforts to optimize the outputs.
METHODOLOGY FOR QUANTIFICATION
The roadmap of the company should be studied and after its rigorous analysis, a questionnaire is to be prepared in such a way that it covers all the criterions for the Enablers and Processes. Enablers are criterion which deal with visionary leadership and strategic planning and set the goals for the organization. Processes are the means by which these aims can be achieved. Further the questions should be designed after exhaustive consultancy with the unit representative so that justified weight-age is given to all the aspects and criterions of the model. A pilot test is first conducted with feedback from 20% of the total sample size. The pilot test is used to validate the questions and it is important to include the background information of the respondents according to the analysis required. After this, more data has to be collected with an appropriate sample size.
The feedback collected is then carefully organized, measured and analyzed [2]. Based on the feedback and due consultations with the respective heads and the unit representative improvement measures are suggested which may help the organization achieve higher outputs and better quality.
A CASE STUDY
A company has been trying to improve its business processes in lieu with its Business Excellence Model for the growth of its business. It has taken few steps to improve along the lines as suggested by the model. In order to find the areas which critically need improvement it needs to check the present status of the implementation of its business excellence model. The following questionnaire is created and data was collected. Table 1 exhibits a sample of a conventional questionnaire which is currently being employed in industries for auditing purposes.
In this kind of a questionnaire, the respondent is asked to tick mark on any one of the options against a question according to his preference.
All the employees are asked to fill up the form like the one mentioned in table 1 and data is collected. For analysing this data, background details of the employees are also collected. Background details may include number of years of work experience, educational qualifications, designation, committee it belongs to, gender, age, etc. An appropriate sample size is very important for reliable analysis. All the responses are to be given a value. In this case, ‘strongly disagree’ is assigned a rating of one, ‘disagree’ is assigned a rating of two, ‘agree’ with three and ‘strongly agree’ with four. No response can be assigned with zero and is not to be taken for analysis as it may be either due to lack of sufficient knowledge or because of a special cause. After collecting and assimilating the data, analysis is carried out.
Sr. No. Question Strongly disagree
Disagree Agree Strongly agree
No comments 1 Transparency in knowledge sharing Yes
2 Practice of housekeeping techniques as a culture and everyday practice Yes 3 Identifying Value added / Non-value added (NVA) activities Yes 4 Preventive maintenance for the upkeep of equipments Yes
5 Providing regular training and monitoring to improve employees’ performance
Yes
Statistical tests need to be carried out on the data to give the necessary quantification for exercise and gives the underlying trends and patterns. The ANOVA (analysis of variance) and t-test are the most important tools used to determine the co-relationship between the background information and the rating (for instance, relation between respondents of a particular department and the rating). This is helpful in identifying the departments or categories which require the maximum focus for improvement [3].
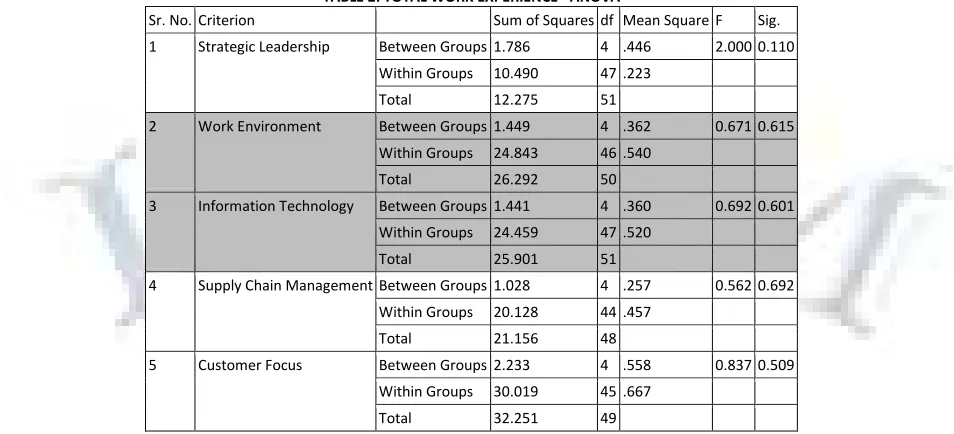
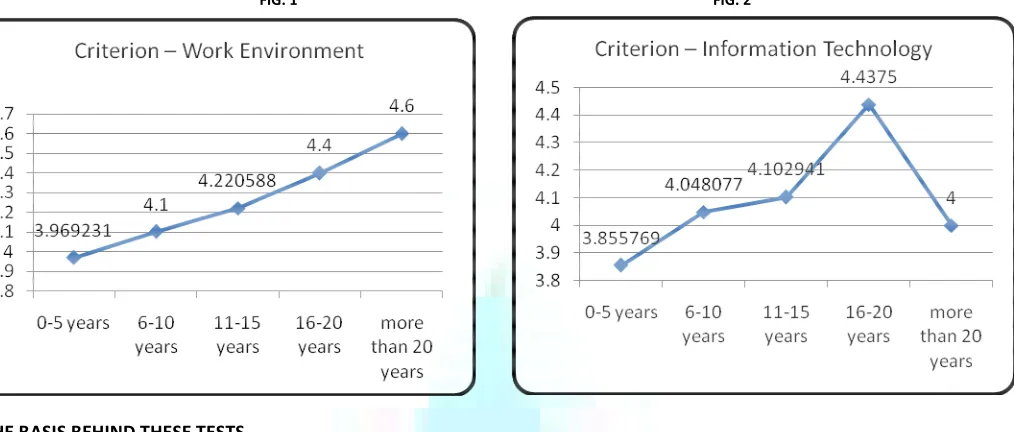
INTERPRETATION OF GRAPHS AND TABLE
The data summarized in the above table has been assumed for the purpose of illustration. The Table 2 shows the outcome of ANOVA analysis which shows the significance values for the change in the value of a particular criterion with the required background information. Figure 1 and Figure 2 shows two examples where mean of the values given by respondents in the criterions of Work Environment and Information Technology are shown varying with change in the number of work experience in the firm. While figure 1 clearly indicates an upward trend which shows that the anticipated implementation value of the Business Excellence Model in the criterion of Work Experience improves with the number of work experience (in years). Though, the significance value in the ANOVA chart is 0.615 (greater than 0.05 for 95% confidence level) which means that though the variation is visible through graphs it is not of statistical significance.
TABLE 2: TOTAL WORK EXPERIENCE - ANOVA
Sr. No. Criterion Sum of Squares df Mean Square F Sig. 1 Strategic Leadership Between Groups 1.786 4 .446 2.000 0.110
Within Groups 10.490 47 .223 Total 12.275 51
2 Work Environment Between Groups 1.449 4 .362 0.671 0.615 Within Groups 24.843 46 .540
Total 26.292 50
3 Information Technology Between Groups 1.441 4 .360 0.692 0.601 Within Groups 24.459 47 .520
Total 25.901 51
4 Supply Chain Management Between Groups 1.028 4 .257 0.562 0.692 Within Groups 20.128 44 .457
Total 21.156 48
5 Customer Focus Between Groups 2.233 4 .558 0.837 0.509 Within Groups 30.019 45 .667
INTERNATIONAL JOURNAL OF RESEARCH IN COMMERCE, IT & MANAGEMENT
FIG. 1 FIG. 2THE BASIS BEHIND THESE TESTS
Both of these tests, namely, t-Test and ANOVA (analysis of variance) are used to find out a relationship between means of groups. The difference being the two being that the t-Test can be used to compare means of two groups while ANOVA can be used to compare means of multiple groups. This name is derived from the fact that in order to test for statistical significance between means, we are actually comparing (i.e., analyzing) variances. The variance is used as a measure of how far a set of numbers are spread out from each other. It is one of several descriptors of a probability distribution, describing how far the numbers lie from the mean (expected value).
The table and figure exhibit the results of ANOVA and t-Test. Table shows the relationship or trend with respect to the age groups. The respondents were divided into groups according to their age and the test determines whether there exists a relationship between the age of the respondent and their responses. In the case sighted above, the significant or the p-value in each of the case is above 0.05 (tolerance is 95%) and hence the null hypothesis is accepted. Figure shows the trend for two of the criterion (namely criteria 2 and 3) pictorially. There is a trend when the graphs are visualized but the tests show that this trend is not statistically significant and hence no conclusion about the relationship can be drawn.
The figure shows the result of a t-Test. It tells what one of the group thinks about the criterion or what were the criteria-wise responses of one of the age-groups.
QUANTIFICATION
Carrying out this exercise for all the various background information collected a clear idea about the mean implementation value pertaining to different criterions and different background information can be found out. Taking a mean of all these values will give one value of the implementation level. A better method is to find the weighted mean average giving due weight-age to responses from a particular committee while calculating the mean value for the department related to it. For this the t-test may be used. If the entire questionnaire is divided into various criterions like for example, work environment, preventive maintenance, innovation and technology, etc. then after carrying out the t-test a high weight-age must be given to values pertaining to the work environment department for the responses given by the work environment department. The highlighted part in the above radar representation of the t –test shows the same. The final implementation value calculated from this way will be a weighted mean average and will be more authentic than the overall mean. The maturity level can be found out by asking the respondents in the questionnaire ‘the scope for improvement’. Higher the scope for improvement would mean lesser maturity level. Hence, by inverting the scale and calculating in the above manner will give the maturity level.
This kind of a questionnaire has a few pitfalls which this paper aims at filling up. The limitations of the prevalent exercise:
• This questionnaire doesn’t have a well-defined scheme for drawing conclusions form a specific rating. While measuring the same parameter, if two respondents have the same views but still it might be possible that one of the respondent marks ‘agree’ while the other marks ‘strongly agree’. The limitation arises from the fact that both the respondents have different baselines or reference points which they set up in their minds.
• There might be difficulty in associating the language in the options with respect to the question.
VOLUME NO.2(2012),ISSUE NO.3(MARCH) ISSN2231-5756
TABLE 3: NEW REVISED NON-PERSPECTIVE BASED QUESTIONNAIRE
Sr. No.
Question Options
1 Knowledge Sharing Training Modules
Interaction LAN Servers
Self Learning No sharing
2 Housekeeping Tools Just a Program In the Culture
Full knowledge
Necessary Not Necessary
3 Identification of Value Added/Non Value Added activities
Satisfactory Profitable Frequent Can be Better
Don’t Know
4 Preventative Equipment maintainance Weekly Monthly Bi-annually Annually No Maintenance
5 Training Programs Relevant Effective No use Can be Better
Don’t Know
THE NEW METHODOLOGY PROPOSED
Questionnaires should be prepared with a more substantial basis. The reference line should be the same for all the respondents which will provide more accurate results. Instead of lengthy questionnaires, lesser number of questions may be included but the questions should have customized answers. Each of the answer should have a reference to it with which the respondent can relate to and mark accordingly.
THE NEW METHODOLOGY EXPLAINED
Multiple answers are allowed for this type of a questionnaire (sample given in table 3) and each box has a predefined weight-age. For example, for the question based on knowledge sharing if the organization has been trying to improve knowledge sharing through the use of Information Technology and if a respondent marks knowledge sharing through LAN Servers, then it is a positive sign for improvement. If majority of respondents mark training modules or interaction, then it means that even if knowledge sharing is prevalent, it is not through the desired channel. Moreover, it gives an indication to the firm to improve their modules and also organize more seminars for better interaction. Self Learning or No knowledge sharing would become a sign of concern for the firm, which represents that the maturity of the implemented model is not yet achieved. Similar analysis can be done using these types of options for the revised and re-designed questionnaire sample. It may be noted that though table 1 and table 3 primarily ask the same questions, much detailed information may be collected through table 3. Moreover as it asks objective questions, the possibility of perception ruling a choice is nullified.
A few questions can be included which should ideally elicit the same response. This will help in validating the authenticity of the data. If the respondent is filling up the questionnaire without reading, he’ll be giving different responses to these basically same questions.
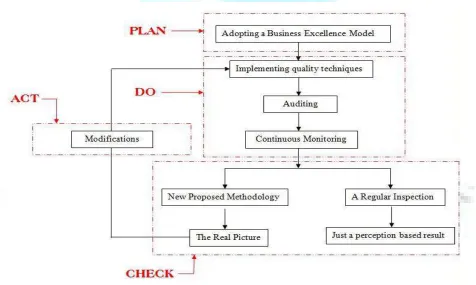
THE FLOW CHART DEPICTION OF THE PROCESS INTEGRATED WITH THE PDCA FLOW
CONCLUSIONS
The paper has demonstrated a unique, simple and easily executable methodology of using statistical tools to review any system based on a fixed business approach. The statistical tools used, thus can aid the reviewer with an overall analysis of the current standing of any organization based on its vision, mission and other strategic plans. It will also help in highlighting the key focus areas by providing regions where there are maximum opportunities for improvement alongside showing the dependencies of different parameters on the background information collected of the respondents.
Further in the case study segment of the paper two issues have been identified which drove the analysis in this paper.
INTERNATIONAL JOURNAL OF RESEARCH IN COMMERCE, IT & MANAGEMENT
Secondly, the prevalent method of analysing data through questionnaires is based on perception and hence a modification is needed here. This is one of the major draw-back with the current review system because each respondent has his/her own reference system. The data thus collected does not represent the actual system in an authenticated manner.
The paper meets these issues by pointing out the importance of quality checks and providing a methodology (and also suggests the modification in the methodology) for the review system. The methodology assigns a true value to the model implementation through questionnaires based on quantitative guidelines and not just on perception. This helps in arriving at a real standing of the company from where it can set its benchmark and work its way towards achieving Business Excellence. The best way of doing this is by taking feedback in the format as demonstrated in Table 3. Each respondent can select one or more than one of the given options and a pre-defined weight-age can be given to each of the option. This can further boost the analysis and its accuracy.
REFERENCES
1. Balvir Talwar, (2009) "Comparative study of core values of excellence models vis-à-vis human values", Measuring Business Excellence, Vol. 13 Iss: 4, pp.34 – 46
2. Jiju Antony, Mike Kaye, Andreas Frangou, (1998) "A strategic methodology to the use of advanced statistical quality improvement techniques", The TQM Magazine, Vol. 10 Iss: 3, pp.169 – 176
3. Miller, R G Jr, (1997) “Beyond ANOVA, basics of applied statistics”, Chapman and Hall Publications
4. Mohamed Zairi, Yasar F. Jarrar “Versatility of the Business Excellence Model as a Generic Benchmarking Tool”, European Centre for Best Practise Management, Research Paper: RP—ECBPM/0002
VOLUME NO.2(2012),ISSUE NO.3(MARCH) ISSN2231-5756
REQUEST FOR FEEDBACK
Dear Readers
At the very outset, International Journal of Research in Commerce, IT and Management (IJRCM)
acknowledges & appreciates your efforts in showing interest in our present issue under your kind perusal.
I would like to request you to supply your critical comments and suggestions about the material published
in this issue as well as on the journal as a whole, on our E-mails i.e.
or
for further improvements in the interest of research.
If you have any queries please feel free to contact us on our E-mail
.
I am sure that your feedback and deliberations would make future issues better – a result of our joint
effort.
Looking forward an appropriate consideration.
With sincere regards
Thanking you profoundly
Academically yours
Sd/-