Please cite this article as: M. Mohammadi, S. H. Iranmanesh, R. Tavakkoli-Moghaddam, M. Abdollahzadeh, Hierarchical Alpha-Cut Fuzzy C -Means, Fuzzy ARTMAP and Cox Regression Model for Customer Churn Prediction, International Journal of Engineering (IJE), TRANSACTIONS C: Aspects Vol. 27, No. 9, (September 2014) 1404-1414
International Journal of Engineering
J o u r n a l H o m e p a g e : w w w . i j e . i rHierarchical Alpha-cut Fuzzy
C
-means, Fuzzy ARTMAP and Cox Regression Model
for Customer Churn Prediction
M. Mohammadi a,*, S.H. Iranmanesh a, R. Tavakkoli-Moghaddama, M. Abdollahzadeh b
a School of Industrial Engineering and Research Institute of Energy Management & Planning, College of Engineering, University of Tehran, Tehran, Iran
b University of K.N. Toosi, Department of Mechanical Engineering, Tehran, Iran
P A P E R I N F O
Paper history:
Received 06 March 2013
Received in revised form 08 May 2014 Accepted 22 May 2014
Keywords: Fuzzy ARTMAP Fuzzy C-Means Cox Regression
Customer Relationship Management Churn Prediction
A B S T R A C T
As customers are the main asset of any organization, customer churn management is becoming a major task for organizations to retain their valuable customers. In earlier studies, the applicability and efficiency of hierarchical data mining techniques for churn prediction by combining two or more techniques have been proved to provide better performances than many single techniques over a number of different domain problems. This paper considers a hierarchical model by combining three data mining techniques containing two different fuzzy prediction networks and a regression technique for churn prediction, namely Alpha-cut Fuzzy C-Means (αFCM), Improved Fuzzy ARTMAP and Cox proportional hazards regression model, respectively. In particular, the first component of the hierarchical model aims to cluster data in two churner and non-churner groups applying the alpha-cut algorithm and filter out unrepresentative data or outliers. Then, the clustered and representative data as the outputs are used to assign customers to churner and non-churner groups by the second technique. Finally, the correctly classified data are used to create the Cox proportional hazards model. To evaluate the performance of the proposed hierarchical model, the Iranian mobile dataset is considered. The experimental results show that the proposed model outperforms the single Cox regression baseline model in terms of prediction accuracy, Type I and II errors, RMSE, and MAD metrics.
doi:10.5829/idosi.ije.2014.27.09c.10
1. INTRODUCTION1
Companies in the competitive market are mainly dependent to those of customers that are more profitable. Furthermore, the more attention to loyal customers, the more profit to gain. Therefore, customer relationship management (CRM) always concentrates on customers who bring more values to the company. Loyal customers are the most fertile source of data for making a decision. This data reflects the customers’ actual behavior and those factors affect their loyalty. The potential value of customers can be evaluated by these data [1]. Assessing the risk, in which customers stop paying their bills, and predicting their future needs
1*Corresponding Author's Email: mehrdadmohamadi@ut.ac.ir (M. Mohammadi)
can be also achieved [2]. Nevertheless, the customer retention is the trump card in the intense competitive market. Regarding the customer attrition resulting in the loss of incomes, churn prediction has received increasing attention in the whole marketing and management literature. Moreover, it has been proven that considerable impact on incomes occurs by small change in the retention rate [3].
quadratic discriminant analysis approaches [4, 7]). Two
main tasks of data mining techniques describe a remarkable pattern or relationship in the data and predict a conceptual model in which data are followed up [8, 9].In the literature, it has been demonstrated that hybrid data mining approaches by combining clustering and classification techniques have better performance in comparison to single clustering and classification techniques. Hybrid approaches are particularly combined by two learning stages, in which the first one is the pre-processing of data and the second one is the final prediction output [10-15]. In addition to predicting the customer churn model and determining which customer belongs to which class (i.e. churner and non-churner classes), companies are eager to know when, why and with what probability their customers try to switch their subscription. Having knowledge about these factors, which significantly affect customers churn behavior, are more important than just knowing the classes of the customers. These effective factors are needed for companies to plan their long-term strategies for decreasing the customer churn rate. Additionally, scheduling and adopting best marketing strategies based on when and why their customers like to break up their relationship are helpful; because some companies suffer from marketing expenses in some especial times while they are not aware of what their customers want. On the other hand, having knowledge about effective factors and probability of attrition, enable companies to focus on those customers who are more likely to churn.
However, a few papers studied hybrid data mining techniques for customer churn prediction. Therefore, in this paper, a new hierarchical technique is presented to create the model of customer churn. This proposed technique is based on combining clustering (i.e., Alpha-cut Fuzzy C-Means (αFCM)), classification techniques (i.e., fuzzy ARTMAP), and survival analysis (i.e., Cox regression model), which is αFCM + FARTMAP + Cox. The rest of our paper is organized as follows. In Section 2, we describe the proposed data mining techniques. Section 3 describes the research methodology, and Section 4 presents the experimental results. Finally, conclusion is provided in Section 5.
2. PROPOSED DATA MINING TECHNIQUES
In order to create an effective and accurate customer churn prediction model, many data mining techniques have been considered over the last decades in the marketing and management literature (e.g. [5,6]).
2. 1. Fuzzy C-Means Clustering Clustering is an unsupervised learning technique that breaks down a set of patterns into groups (or clusters). Clustering technique refers to the partitioning a set of data object
into clusters. In particular, no predefined classes are assumed [16]. Classical clustering partitions each observation to a single group (cluster), without considering the degree of distinction or similarity of the observation from all the other possible clusters. This type of clustering is often called hard or crisp clustering [3]. Nevertheless, fuzzy clustering methods based on the fuzzy set theory and on the concept of membership functions, have been developed. In the fuzzy clustering, observations are allowed to belong to more than one cluster with different degrees of membership. Membership function is calculated based on the distance of observations from clusters’ center. The well-known method of fuzzy clustering is the FCM technique, initially proposed by Dunn [17].
2. 2. Fuzzy Artmap Classiication Technique Classification is one of the commonly used data mining techniques categorized as supervised learning techniques. It determines the value of some variables, and classifies according to results. The common algorithms of classification include decision trees, artificial neural networks and the like [18] in which artificial neural networks are the most recently applied methods in the literature .The ARTMAP method has been inspired by neural network architecture based on the adaptive resonance theory (ART) that is capable of fast, stable, on-line, unsupervised or supervised, incremental learning, classification, and prediction [19]. This method, which is shown simply in Figure 1, is obtained by combining an ART unsupervised neural network with a map field. The ARTMAP architecture, called fuzzy ARTMAP, can process both analog and binary-valued input patterns by employing fuzzy ART as the ART network [19, 20].
Fuzzy ARTMAP consists of two fuzzy ART modules (ARTa and ARTb), which are linked together
via an inter-ART module, Fab. During the learning phase, the input vector I0 is presented to the ARTa, and
the desired output vector O0 is presented to the ARTb.
The ARTa and ARTb modules classify the input and
desired output vector into categories, the map filed (inter-ART module) makes associations from ARTa
category to ARTb category. If I0 predicts an incorrect O0, then a mechanism called match tracking is triggered.
This mechanism increases the vigilance parameter of ARTa by a minimum value, and hence forces the ARTa
module to search for another category suitable to be associated with the desired output vector.
Figure 1. ARTMAP neural network architecture specialized for pattern classification [20].
Most commonly, this examination entails the specification of a linear-like model for the log hazard. For example, a parametric model based on the exponential distribution may be written as follows:
ik k i
i
i t x x x
h()=α+β +β +...+β
log 1 1 2 2 (7)
Or, equivalently,
) ... exp(
)
( 1 i1 2 i2 k ik
i t x x x
h = α+β +β + +β (8)
Equation (8) is a linear model for the log-hazard or a multiplicative model for the hazard. In this equation, i is a subscript for observation, and the x’s are the covariates. The constant α in this model represents a kind of log-baseline hazard, since log hi(t) = α or hi(t) = eα when all of the x’s are zero. Equation (8) is similar to parametric regression models based on the other survival distributions. In contrast, the Cox model leaves the baseline hazard function α(t) = log h0(t) unspecified by:
ik k i
i
i t t x x x
h()=α()+β +β +...+β
log 1 1 2 2 (9)
) ... exp(
) ( )
( 0 1 i1 2 i2 k ik
i t h t x x x
h = α+β +β + +β (10)
where Equation (10) is a semi-parametric because while the baseline hazard can take any form, the covariates enter the model linearly.
2. 4. Related Work Estimating an effective and accurate customer churn prediction model has become a major task of business and academics in recent years. In order to review the predicted customer’s churn model, some of more recently related papers are shown in Table 1.
3. RESEARCH METHODOLOGY
3. 1. Data Set In this paper, we consider a CRM dataset provided by an Iranian mobile operator. Specifically, the dataset contains 3,150 subscribers,
including 495 churners and 2,655 non-churners, from September 2008 to August 2009. In addition, the subscribers have to be mature customers who are with the mobile operator for at least 2 months. Churn is then calculated based on whether the subscriber left the company during 10 remained months. Churned customer is being defined as a customer who has not contact with the operator (e.g., making a call, charging a credit and changing subscription). Besides, the dataset contains 9 points, which are analyzed for creating the clustering, classification and Cox proportional hazards models. These points contain categorical and quantitative variables as listed in Tables 2 and 3, respectively. In categorical variables, each number represents a group of customers. Therefore, for using the Cox proportional hazards regression model, a dummy coding is used for categorical variables as shown in Table 4. In addition, a sample data set is shown in Table 5.
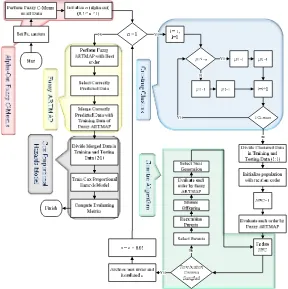
3. 2. Model Development For the hierarchical model, an alpha-cut fuzzy c-means (αFCM) method, which is a clustering technique, is used for the data reduction task. Then, the clustering result is used to train the second model based on fuzzy ARTMAP. Finally, the pre-processed data are used to create the Cox proportional hazards model. The final goal is to predict a value which is input variable and that affects customer churn prediction (i.e., output of the Cox proportional hazards model).
3. 2. 1. The Baseline At first, we use the original dataset to create the Cox proportional hazards model as the baseline Cox model for comparison.
3. 2. 2. Evaluation Method To evaluate the proposed churn prediction model, prediction accuracy and the Type I and II errors are considered. These can be measured by a confusion matrix shown in Table 6. The rate of prediction accuracy is defined by (a+b)/(a+b+c+d). The Type I error is the error of not rejecting a null hypothesis when the alternative hypothesis is the true state of nature. In this paper, it means that the customer is not churned when the model has predicted that the hazard function of that customer is more than α (i.e., α is the alpha cut in fuzzy c-means clustering method).
On the other hand, the Type II error is defined as the error of rejecting a null hypothesis when it is the true state of nature. It means that the customer is churned when the model has predicted that the survival function of that customer is more than α.
TABLE 1. Related literature about customer churn
Authors & Years Analytical methods
Burez and Van den Poel [22]
Logistic regression Markov chains random forests
Burez et al. [23] gradient boosting and weighted random forests
Buckinx and Van den Poel [24]
Neural networks, logistic regression
Buckinx et al. [25] multiple linear regression
Coussement et al. [26] Logistic regression, support vector machines and random forests
Coussement and Van den Poel [5]
Support vector machines random forests logistic regression
Eshghi et al. [27] Structural Equation Model (SEM) Gerpott [28] Casual analysis
Glady et al. [29] Survival analysis
Hung et al. [6] Classification (decision tree, neural network) clustering (K-means)
Kim & Yoon [30] Binomial logic model Kim et al. [31] The structural equation model
Mazzoni et al. [32] Multidimensional segmentation approach Pendharkar [33] Genetic algorithm based neural network Seo et al. [34] Two-level model of customer retention Tsai et al. [10] hybrid neural networks
Tsai et al. [35] neural network and decision tree Van den Poel et al. [3] survival analysis and choice modelling Van den Poel et al. [36] Survival analysis
Verbeke et al. [37] Ant colony optimization Wei and Chiu [38] Classification (decision tree)
Zhao et al. [39] Improved one-class support vector machine
Idris et al. [40] Random Forest, Rotation Forest, RotBoost and DECORATE
Phadke et al. [41] Social Network Analysis (SNA) Farquad et al. [42] Support vector machine
TABLE 2. Categorical variables
Variable name Level Description
Age Group
1 Customers whose age are below than 15
2 Customers whose age are between 15 and 30
3 Customers whose age are between 30 and 45
4 Customers whose age are between 45 and 60
5 Customers whose age are between 60 and 75
Tariff Plan
1 Customers using common services 2 Customers using special services
TABLE 3. Quantitative variables
Variable name Description
Call Failure Number of calls that a customer experiences out of the total number of call trials
Complains Complains about services’ quality Charge
Amount Amount of charging a credit
Seconds of Use Duration of time that each customer has used services
Frequency of Use
Total number of calls that each customer has experienced
Frequency of
SMS Total number of SMS that each customer has sent Distinct Called
Numbers
Total number of distinct phone numbers that each customer has experienced
TABLE 4. Categorical variables dummy coding
Covariate Categories Dummy Coding
Age Groups 1 = ...<15 1 0 0 0
2 = 15-30 0 1 0 0 3 = 30-45 0 0 1 0
4 = 45-60 0 0 0 1 5 = 60-75 0 0 0 0 Tariff Plan 1 = common 1
2 = especial 0
TABLE 5. Sample data set
Factors Sample data
Call Failure 8 13 1 9 9
Complains 0 1 0 0 1
Charge Amount 0 1 0 0 0 Seconds of Use 4370 5818 2840 2990 2268 Frequency of use 71 98 22 41 44 Frequency of SMS 5 26 0 9 34 Distinct Called Numbers 17 24 14 16 31
Age Group 3 2 3 3 2
Tariff Plan 1 1 1 2 2
Churn 0 1 0 1 1
customer is churned when the model has predicted that the survival function of that customer is more than α.
We also compare the performance of the proposed model with the pure Cox proportional hazards model We compute the deviation between observed and predicted outcomes (i.e., the probability of churn or survival as predicted by the model) for both proposed and pure Cox models. The root mean squared error (RMSE) and mean absolute deviation (MAD) are calculated for comparing both models as follows:
Nch N i Nch i ch N i ch i N S N S RMSE ch ch
∑
∑
= − + = − = 1 2 1 2 ) 1 ( ) 0 ( (13)∑
∑
= = − + −= Nch Nch
i N j Nch Nch j Nch ch ch i ch e e N e e N MAD 1 1 1 1 (14)
where Sich and SiNch are the survival probability of churned customer i and non-churned customer j, respectively. Nch and NNch are the number of churned and non-churned customer, respectively. eichis the deviation of churned customer i from zero (i.e., eich=(Sich-0)) and eiNch is the deviation of non-churned customer j from one (i.e., eiNch=(1- SiNch)). echandeNch are the mean of the deviation of churned and non-churned customers, respectively.
4. EXPERIMENTAL RESULTS
4. 1. Parameters Setting It is well known that the quality of an algorithm is significantly influenced by the values of its parameters. In this section, for optimizing the behavior of the proposed churn prediction model, appropriate tuning of its parameters is carried out. For this purpose, the response surface methodology (RSM) is employed. Tuned parameters of the proposed customer churn prediction model are shown in Table 7.
4. 2. The Baseline In order to create the Cox model, 2350 and remained 800 numbers of data are used for training and testing the Cox model, respectively. Table 8 shows the prediction performance of the baseline Cox proportional hazards model based on type I and II errors, accuracy, RMSE and MAD metrics. On average, the baseline Cox proportional hazards model provides about 84% accuracy meaning that in 128 cases of data, the Cox model was unable to correctly predict the survival and hazard probability based on value of alpha-cut 0.7. The type I and II errors were equal to 87 and 41 cases of incorrectly predicted data. The baseline Cox model also provides 0.083 and 0.098 as the RMSE and MAD error metrics, respectively.
TABLE 6. Confusion matrix
Actual
Non-churners Churners
Predicted Non-churners a b (II: S
*
>α) Churners c (I: H**>α) d
* Probability of Survival **Probability of Hazard
TABLE 7. Tuned Parameters of Proposed Model
Parameters
α-ART α β ε ρa
Value 0.00001 0.70 0.0007 - 0.00001 0.0
E V Popsize Pc Pm
Value 2 3 150 0.75 0.1
TABLE 8. Prediction performance of the baseline Cox
proportional hazards model
Performance Metrics
Accuracy Error
type I
Error type
II RMSE MAD
Value 84% 87 41 0.083 0.098
4. 3. Proposed Hierarchical Churn
Figure 2. Flowchart of the proposed hierarchical churn prediction model
4. 4. Important Factors on Customer Churning Table 10 reports effective factors on customer churning model created by hybrid structure. The value of B indicates the coefficient of each significant factor in Cox proportional hazard model. Positive and negative coefficients, respectively, increase and decrease the churn rate. The last column of Table 10 shows the change unit of hazard rate by increasing or decreasing one unit of factors. For example, by one unit increase in Call Failure, the hazard rate increases by 1.087.
4.5. Sensitivity Analysis In order to investigate the behavior of the accuracy metric affected by input parameters, some sensitivity analyses are conducted based on choice parameter, alpha-cut, number of epochs (E), number of voting system (V) and
β shown in Figures 3 to 7, respectively. Figure 4 shows different levels of accuracy by alteration of choice parameter, in which the maximum accuracy belongs to
α equal to 0.00001. Figure 5 indicates the alteration of accuracy by different levels of alpha-cut parameter; in which alpha-cut equal to 0.70 provides maximum accuracy. Besides, Figure 6 depicts the effect of different numbers of epochs on value of accuracy.
TABLE 9. Prediction performance of the hierarchical churn
prediction model
Performance Metrics
Accuracy Error
type I
Error type
II RMSE MAD
Value 96.66% 23 14 0.0304 0.071
TABLE 10. Effective factors on customer churning
Factors B Exp (B)
Call Failure 0.083 1.087
Complains 1.932 7.010
Charge Amount -0.292 0.747 Seconds of Use 0.008 1.008 Frequency of use -0.051 0.950 Frequency of SMS -0.015 0.985
A
g
e
G
roup
s:
The maximum accuracy is obtained in 2 numbers of epochs. Based on Figure 6, the maximum accuracy belongs to three numbers of voting system. Finally, Figure 7 illustrates that the maximum accuracy is obtained by β equal to 0.0007.
Figure 3. Accuracy vs. choice parameter
Figure 4. Accuracy vs. alpha-cut parameter
Figure 5. Accuracy vs. number of epochs
Figure 6. Accuracy vs. number of voting systems
Figure 7. Accuracy vs. β
5. CONCLUSION
In this paper, we have considered a hierarchical data mining technique structured by alpha-cut fuzzy c -means, improved fuzzy ARTMAP using genetic algorithm and Cox proportional hazards model to create the more precise customer churn model, in which the first component of the hierarchical model aims to cluster data in two churner and non-churner groups applying alpha-cut algorithm and filter out unrepresentative data or outliers.
Then, the clustered and representative data as the outputs have been used to assign customers to churner and non-churner groups. Finally, the correctly classified data have been used to create the Cox proportional hazards model.
The experimental results have indicated that the hierarchical model has outperformed the single Cox proportional hazard baseline model in term of prediction accuracy, the Types I and II errors, RMSE and MAD metrics. In particular, the alpha-cut fuzzy c-means + improved fuzzy ARTMAP + Cox proportional hazard model has performed better than pure Cox proportional hazards model. 88 90 92 94 96 98 α =0 .0000001 α =0 .000001 α =0 .00001 α =0 .0001 α =0 .001 A cc ur ac y (%) 70 75 80 85 90 95 100 α -c ut= 0. 50 α -c ut= 0. 55 α -c ut= 0. 60 α -c ut= 0. 65 α -c ut= 0. 70 α -c ut= 0. 75 α -c ut= 0. 80 A cc u ra cy ( %) 80 84 88 92 96 100
1 2 3
A cc u ra cy ( %)
Number of Epochs (E)
80 84 88 92 96 100
1 2 3 4 5
A cc u ra cy ( %)
Number of voting systems (V)
70 75 80 85 90 95 100 β =0 .000001 β =0 .00001 β =0 .0007 β =0
.001 β=0.9
6. REFERENCES
1. Hung, C., Tsai, C.F., “Segmentation based on hierarchical self-organizing map for markets of multimedia on demand”, Expert
Systems with Applications, Vol. 34, No. 1, (2008), 780–787.
2. Berry, M.J.A., Linoff, G.S. “Data mining techniques: For marketing, sales, and customer support”, John Wiley & Sons, (2003).
3. Van den Poel, D., Lariviere, B., “Customer attrition analysis for financial services using proportional hazard models”, European
Journal of Operational Research, Vol. 157, (2004), 196–217.
4. Baesens, B., Viaene, S., Van den Poel, D., Vanthienen, J., & Dedene, G. “Bayesian neural network learning for repeat purchase modeling in direct marketing”, European Journal of
Operational Research, Vol. 138, No. 1, (2002), 191–211.
5. Coussement, K., Van den Poel, D., “Churn prediction in subscription services: An application of support vector machines while comparing two parameter-selection techniques”, Expert
Systems with Applications, Vol. 34, No. 1, (2008), 313–327.
6. Hung, S.Y., Yen, D.C., Wang, H.Y. “Applying data mining to telecomm churn management”, Expert Systems with
Applications, Vol. 31, No. 3, (2006), 515–524.
7. Bhattacharyya, S., Pendharkar, P.C. “Inductive, evolutionary and neural techniques for discrimination: A comparative study”,
Decision Sciences, Vol. 29, (1998), 871–900.
8. Fayyad, U., Uthurusamy, R., “Data mining and knowledge discovery in databases”, Communications of the ACM, Vol. 39, (1996), 24–27.
9. Ngai, E.W.T., Xiu, L., Chau, D.C.K., “Application of data mining techniques in customer relationship management: A literature review and classification”, Expert Systems with
Applications, Vol. 36, No. 2, (2009), 2592–2602.
10. Tsai, Ch., Lu, Y., “Customer churn prediction by hybrid neural networks”, Expert Systems with Applications, Vol. 36, (2009), 12547–12553.
11. Lenard, M.J., Madey, G.R., Alam, P., “The design and validation of a hybrid information system for the auditor’s going concern decision”, Journal of Management Information
Systems, Vol. 14, No. 4, (1998), 219–237.
12. Rumelhart, D.E., Hinton, G.E., Williams, R.J. “Parallel distributed processing: Explorations in the microstructure of cognition”, Chapter on learning internal representations by
error propagation, Vol. 1, (1986), 318–362. MIT Press.
13. Pendharkar, P.C., “A comparison of gradient ascent, gradient descent and genetic-algorithm based artificial neural networks for the binary classification problem”, Expert Systems with
Application, Vol. 24, No. 2, (2007), 65–86.
14. Pendharkar, P.C., Nanda, S., “A misclassification cost minimizing evolutionary-neural classification approach”, Naval
Research Logistics, Vol. 53, No. 5, (2006), 432–447.
15. Pendharkar, P.C., Rodger, J.A., “An empirical study of impact of crossover operators on the performance of non-binary genetic algorithm based neural approaches for classification”,
Computers and Operations Research, Vol. 31, (2004), 481–
498.
16. Jain, A., Murty, M., Flyn, P., “Data clustering: A review”, ACM
Computing Surveys, Vol. 31, (1999), 264–323.
17. Dunn, J., “A fuzzy relative of the ISO-data process and its use in detecting compact, well-separated clusters”, Journal of
Cybernetics, Vol. 3, No. 3, (1973), 32–57.
18. Han, J., Kamber, M., “Data Mining: Concepts and Techniques”,
Morgan Kaufmann, (2001).
19. Carpenter, G.A., Grossberg, S., Reynolds, J.H., “ARTMAP: supervised real-time learning and classification of non-stationary data by a self-organizing neural network”, Neural Networks, Vol. 4, (1991), 565-588.
20. Granger, E., Rubin, M., Grossberg, S., Lavoie, P., “A what-and-where fusion neural network for recognition and tracking of multiple radar emitters”, Neural Networks, Vol. 14, (2001), 325-344.
21. Cox, D.R., Oakes, D., “Analysis of Survival Data”, London:
Chapman and Hall, (1984).
22. Burez, J., Van den Poel, D., “Crm at a pay-TV company: Using analytical models to reduce customer attrition by targeted marketing for subscription services”, Expert Systems with
Applications, Vol. 32, (2007), 277–288.
23. Burez, J., Van den Poel, D., “Handling class imbalance in customer churn prediction”, Expert Systems with Applications, Vol. 36, No. 3, (2009), 4626-4636.
24. Buckinx, W., Van den Poel, D., “Customer base analysis: partial defection of behaviorally loyal clients in a non-contractual FMCG retail setting”, European Journal of Operational
Research, Vol. 164, No.1, (2005), 252–268.
25. Buckinx, W., Verstraeten, G., Van den Poel, D., “Predicting customer loyalty using the internal transactional database”,
Expert Systems with Applications,Vol. 32, (2007), 125–134.
26. Coussement, K., Van den Poel, D., “Improving customer attrition prediction by integrating emotions from client/company interaction emails and evaluating multiple classifiers”, Expert
Systems with Applications, Vol. 36, (2009) 6127–6134.
27. Eshghi, A., Haughton, D., Topi, H., “Determinants of customer loyalty in the wireless telecommunications industry”,
Telecommunications Policy, Vol. 31, (2007), 93–106.
28. Gerpott, T. J., Rams, W., Schindler, A., “Customer retention, loyalty, and satisfaction in the German mobile cellular telecommunications market”, Telecommunications Policy, Vol. 25, (2001), 249–269.
29. Glady, N., Baesens, B., Croux, Ch., “Modeling churn using customer lifetime value”, European Journal of Operational
Research, Vol. 197, (2009), 402–411.
30. Kim, H.S., Yoon, C.H., “Determinants of subscriber churn and customer loyalty in the Korean mobile telephony market”,
Telecommunications Policy, Vol. 28, No. 9/10, (2004), 751–
765.
31. Kim, M.K., Park, M.C., Jeong, D.H., “The effects of customer satisfaction and switching barrier on customer loyalty in Korean mobile telecommunication services”, Telecommunications
Policy, Vol. 28, (2004), 145–159.
32. Mazzoni, C., Castaldi, L., Addeo, F., “Consumer behavior in the Italian mobile telecommunication market”,
Telecommunications Policy, Vol. 31, (2007), 632–647.
33. Pendharkar, P., C. “Customer Genetic algorithm based neural network approaches for predicting churn in cellular wireless network services”, Expert Systems with Applications, Vol. 36, (2009), 6714–6720.
34. Seo, D., Ranganathan, C., Babad, Y., “Two-level model of customer retention in the US mobile telecommunications service market”, Telecommunications Policy, Vol. 32, (2008), 182–196.
35. Tsai, C., F., Chen, M., Y., “Variable selection by association rules for customer churn prediction of multimedia on demand”,
Expert Systems with Applications, Vol. 37, (2010), 2006–2015.
36. Van den Poel, D., Burez, J., “Handling class imbalance in customer churn prediction”, Expert Systems with Applications, Vol. 36, (2009), 4626–4636.
comprehensible customer churn prediction models with advanced rule induction techniques. Expert Systems with
Applications”, Vol. 38, (2011), 2354–2364.
38. Wei, C.P., Chiu, I.T., “Turning telecommunications call details to churn prediction: A data mining approach”, Expert Systems
with Applications, Vol. 23, No. 2, (2002), 103–112.
39. Zhao, Y., Li, B., Li, X., Liu, W., Ren, S., “Customer Churn Prediction Using Improved One-Class Support Vector Machine”, Advanced Data Mining and Applications, Vol. 3584, (2005), 300-306.
40. Idris, A., Khan, A., Lee, Y.S., “Intelligent churn prediction in telecom: employing mRMR feature selection and RotBoost
based ensemble classification”, Applied Intelligence, Vol. 39 , No.3, (2013), 659-672.
41. Phadke, C., Uzunalioglu, H., Mendiratta, V. B., Kushnir, D., Doran, D., “Prediction of Subscriber Churn Using Social Network Analysis”Bell Labs Technical Journal, Vol. 17, No. 4, 63-75.
Hierarchical Alpha-cut Fuzzy
C
-means, Fuzzy ARTMAP and Cox Regression Model
for Customer Churn Prediction
M. Mohammadi a,, S.H. Iranmanesh a, R. Tavakkoli-Moghaddama, M. Abdollahzadeh b
a School of Industrial Engineering and Research Institute of Energy Management & Planning, College of Engineering, University of Tehran, Tehran, Iran
b University of K.N. Toosi, Department of Mechanical Engineering, Tehran, Iran
P A P E R I N F O
Paper history:
Received 06 March 2013
Received in revised form 08 May 2014 Accepted 22 May 2014
Keywords: Fuzzy ARTMAP Fuzzy C-Means Cox Regression
Customer Relationship Management Churn Prediction
هﺪﯿﮑﭼ
ﯽﯾارادﻦﯾﺮﺗﺪﻨﻤﺷزراءﺰﺟنﺎﯾﺮﺘﺸﻣﻪﮐﯽﯾﺎﺠﻧآزا ﯽﻧﺎﻣزﺎﺳﺮﻫيﺎﻫ
ﻪﺑ ﯽﻣرﺎﻤﺷ زاﯽﮑﯾناﻮﻨﻋﻪﺑيﺮﺘﺸﻣشﺰﯾرﺖﯾﺮﯾﺪﻣ،ﺪﻨﯾآ
ﻢﻬﻣ ﺖﺳاهﺪﺷﻞﯾﺪﺒﺗﯽﻧﺎﻣزﺎﺳﺮﻫﻒﯾﺎﻇوﻦﯾﺮﺗ
.
شورﺮﺘﻬﺑدﺮﺑرﺎﮐودﺮﮑﻠﻤﻋ،ﻦﯿﺸﯿﭘتﺎﻌﻟﺎﻄﻣرد وﺎﮐهدادﯽﺒﺗاﺮﻣﻪﻠﺴﻠﺳيﺎﻫ
ي
ﺶﯿﭘياﺮﺑ هدادﻪﯾﺎﭘﺮﺑنﺎﯾﺮﺘﺸﻣشﺰﯾرﯽﻨﯿﺑ ﺖﺳاهﺪﺷتﺎﺒﺛاﺐﺗاﺮﻣﻪﺑنﺎﯾﺮﺘﺸﻣزاﻒﻠﺘﺨﻣيﺎﻫ
.
زاﯽﺒﺗاﺮﻣﻪﻠﺴﻠﺳيﺎﻫرﺎﺘﺧﺎﺳ
ﯽﻣهﺮﻬﺑيوﺎﮐهدادشورﻦﯾﺪﻨﭼﺎﯾودﯽﻟاﻮﺘﻣﺐﯿﮐﺮﺗ ﺪﻧﺮﯿﮔ
.
ودﺐﯿﮐﺮﺗﺎﺑﯽﺒﺗاﺮﻣﻪﺴﻠﺳشورﮏﯾﻪﻌﺳﻮﺗلﺎﺒﻧدﻪﺑﺶﻫوﮋﭘﻦﯾا
ﺶﯿﭘشور شورﮏﯾﺎﺑيزﺎﻓﯽﻨﯿﺑ ﺶﯿﭘياﺮﺑﯽﻧﻮﯿﺳﺮﮔر
ﯽﻣنﺎﯾﺮﺘﺸﻣشﺰﯾرﯽﻨﯿﺑ ﺪﺷﺎﺑ
.
شور ﻞﻣﺎﺷهدﺮﻤﺷﺮﺑيﺎﻫ
Alpha-cut
Fuzzy C-Means (αFCM) ،
Fuzzy ARTMAP
ﺲﮐﺎﮐنﻮﯿﺳﺮﮔروﻪﺘﻓﺎﯾدﻮﺒﻬﺑ
(Cox)
ﺖﺳا
.
شورلواءﺰﺟ،هﮋﯾورﻮﻃﻪﺑ
ﻪﻘﺒﻃلﺎﺒﻧدﻪﺑ ﻣمودءﺰﺟوهدﻮﺑﻪﺘﻓﺎﯿﻧشﺰﯾروﻪﺘﻓﺎﯾشﺰﯾرﯽﻠﺻاهوﺮﮔودﻪﺑنﺎﯾﺮﺘﺸﻣيﺪﻨﺑ
زاهﺪﺷدﺎﺠﯾاهوﺮﮔودﻪﺑارنﺎﯾﺮﺘﺸ
ﯽﻣﺺﯿﺼﺨﺗﻞﺒﻗﻪﻠﺣﺮﻣ ﺪﻫد
.
ﺶﯿﭘار ﻒﻠﺘﺨﻣنﺎﯾﺮﺘﺸﻣشﺰﯾرلﺎﻤﺘﺣاﺲﮐﺎﮐنﻮﯿﺳﺮﮔر،ﺖﯾﺎﻬﻧرد ﯽﻣﯽﻨﯿﺑ
ﺪﻨﮐ
.
رﻮﻈﻨﻣﻪﺑ
هدادزا،ﻪﺘﻓﺎﯾﻪﻌﺳﻮﺗشورﯽﻫدرﺎﺒﺘﻋا ﺖﺳاهﺪﺷهدﺎﻔﺘﺳاناﺮﯾاهاﺮﻤﻫﻦﻔﻠﺗيﺎﻫرﻮﺗاﺮﭘازاﯽﮑﯾيﺎﻫ
.
زانﺎﺸﻧﯽﺗﺎﺒﺳﺎﺤﻣﺞﯾﺎﺘﻧ
يﺮﺗﺮﺑ ﮏﺗشورﺎﺑﻪﺴﯾﺎﻘﻣردﻪﺘﻓﺎﯾﻪﻌﺳﻮﺗشور ﻪﻠﺣﺮﻣ
روﺬﺠﻣ،مودولواعﻮﻧيﺎﻫﺎﻄﺧيﺎﻫرﺎﯿﻌﻣردﺲﮐﺎﮐنﻮﯿﺳﺮﮔريا
درادﻖﻠﻄﻣيﺎﻄﺧوﺎﻄﺧتﺎﻌﺑﺮﻣعﻮﻤﺠﻣ
.
doi:10.5829/idosi.ije.2014.27.09c.10
![Figure 1 for pattern classification [20].. ARTMAP neural network architecture specialized](https://thumb-us.123doks.com/thumbv2/123dok_us/231239.2017702/3.595.106.238.104.222/figure-pattern-classification-artmap-neural-network-architecture-specialized.webp)