REFERENCES
1. Shafey O, Dolwick S, Guindon GE. Tobacco Control Country Profiles 2003. Available online at www.globalink.org/tccp. 2. Foulds J, Ramstrom L, Burke M, Fagerström K. Effect of
smokeless tobacco (snus) on smoking and public health in Sweden. Tobacco Control 2003; 12: 349–359.
3. Philip Morris (Australia) Limited. Corporate Affairs Plan 1992. Available online at http://legacy.library.ucsf.edu/tid/ fgw48e00.
4. Consumer Safety Unit. Regulation impact statement (revised). Trade Practices (Consumer Product Information Standard) (Tobacco) Regulation. Trade Practices Act 1974. Canberra: Commonwealth Department of the Treasury, May 2004. 5. Guindon GE, Tobin S, Yach D. Trends and affordability of
cigarette prices: Ample room for tax increases and related health gains. Tobacco Control 2002; 11: 35–43.
6. Chapman S, Byrne F, Carter SM. ‘Australia is one of the darkest markets in the world’: The global importance of Australian tobacco control. Tobacco Control 2003; 12(S-3): iii1–iii3.
7. Carter SM. Going below the line: Creating transportable brands for Australia’s dark market. Tobacco Control 2003; 12 (S-3): iii87–iii94.
8. Hill D, Chapman S, Donovan R. The return of scare tactics. Tobacco Control 1998; 7: 5–8.
9. Chapman S, Wakefield M. Tobacco control advocacy in Australia: Reflections on 30 years of progress. Health Education and Behaviour 2001; 29: 274–289.
10. Scollo M. Tobacco Control: A Blue Chip Investment in Public Health. March 2003. Available online at www.vctc.org.au. 11. Ministerial Council on Drug Strategy. National Tobacco
Strategy 1999 to 2002–03. A Framework for Action. Canberra: Commonwealth of Australia, 1999.
12. Chapman S. Tough on drugs, weak on tobacco. Med J Aust 2000;172: 612–14.
13. Transcript of the Prime Minister John Howard. Radio interview with Jeremy Cordeaux (Radio Station 5DN), 22 July 1999.
14. Pierce JP, Gilpin EA, Emery SL, White MM, Rosbrook B, Berry CC, Farkas AJ. Has the California tobacco control program reduced smoking? JAMA 1998; 280: 893–99. 15. Biener L, Harris JE, Hamilton W. Impact of the Massachusetts
tobacco control programme: Population based trend analysis. BMJ 2000; 321: 351–54.
16. McKie J, Richardson J. The rule of rescue. Soc Sci Med 2003; 56: 2407–19.
Elayne Mitchell and John Sanders
Tobacco and Health Branch NSW Department of Health
BACKGROUND
The risk factor responsible for the greatest disease burden in Australia is tobacco smoking, which accounts for approximately 12 per cent of the total burden of disease in males and seven per cent in females.1 Tobacco smoking contributes to higher drug-related morbidity and mortality than both alcohol and illicit drug use combined.2 It is the leading preventable cause of morbidity and mortality, particularly from: cardiovascular disease; cancers of the lung, larynx and mouth; and chronic obstructive pulmonary disease. It is estimated that approximately half of all long-term smokers will die from smoking-related causes.3 Smoking while pregnant contributes to an increased risk of having a low birthweight baby. Exposure to environmental tobacco smoke is known to be a risk factor for lung cancer and cardiovascular disease in adults, and for sudden infant death syndrome, asthma, and lower respiratory disease in children.4
This article presents recent Australian and NSW data that describe current tobacco use by the NSW population and provides a context for the other articles in this issue of the NSW Public Health Bulletin that focus on tobacco control in New South Wales.
CURRENT TOBACCO SMOKING BY THE NSW POPULATION AND
THE CONSEQUENCES FOR HEALTH
CURRENT SMOKING PREVALENCE
Reported prevalence rates for smoking vary according to a variety of factors associated with the design of surveys, including the data collection method used, questions asked, sample size, and the age of the sample population. A recent study discussed the causes of these perceived discrepancies in the prevalence of smoking between two Australian national surveys:5 the National Health Survey identifies ‘current smokers’, including ‘daily’ plus ‘other’ and reported a prevalence of 24.3 per cent.5 The National Drug Strategy Household Survey identifies ‘daily’, ‘weekly’, and ‘less than weekly’, and reported the prevalence of daily smoking to be 19.5 per cent.5 After standardising methods and ages, Siahpush reported that the best estimate of smoking prevalence to be almost identical in both surveys at 24.3 per cent and 24.2 per cent respectively.5
0 5 10 15 20 25 30 35 40
16–24 25–34 35–44 45–54 55–64 65–74 75+ NSW
Males Females
P
e
r cent
Age (years)
FIGURE 1
PERCENTAGE OF ALL MEN AND WOMEN AGED OVER 16 YEARS WHO ARE CURRENT SMOKERS BY AGE GROUP, NSW, 2002
Source: New South Wales Adult Health Survey 2002.Centre for Epidemiology and Research, NSW Department of Health.15
in NSW, more males smoked every day (19.1 per cent) than females (17.2 per cent); however, among those aged 14–19 years the situation was reversed with females (14.9 per cent) more likely than males (11.2 per cent) to smoke on a daily basis. More than half of the respondents (52.8 per cent) had never smoked—defined as never having smoked more than 100 cigarettes in their lifetime—with females (57 per cent) more likely than males (48.5 per cent) to describe themselves as never having smoked.
The New South Wales Health Survey definition of ‘current smoking’ includes those who smoke daily and those who smoke occasionally.7 In 2002, 21.4 per cent of the NSW population aged 16 years and over reported that they were current smokers, with 16.3 per cent smoking daily, and a further 5.1 per cent who smoked occasionally (Figure 1).7 Significantly more males (23.9 per cent) than females (18.9 per cent) reported that they currently smoke. Rates of current smoking were highest among younger people, with 27.4 per cent of females aged 16–24 years and 34.7 per cent of males aged 25–34 years being current smokers. Smoking prevalence declined with age, with 9.3 per cent of people aged 65–74 years and four per cent of those aged over 75 years being current smokers.7
Current smoking prevalence has declined significantly in NSW, in the five-year period between 1997 (24 per cent) and 2002 (21.4 per cent).7 However, there is significant geographic and socioeconomic variation in the populations who smoke. In 2002, residents of rural area health services (23.5 per cent) were more likely to be current smokers than residents of urban area health services
(20.8 per cent). Respondents from the least disadvantaged socioeconomic quintile (14.0 per cent) and residents of the Northern Sydney Area Health Service (14.2 per cent) reported significantly lower rates of current smoking, compared to the overall population of NSW (21.4 per cent). People in the second most disadvantaged quintile and residents of the Far Western Area Health Service reported higher rates of smoking (24.7 per cent and 26.9 per cent respectively).7
Although in global terms NSW has one of the lowest overall prevalence rates of current smoking, one in five people in NSW are smokers and are at risk of serious health consequences as a result. This risk extends to those who are exposed to environmental tobacco smoke. The prevalence rates for some demographic groups are much higher than for the NSW population as a whole as described below.
People from culturally and linguistically diverse backgrounds
Aboriginal and Torres Strait Islander people
The 2001 National Drug Strategy Household Survey, found that the prevalence of current smoking (including ‘daily’ and ‘occasional’) among Aboriginal and Torres Strait Islander people was 50 per cent, more than double that of non-indigenous Australians (23 per cent).6 The prevalence of daily smoking among Aboriginal and Torres Strait Islander women (47 per cent) was more than two-and-a-half times the rate for non-indigenous women (18 per cent). For Aboriginal and Torres Strait Islander men the daily smoking rate was 43 per cent, double that of non-indigenous men (21 per cent).
Secondary school students
Of NSW secondary school students aged 12–17 years who participated in the Australian Secondary School Alcohol and Drug Survey in 2002, the majority (80 per cent) described themselves as non-smokers.8,9 Compared to the previous survey in 1999, there was a significant decrease in the number of students describing themselves as a ‘recent’ smoker (defined as reporting smoking on at least one day in the week prior to the survey), from 17 per cent to 12 per cent among boys and from 19 per cent to 15 per cent in girls. This trend was observed in both sexes across all age groups except for 12 year old girls, where there was a slight increase. The highest prevalence was among 17 year olds, with 22.8 per cent of males and 25.6 per cent of females reporting that they had smoked recently. Overall, between the 1999 and 2002 surveys there was a
decline in those reporting recent smoking from 18 per cent to 13 per cent.8,9
The trend of those reporting having ever smoked has fallen consistently from the 1980s. In 1984, 57 per cent of students surveyed reported having ever smoked and in 2002, the proportion had fallen to 42 per cent. Overall, nine per cent of respondents smoked on three or more days in the previous week and four per cent smoked daily.
Smoking in pregnancy
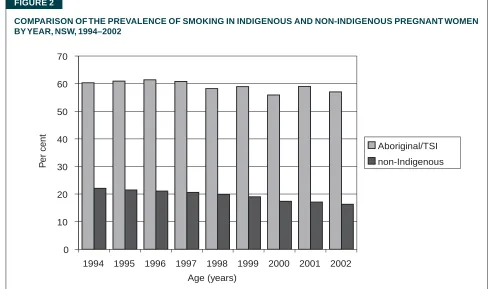
The proportion of NSW mothers reporting that they smoked during their pregnancy declined from 22.1 per cent in 1994 to 16.3 per cent in 2002.10 For the same period, the rate of smoking during pregnancy among NSW Aboriginal and Torres Strait Islander women was consistently three times that of all pregnant women in NSW and demonstrated a slower rate of decline, from 60.3 per cent in 1994 to 58.0 per cent in 2002 (Figure 2).
MORTALITY
In NSW in 2000, tobacco smoking caused an estimated 6,578 deaths (4,322 males and 2,256 females). This represents 18.5 per cent of all male deaths and 10.3 per cent of all female deaths respectively. Between 1989 and 2000, there was a 34 per cent decline in the age-adjusted rate of deaths attributable to smoking in NSW, from 129 to 86 per 100,000 population. There are significant differences between the death rates for men and women. FIGURE 2
COMPARISON OF THE PREVALENCE OF SMOKING IN INDIGENOUS AND NON-INDIGENOUS PREGNANT WOMEN BY YEAR, NSW, 1994–2002
Source: NSW Midwives Data Collection (HOIST). Centre for Epidemiology and Research, NSW Department of Health.10
0 10 20 30 40 50 60 70
1994 1995 1996 1997 1998 1999 2000 2001 2002
Aboriginal/TSI non-Indigenous
P
er cent
In 1989, smoking killed 216 men and 67 women per 100,000 population; by 2000, the rate had decreased to 132 men and 50 women per 100,000 population. Over this time, the death rate attributable to smoking declined by approximately 39 per cent for men and 26 per cent for women.11 Aboriginal and Torres Strait Islander peoples are at greater risk of requiring hospitalisation and/or dying from diseases that are attributable to smoking than are non-indigenous Australians.12
MORBIDITY
In 1999–2000, almost 54,000 NSW hospital separations were attributable to tobacco smoking, with 35,277 hospitalisations among males and 18,531 among females. This represents four per cent of all hospitalisations for males and 1.8 per cent for females. Between 1989–1990 and 1999–2000 the age-adjusted rate for tobacco-related hospitalisation for females increased by approximately 18 per cent, from 425 to 502 per 100,000 population. For males there was approximately a four per cent increase over the same period, from 1,020 to 1,057 per 100,000 population.11
It was recently estimated that hospitalisations attributable to tobacco smoking in NSW in 1999–2000 incurred hospital costs of almost $180 million, or approximately $500,000 per day.13
SECOND-HAND SMOKE
A recent estimate of the social costs of drug abuse found that there were 224 deaths in Australia in 1998–99 attributable to ‘involuntary smoking’, including exposure to environmental tobacco smoke, smoking in pregnancy, and smoking-related fires. Of these, 103 deaths occurred among those aged 0–14 years and 122 among those aged 15 years and over. Second-hand smoking was responsible for almost 78,000 bed days and $47.6 million in hospital costs in Australia in 1998–99.14
SMOKE-FREE HOUSEHOLDS
Respondents to the New South Wales Adult Health Survey 2002 were asked whether people were allowed to smoke inside their home. There was a 15 per cent increase in the proportion of respondents who reported that their home was smoke-free between 1997 (69.8 per cent) and 2002 (81.0 per cent). Overall, less than 20 per cent of respondents stated that they allow smoking in their home either ‘occasionally’ (9.8 per cent) or ‘frequently’ (9.2 per cent). There was both geographic and socioeconomic variation in the prevalence of smoke-free homes. Residents of the Northern Sydney Area Health Service (88.7 per cent) and those in the least disadvantaged socioeconomic quintile (88.5 per cent) were more likely to report that their home was smoke-free than those living in the Far Western Area Health Service (73.4 per cent) and those in the most disadvantaged quintile (74.4 per cent).15
PERCEPTIONS OF THE CURRENT SMOKING PREVALENCE RATE
Respondents to the New South Wales Adult Health Survey 2002 were asked to estimate the percentage of the population who are smokers. Around three-quarters (74.2 per cent) of respondents overestimated smoking prevalence suggesting that 30 per cent or more of the population are smokers and more than one third of respondents, (38.5 per cent) perceived that at least half of the population smoke.15
INTENTION TO QUIT SMOKING
The New South Wales Adult Health Survey 2002 found that, of those people described as current smokers, one-third planned to quit smoking within the next six months (32.9 per cent), a further 12.7 per cent planned to quit smoking within the next month, and 5.8 per cent had recently quit smoking.15
DISCUSSION
The World Health Organization describes tobacco smoking as a ‘chronic relapsing disease’ and estimates that by the year 2030 tobacco-related mortality will reach 10 million deaths per year globally, and that around 500 million people who are alive today will die from smoking.16 The World Bank suggests that efforts to reduce adult smoking (that is, increasing cessation) are likely to have a greater effect on mortality in the medium term than preventing the ‘take-up’ of tobacco smoking among young adults, and recommends addressing the balance between treatment and prevention.17
As smoking prevalence declines in the general population there is an international debate among tobacco researchers regarding the characteristics of the remaining population of smokers.18,19 As fewer and fewer people smoke, there may be a group of highly nicotine dependent smokers remaining who will find it very difficult to quit and may need more intensive support services and pharmac-otherapies. Helping these smokers to quit will be a major challenge for the health system. This is further complicated by the association between high nicotine dependence and, alcohol and other drug dependence, depression and other psychiatric conditions.18
The article in this issue of the Bulletin by Mitchell and Hailstone describes the range of activities undertaken through the NSW Tobacco Action Plan 2001–2004 to reduce the prevalence of smoking.
REFERENCES
1. Mathers C, Vos T, Stevenson C. The burden of disease and injury in Australia. Canberra: Australian Institute of Health and Welfare, 1999.
2. Australian Institute of Health and Welfare. 2001 National Drug Strategy Household Survey: Detailed findings. Drug Statistics Series No. 11. Canberra: AIHW, 2002.
3. Lopez AD, Collishaw NE, Piha T. A descriptive model of the cigarette epidemic in developed countries. Tobacco Control 1994; Sept (3): 242–247.
4. Ridolfo B, Stevenson C. The quantification of drug-caused mortality and morbidity in Australia, 1998. Drug Statistics Series No. 7. Canberra: Australian Institute of Health and Welfare, 2001.
5. Siahpush M. Prevalence of smoking in Australia. Aust N Z J Public Health 2003; 27(5): 556.
6. Australian Institute of Health and Welfare. Statistics on drug use in Australia 2002. Drug Statistics Series No. 12. Canberra: AIHW, 2003.
7. NSW Health Survey (HOIST). Centre for Epidemiology and Research, NSW Department of Health. Available online at www.health.nsw.gov.au/public-health/nswhs.
8. The Australian School Students’ Alcohol and Drug Survey. Available online at www.health.nsw.gov.au/public-health/ health-promotion/research/assad.
9. NSW Department of Health. The health of secondary school students in New South Wales 2002. N S W Public Health Bull 2004; 15(S-2).
10. NSW Midwives Data Collection (HOIST), Centre for Epidemiology and Research, NSW Department of Health. Available online at www.health.nsw.gov.au/im/ims/mdc. See also the New South Wales Mothers and Babies Reports for 1998, 1999, 2000, 2001, and 2002, which are published as
supplements of the NSW Public Health Bulletin and are available online at www.health.nsw.gov.au/public-health/phb/ bulletinsupplements.html.
11. Public Health Division. The health of the people of New South Wales: Report of the Chief Health Officer 2002. Sydney: NSW Department of Health 2002.
12. Trewin D, Madden R. (2003) The Health and Welfare of Australia’s Aboriginal and Torres Strait Islander Peoples. Canberra: Australian Bureau of Statistics, 2003.
13. Girgis ST, Ward JE. A financial case to enable state health jurisdictions to invest in tobacco control. Med J Aust 2003; 179: 539–42.
14. Collins DJ, Lapsley HM. Counting the cost: Estimates of the social costs of drug abuse in Australia in 1998–99. Canberra: National Drug Strategy, Commonwealth Department of Health and Ageing, 2002.
15. Centre for Epidemiology and Research, NSW Department of Health. New South Wales Adult Health Survey 2002. N S W Public Health Bull 2003; 15(S-4).
16. World Health Organization. Evidence Based Recommendations on the Treatment of Tobacco Dependence. Copenhagen: WHO European Partnership to Reduce Tobacco Dependence, 2001.
17. World Bank. Curbing the epidemic: Governments and the economics of tobacco control. Geneva: World Bank Publications, 1999; 80.
18. Emery S, Gilpin EA, Ake C, Farkas AJ, Pierce JP. Characterizing and identifying ‘hard-core’ smokers: Implications for further reducing smoking prevalence. Am J Public Health 2000; 90(3): 387–394.