A b s t r a c t. In Tropical Savannah flooded valley soils, very low infiltration rates often result in acidic conditions favourable to high concentrations of metallic ions, toxic for rice. Determination of the under-phreatic infiltration rate is important in drainage design to reclaim degraded soils. Several studies have addressed the mapping of the infiltration rate. Yet, its relationship with the toposequence of the valley is not clarified. This paper has investi-gated such a possibility, examining the case of the irriinvesti-gated rice valley of Tiefora, Burkina Faso. Nine boreholes – from 1 to 5 m deep – were implemented from upstream to downstream. The Lefranc permeability test of the under-phreatic level in water-logged soils – used when the impervious layer is close to soil sur-face or absent – was conducted. First, a comparative regression was applied to the data, including all the parameters of the regression curves. In the case of dissimilarity of the infiltration processes, the comparison focused on the final permeability. The results show a permeability increase from upstream (0.10±0.10 cm h-1) to down-stream (greater than 20±10 cm h-1in some places). Taking into account such a permeability increase in the subsurface drainage system design would result in implementation of more efficient and cost effective systems.
K e y w o r ds: drainage, Lefranc test, regression, one-phase-decay, permeability, Savannah
INTRODUCTION
Given the crucial role of the valley bottom in ensuring food security, soils in these areas have been submitted to intensive research and development (Nguu et al., 1988; Oosterbaanet al., 1986). In fact, valley bottoms – where the most sophisticated and rich traditional farming systems in Africa are found - represent less than 10% of the total crop production areas (Oosterbaanet al., 1986). However, valley
bottoms constitute privileged zones for various physico-chemical processes such as sedimentation and precipitation of toxic and non-toxic ions. For example, poor drainage capacity or very low permeability is closely linked to the increase in acidity and rice iron toxicity (Chérifet al., 2009).
Much research addressed the permeability characteriza-tion issue in valley bottoms. For this purpose, regional carto-graphic mapping of soil permeability and sensitivity were conducted (Camet al., 1996; Sharmaet al., 1987). Attempts were also made to assess the soil infiltration rate using re-mote sensing in arid regions (Ben-doret al., 2004). In ad-dition, regression fittings have been applied to describe in-filtration in Savannah valley bottom soils (Fagbamia and Ajayia, 1990). Though all these studies cover more or less wide zones, none of them examines the relationship between the under-phreatic level permeability and the toposequence at which it is located. Nevertheless, discriminating permea-bility values throughout a valley, where a subsurface draina-ge project is planned, can lead to a drastic reduction of the implementation costs, and much greater efficiency. The pre-sent study contributes in this area by making a comparative regression analysis of three cross sections of the valley of Tiefora in Burkina Faso (West Africa), from upstream to downstream.
MATERIALS AND METHODS
Located in southwestern Burkina Faso, at the heart of the Tropical Savannah area, the position of the irrigated rice valley bottom of Tiefora has considerably evolved during the implementation process. The geographic coordinates of Int. Agrophys., 2014, 28, 303-310
doi: 10.2478/intag-2014-0020
Comparative non-linear regression - case of infiltration rate increase
from upstream in valley
Amadou Keita
1*, Hamma Yacouba
1, Laszlo G. Hayde
2, and Bart Schultz
21
Department of Hydraulics, International Institute for Water and Environmental Engineering (2iE), Ouagadougou, 01 BP 594 Ouaga 01, Burkina Faso
2
Department of Water Science and Engineering, International Institute for Hydraulic and Environmental Engineering (UNESCO-IHE- Institute for Water Education), Delft, PO Box 3015, 2601 DA Delft, the Netherlands
Received December 11, 2013; accepted April 16, 2014
© 2014 Institute of Agrophysics, Polish Academy of Sciences
*Corresponding author e-mail: [email protected]
A A
the site are 4°33'13.19' W and 10°37'33.56' N. The valley is located some 800 m downstream from an earthen dam. This irrigation scheme was formerly intended to be constructed immediately downstream the dam, where the local popu-lation, composed essentially of Karaboro (Institut National de la Statistique et de la Démographie (INSD-BF)], 1985), was producing even though rustically a certain quantity of rice. The first idea was naturally to develop the lands into an irrigation scheme (SOGETHA, 1963). However, it appea-red that not only those lands downstream of the dam were composed of isolated pieces of soils with no surface water interconnection, but also that the soils were not so suitable for rice production (Office National des Barrages et des Aménagements Hydroagricoles (ONBAH)], 1987). After soil and topographic surveys, the 16 ha irrigation scheme was finally developed at the current site, where soils were more clayey and where the slopes and the axes of the valley were more accentuated. Afterward farmers were relocated to this new site.
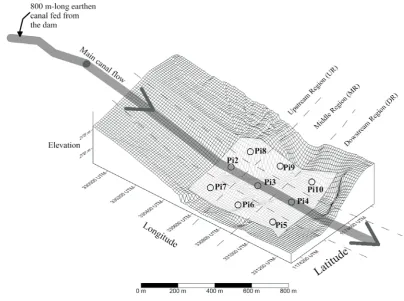
In order to get as much as possible a complete picture of the permeability in the valley, a topographic survey was con-ducted and nine borehole locations determined. The survey provided a contour lines map of the area, with the indication
of the limits of the irrigation scheme. The main axis and, per-pendicularly to it, the upstream, the middle, and the down-stream cross-sections of the valley were identified. Sub-sequently, on each of the cross sections, three points – one along the axis of the valley and two at the edges of the cross section but inside the irrigated area – were marked and their geographic coordinates determined by a topographic survey and re-checked with a Global Positioning System (Fig. 1).
In the 50-year old valley bottom, anticipating a hetero-geneous soil requiring several boreholes, two main types of boring machines were prepared. When passing through a clayey and cohesive but non-saturated soil, the Edelman auger with a 70 mm diameter was used. The body of this auger is made of two blades that tapered into two linked ‘spoons’ at the bottom, while they are connected at the top viaa bracket to an extension rod operated by a handle (Royal Eijkelkamp, 2009). Across saturated soils under the ground-water table, in layers with sand or gravelly non-cohesive material, the Riverside auger with a 70 mm diameter was used. The body of this auger consists of an open tube at the bottom of which there are two soldered spoon-shaped pie-ces. Here also a bracket connects the top of the open tube to the bottom part of the extension rod operated by a handle.
The extension rods of one-meter length with coupling sleeves were connected to the auger at the bottom, and were opera-ted on the top using a screwable handle (Royal Eijkelkamp, 2009). The boring would be ended any time a clear fine sand layer was found. The fine sand layer would create a higher infiltration rate at the bottom – not reflecting the permea-bility of the soil top layers-rapidly filling or emptying the borehole. Therefore, the borehole was clogged back with clay until complete covering of that layer. These non-lined boreholes - with depths ranging from 1 to 5 m – were used for under-phreatic level permeability measurements.
The main canal receives water from a ‘transport’ eart-hen canal, which is fed by an earteart-hen dam located 800 m upstream. The circles represent the piezometers (boreholes) installed along three cross-sections in the Tiefora valley bot-tom (Burkina Faso). Pi2 stands for Piezometer No. 2, Pi3 is the Piezometer No. 3 etc. The cross sections are located some 300 m from each other. Source: Keitaet al. (2013a).
Though several permeability measurement methods exist (Bouwer and Jackson, 1974; Peter, 1990), only two of them allowing the measurement of the under-phreatic level permeability were planned: the Hooghoudt method and the Lefranc method. The Hooghoudt method (Schilfgaarde, 1957) was not applicable because the impervious layer, sup-posed to be at a depth of 2 m, was simply absent. Conversely, the first boreholes revealed the existence of an impervious
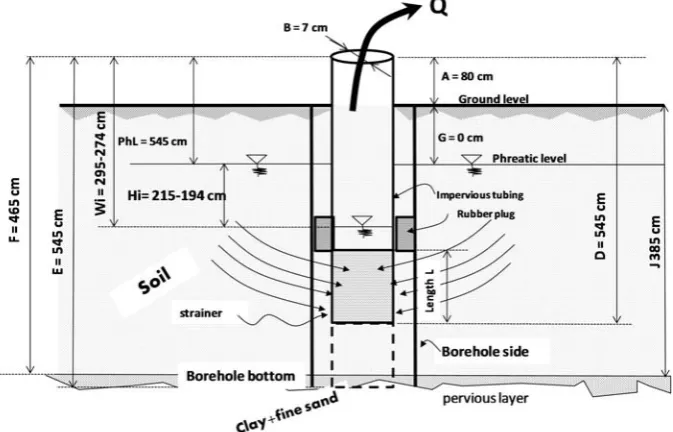
layer on the top of a pervious one. Consequently, the Lefranc method (Cassan, 2005) was used. Referring to an initial phreatic level in a soil, this method is implemented by pro-ducing a differential hydraulic head inside a cavity of known dimensions. The cavity is created at the basis of a borehole. This way, the flow towards the borehole, generated by the hydraulic head, happens only through the cavity (Fig. 2). The evolution of the differential hydraulic head – created by pumping or injecting water at a constant discharge – was measured against the time at observable decreases of the water level. The resulting timest and hydraulic head Hi intervals were used to compute the infiltration rate per time interval as it follows in Eq. (1):
I Hi Hi
t
t=- t t t
-+D
D , (1)
where:Itis the infiltration rate (cm h-1),Hit+Dt represents
the hydraulic head at instantt+Dt(cm), and theHitis the
corresponding value at instantt(Fig. 2). The negative sym-bol is used in the current pumping Lefranc test (instead of injecting) from the borehole (Hit+Dt smaller than Hit).
Statistical analysis was applied to the resulting data. The statistical analysis strove, first, to determine two suitable regression best-fit models, and to select among them the one with the most physically meaningful para-meters. For this purpose, two non-linear regression models were put to the test: the quadratic and the exponential
phase decay equations. The first selection criterion between the two models was their goodness of fit, and the second their simplicity when both displayed an equivalent first cri-terion. Finally, the last criterion was the physical mean-ingfulness of the model parameters. The considerable amount of time required for digging every borehole and achieving stabilization of the hydraulic head (Fig. 2) re-stricted the amount of data collected per borehole to gene-rally less than ten. Nevertheless, the goodness of the model was assessed using three sets of key parameters:
– the goodness of fit (especially the coefficient of determi-nation R2and the standard deviation of the residuals Syx) (Montgomery and Runger, 2011);
– the normality test of residuals of Shapiro-Wilk (1965), – the assessment of the deviation of the data from the curves
by the Runs test method (McWilliams, 1990).
Once the most suitable models were selected, the analysis focused on comparing the infiltration processes on a cross sectional basis. The major surface flow - governing sediment transports and depositions (Selley, 2000) during the flood period - suggested dividing the valley bottom into three cross sections for permeability analysis: upstream, middle, and downstream. Accordingly, the complete set of regression models found for the three boreholes of a consi-dered cross section are statistically compared. This compari-son checks whether the infiltration processes were equiva-lent or a unique permeability can be chosen for the cross section. This was down by hypothesis testing of variance of the regression parameters (Härdle and Mammen, 1993; Neumeyer and Dette, 2003). When the comparison failed for the entire set of parameters, the models were once more compared on the only basis of the most meaningful para-meter: the permeability.
RESULTS AND DISCUSSION
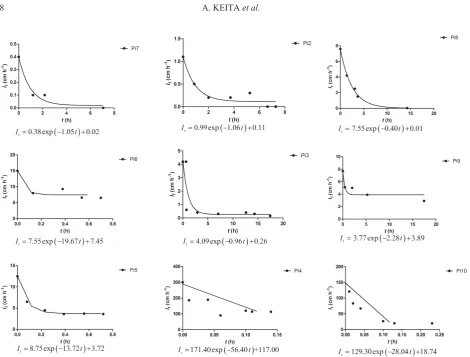
In spite of the goodness of fit of both quadratic and exponential one-phase decay models (Fig. 3), they could be discriminated based on physical meaningfulness of their parameters. For example, both models fitted with a coeffi-cient of determination R2greater than 0.70 (Rumsey, 2009). In fact, for each of the nine boreholes, both quadratic and one-phase decay models had the same degree of freedom and therefore the p-value allowing the rejection of one of the two hypotheses could not be computed. However, while the coefficients in the quadratic Eq. (2) had no real physical meaning, the exponential one-phase decay Eq. (3) did. The two equations are:
It=B0+B t1 +B t2 2, (2)
It=(Y0-Plateau)exp(-Kt)+Plateau, (3)
where:B0(cm h-1) ,B1(cm h-2),B2(cm h-3) as the
coeffi-cients in the quadratic equation, andt, the time variable (h); It- the infiltration rate (cm h-1) at instantt; the coefficients
Y0and Plateau (cm h-1);K– the coefficient (1 h-1), and the
instantt(h). Plateau represents the limit of the functionIt
when the timetbecomes infinite.
At most, the quadratic function admits one extremum corresponding to the point where the first derivative is null. There is no limit to this function when the timettends to infinite, and the zero intercept equalB0possesses no phy-sical meaning as far as groundwater flow is concerned. By contrast, the exponential one-phase decay function was suc-cessfully used in many cases. It is applicable anytime the rate, at which one variable is altered, depends on the remaing amount of that same variable. Well-known examples in-clude already the soil infiltration rate determination (Horton, 1941), the decay of radioactive isotope atoms (Gardneret al., 1959; Varani et al., 1990), and the turnover of blood cells in HiV-1 infection (Hoet al., 1995). In other words, it is most appropriate in the present case where there is a decrea-se in time (deceleration) of the flow ratedI/dt at a velocity that can be considered proportional to the infiltration rateI. In these conditions, the equation can be expressed as:
dI
dt=KI, (4)
where:dI/dt(cm h-2) is the average flow rate change (dece-leration) in the soil medium during a short durationdt; K is a constant of proportionality (1 h-1), andIis the infiltration rate (cm h-1).
It can be verified that the following improper integral is a solution of Eq. (4):
I=C1exp(-Kt)+C2, (5)
where:C1(cm h-1) the ‘span’ of variation of the infiltration
rate withtincreasing from zero to infinite (it corresponds to Y0-Plateau in Eq. (3)). The coefficientC2 (cm h-1) is the
‘Plateau’, the limit of the function when t increases infinitely.
All the parameters of Eq. (3) – which is the same as Eq. (5) – possess a clear physical meaning in the groundwater flow. That explains why this model was selected. At the beginning of the measurements in the saturated soil, whent= 0 and the hydraulic head and hence the infiltration rate over the first minutes are the highest, the initial infiltration rate equals ‘span+plateau’ (C1+C2). Then, while the experiment progres-ses, the hydraulic head decreaprogres-ses, reducing the infiltration rate. The infiltration rate depends on the remaining water layer and the process can therefore be described by an ex-ponential one-phase decay regression. At greater values of the timet, the infiltration rate is smaller. Theoretically, when ttends to infinite, the asymptote of the function provides the value of the under-phreatic level permeability, plateau ex-pressed in Eq. (3). Therefore, the value of the plateau can be used as the key parameter for subsurface drainage if any solute (eg. excess of aluminium, ferrous iron, sulphuretc.) has to be removed from the submerged soil (Suryadi, 1996).
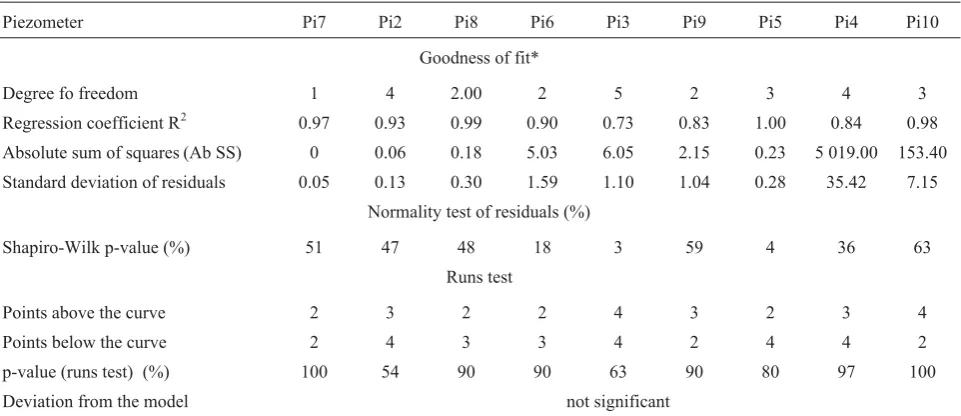
Table 1, the coefficient of determination R2for example ranged from 0.70 to 1.00. However, as is known, R2is not sufficient to conclude on the goodness of fit of a model (Boslaugh and Watters, 2008). The normality test of the resi-duals gave p-values also greater than the significance level
a=5% (except for boreholes Pi3 and Pi5), allowing a con-clusion for the normality of the residuals. Finally, the results yielded also an adequate distribution of the data around the curves, as shown by the values of the Runs test and Fig. 3 (Härdle and Mammen, 1993).
The three piezometric boreholes Pi7, Pi2, and Pi8 data on top represent the upstream cross section; the data of Pi6, Pi3, and Pi9 the middle cross section, and the data of Pi5, Pi4, and Pi10 the downstream cross section. The exponen-tial one-phase decay regression curves represent the indivi-dual best fit curves, when no comparison is made among the borehole infiltration processes.
The one-phase decay regression modelling from up-stream to downup-stream revealed a great variability not only in the infiltration processes, but also in the value of the stabili-zed permeability or plateau (Fig. 3). The attempt to make three regression equations with one related to each of the three cross sections (upstream, middle, and downstream), led to the rejection of this null hypothesis of similar pro-cesses with respective p-value of 0.01% for upstream, and 0.09 and 0.01% for the middle and downstream, respec-tively. Therefore, for all the cross sections the coefficients Y0,K, and plateau of Eq. (3) were different and hence the infiltration processes dissimilar.
The important variability in the permeability – not very convenient for drainage engineering – can be lessened on valid statistical basis. In fact, the subsurface drainage design uses a small number of permeability values to implement projects in swampy areas (Keitaet al., 2013b; Wesströmet al., 2001). Hence, in the case of Tiefora, one can loosen the constraints upon the infiltration processes and statistically compare only the plateau values (under phreatic permea-bility) in each cross section. This examination reveals that the under-phreatic level permeability is similar (p-value greater 5%) for the three boreholes (Pi7, Pi2, and Pi8) in the up-stream cross section. Their plateau equals 0.10±0.10 cm h-1. They are also similar for the three boreholes (Pi6, Pi3, and Pi9) in the middle section, where the plateau equals 0.30± 1.30 cm h-1(Table 2). Therefore, though the infiltration pro-cesses are different, a single permeability can be used for the upstream cross section on the one hand and the middle cross section on the other hand. However, the variability is so im-portant in the downstream cross section that a unique per-meability cannot be chosen.
The remarkable increase in the permeability from upstream to downstream in the valley bottom (Fig. 1 and Table 2) cannot simply be explained by soil alteration. Two major phenomena are generally considered to explain valley bottoms genesis (Schaetzl and Sharon, 2005). First, it is assumed that valley bottoms and streams generally appear on the top of deep fractures of the sound rocks (CIEH, 1987) as the consequence of rock chemical alteration driven by
Piezometer Pi7 Pi2 Pi8 Pi6 Pi3 Pi9 Pi5 Pi4 Pi10
Goodness of fit*
Degree fo freedom 1 4 2.00 2 5 2 3 4 3
Regression coefficient R2
0.97 0.93 0.99 0.90 0.73 0.83 1.00 0.84 0.98
Absolute sum of squares (Ab SS) 0 0.06 0.18 5.03 6.05 2.15 0.23 5 019.00 153.40 Standard deviation of residuals 0.05 0.13 0.30 1.59 1.10 1.04 0.28 35.42 7.15
Normality test of residuals (%)
Shapiro-Wilk p-value (%) 51 47 48 18 3 59 4 36 63
Runs test
Points above the curve 2 3 2 2 4 3 2 3 4
Points below the curve 2 4 3 3 4 2 4 4 2
p-value (runs test) (%) 100 54 90 90 63 90 80 97 100
Deviation from the model not significant
*Null hypothesis – the most suitable regression equation is exponential one-phase decay (expntl). Alternative hypothesis – the best fit function is a quadratic (quad) function (second order polynomial).
acidic water (Jackson and Sherman, 1953). Then, the fracture develops transversal and longitudinal slopes and clay tends to accumulate. The second phenomenon, simul-taneous to the first, consists of periodic or continual deposits of thin layers of colluvial, alluvial, or eolian sediments (Moormann and Breemen, 1978). That deposit changes the profile. These theories do not address the change in permea-bility from upstream to downstream.
From a different standpoint, the sedimentation process can greatly help explain the toposequential increase in per-meability. The sediment transport and deposition processes have been object of several important studies (Selley, 2000). As shown by the results (Table 2), the permeability is much higher downstream with over 20±10 cm h-1than upstream with 0.10 ± 0.10 cm h-1. This observation can be explained to some extent by heterogeneity of downstream. The bore-hole soil data showed a thicker clay layer upstream and in the middle than downstream, where a quartzic stony soil is found more rapidly near the soil surface. However, in lakes and dams, the water flow conveys water from a relatively narrow irregular channel to an extended area, causing the
drop of velocity. Heavier particles like sand deposit first, while fine clay particles will deposit in the reservoir bed later but in a greater amount near the dam located farther. The permeability would therefore be lower near the dam. The phenomenon is inverted in flood plains: when the sediment loaded water invades the area, fine clay particles are deposited farther, upstream. Therefore, the permeability will tend to be lower upstream. We think this last process ap-plies to the case of Tiefora, where the irrigated valley bottom continues to be flooded from downstream twice a year by the Lafonde River (Kanté, 2011).
The practical implications of such a toposequential variation of the permeability are important. In effect, it is well known (Skaggs, 2007) that the spacing of subsurface drainage pipes is smaller when the under-phreatic permea-bility is small, in order to be able to intercept more important flow. Therefore, drain pipe density in a valley bottom with a significant permeability increase from upstream to down-stream will also conversely decrease from updown-stream to downstream. This consideration can lead to a more effective drainage at lower cost in comparison to a uniform piping of a swampy area.
CONCLUSIONS
1. Comparative regression analysis can be used to assess the equivalence of infiltration processes and to determine a toposequential distribution in a valley bottom with very positive economic implications for subsurface drainage.
2. The results show that no unique infiltration process is valid for the whole valley. However, confining the com-parison criterion only to the under-phreatic permeability reveals that it increases for upstream with 0.10±0.10 cm h-1 to more than 20±10 cm h-1in some areas downstream, in spite of the differences of the infiltration curves.
3. Taking into account that subsurface drainage pipe spacing is bigger – and then the density of implantation is smaller – when the permeability increases, greater effi-ciency and money saving in the drainage system design and operation of valley bottoms can be achieved.
REFERENCES
Ben-dor E., Goldshlegerb N., Braunc O., Kindeld B., Goetzd A.F.H., Bonfile D., Margalitc N., Binayminib Y., Karnielif A., and Agassib M., 2004.Monitoring infiltration rates in semiarid soils using airborne hyperspectral technology. Int. J. Remote Sensing, 13, 2483-2664.
Boslaugh S. and Watters P.A., 2008. Statistics in a nutshell. OReilly, USA.
Bouwer H. and Jackson R.D., 1974.Determining soil proper-ties. In: Drainage for Agriculture, Agronomy (Ed. J. van
Shilfgarde). American Society of Agronomy, Madison, WI, USA.
Cam C., Froger D., Moulin J., Rassineux J., and Servant J., 1996. Cartographic representation of the soils ability to vertical infiltration-thematic map of vertical infiltration (in French). Etudes et Gestion des Sols, 3, 97-112.
Cassan M., 2005.Permeability in-situ tests for the indentification of soils (in French). Presses de l'e´cole nationale des Ponts et chausse´es, Paris, France.
Chérif M., Audebert A., Fofana M., and Zouzou M., 2009. Evaluation of iron toxicity on lowland irrigated rice in West Africa. Tropicultura, 27, 88-92.
CIEH,1987.Research of deep fractures in the cristalline basement area using boreholes logs with important discharge and the lineation of Lansat with advanced geophysical methods (in French). Ouagadougou, Burkina Faso.
Fagbamia A. and Ajayia F.O., 1990.Valley bottom soils of the sub-humid tropical southwestern nigeria on basement complex: characteristics and classification. Soil Sci. Plant Nutr., 36, 179-194.
Gardner D.G., Gardner J.C., Laush G., and Meinke W.W., 1959. Method for the analysis of multicomponent exponential decay curves. J. Chemical Physics, 31, 978-986.
Härdle W. and Mammen E., 1993.Comparing nonparametric versus parametric regression fits. Annals Statistics, 21, 1926-1947.
Ho D.D., Neumann A.U., Perelson A.S., Chen W., Leonard J., and Markowitz M., 1995.Rapid turnover of plasma virions and CD4 lymphocites in HIVE-1 Infection. Nature, 373, 123-126.
Piezo-meter
Pi7 Pi2 Pi8 Pi6 Pi3 Pi9 Pi5 Pi4 Pi10
Section
Upstream Middle Downstream
Y0 0.40±0.31 1.09±0.30 7.56±0.30 13.02±2.29 4.35±2.78 6.16±1.74 12.47±0.65 288.5±73.20 148.10±33.3 K 1.94±8.53 0.93±0.13 0.40±0.72 1.21±0.62 0.99±1.73 0.06±0.08 13.72±3.12 56.4±78.80 28.04±15.74
Span1 0.32±0.33 1.02±0.29 7.50±0.32 12.70±2.61 4.30±3.00 5.84±2.14 8.75±0.73 171.40±79.5 129.30±30.7 Plateau 0.07±0.13 0.07±0.13 0.07±0.13 0.32±1.30 0.32±1.30 0.32±1.30 3.72±0.36 117.00±40.80 18.74±12.95
Goodness of models
R2 0.93 0.92 0.99 0.68 0.73 0.68 -0.01 0.70 0.97
Absolute sum of square
0.01 0.07 0.18 15.55 6.07 4.17 61.13 0.92 246.70
Unique plateau for cross section p-value (%)
84.40 5.20
Unique plateau for cross section p-value (%) Individual plateau values for each borehole
0.07 ± 0.13 0.32 ± 1.30 3.72±0.362 117.00±40.80 18.74±12.95
1
Horton R.E., 1941.An approach towards physical interpretation of infiltration capacity. Soil Sci. Soc. Am. J., 5, 399-417. Institut National de la Statistique et de la Démographie (INSD-BF),
1985.General sensus of the population. Structure per age and sex of the villages of Burkina Faso. Ouagadougou, Burkina Faso.
Jackson M.L. and Sherman G.D., 1953.Chemical weathering of minerals in soils. Advances Agronomy, 5, 219-318. Kanté I., 2011.Characterisation of the topography, hydrology and
pedology of the valley bottom irrigation field of Tiéfora in the Comoe province (in French). Water and Sanitation Valorisation Unit, International Institute for Water and Environmental Engineering (2iE) Press, Ouagadougou Burkina Faso.
Keita A., Schultz B., Yacouba H., and Hayde L.G., 2013a.Clay and ferrous iron stratifications in a tropical savannah valley bottom soil under irrigated rice. Academia J. Agric. Res., 1, 204-210.
Keita A., Yacouba H., Hayde L.G., and Schultz B., 2013b. A single-season irrigated rice soil presents higher iron toxicity risk in tropical savannah valley bottoms. Open J. Soil Sci., 3, 314-322.
McWilliams T.P., 1990. A distribution-free test for symmetry based on a runs statistic. J. American Statistical Assoc., 85, 1130-1133.
Montgomery D.C. and Runger G.C., 2011.Applied statistics and probability for engineers. Wiley Press, Hoboken, NJ, USA. Moormann F.R. and Breemen N.v., 1978.Rice: soil, water, land.
Int. Rice Research Institute (IRRI), Los Banos Laguna, Philippines.
Neumeyer N. and Dette H., 2003.Nonparametric comparison of regression curves: an empirical process approach. Annals Statistics, 31, 880-920.
Nguu N.V., Gibbons J.W., and Dobson R.L., 1988.Performance of rice (Oryza sativa) on slopes of inland valleys in West Africa. Elsevier Sci. Press, 18, 113-125.
Office National des Barrages et des Aménagements Hydro-agricoles (ONBAH),1987.Study of small dams and irri-gation schemes in the South-West Feasibility of the site of Tiéfora (in French). Ouagadougou, Burkina Faso.
Oosterbaan R.J., Gunneweg H.A., and Huizing A., 1986.Water control for rice cultivation in small valleys of West Africa. International Institute for Land Reclamation and Impro-vement (ILRI) Press, Wageningen, the Netherlands. Peter D.J., 1990.Methods for measuring the saturated hydraulic
conductivity of tills. Nordic Hydrol., 21, 95-106.
Royal Eijkelkamp,2009.Sample ring kits - operating instructions. Royal Eijkelkamp Press, ZG Giesbeek, the Netherlands. Rumsey D., 2009. Statistics II for dummies. Wiley Press,
Hoboken, NJ, USA.
Schaetzl R.J. and Sharon A., 2005.Soils genesis and geomo-rphology. Cambrige University Press, New York, USA. Schilfgaarde J.v., 1957.Appropriate solutions to drainage flow
problems. In: Drainage of agricultural lands, Agron. Moanogr. (Ed. J.N. Luthin). ASA Press, Madison, WI, USA. Selley R.C., 2000.Applied sedimentology. Academic Press, San
Diego-London-Burlington.
Shapiro S. and Wilk M.B., 1965.An analysis of variance test for normality: complete samples. Biometrika, 52, 591-611. Sharma M.L., Barron R.J.W., and Fernie M.S., 1987.Areal
distribution of infiltration parameters and some soil physical properties in lateritic catchments. J. Hydrol., 94(1-2), 109-127.
Skaggs R.W., 2007.Criteria for calculating drain spacing and depth. Trans. ASABE, 50, 1657-1662.
SOGETHA,1963.Tender for supply dossier for rural hydraulic developpement scheme of the Tiéfora plain (in French). Ouagadougou, Burkina Faso.
Suryadi F.X., 1996.Soil and Water Management Strategies for Tidal Lowlands in Indonesia. Delft University of Techno-logy Press, Deft, the Netherlands.
Varani G.-F., Meikle W.P.S., Spyromilio J., and Allen D.A., 1990. Direct observation of radioactive decay in Supernova 1987A. Monthly Notices Royal Astronomical Soc., 245, 570-576.