Application of adsorption methods to determine the effect of pH and Cu-stress
on the changes in the surface properties of the roots*
Alicja Szatanik-Kloc
Institute of Agrophysics, Polish Academy of Sciences, Doświadczalna 4, 20-290 Lublin, Poland
Received February 5, 2013; accepted May 23, 2014
Corresponding author e-mail: [email protected]
*This work was partly supported from the budget for science
under grant No. N310 017 32/1297, 2007-2010. © 2014 Institute of Agrophysics, Polish Academy of Sciences A b s t r a c t.Rye plants were grown in a nutrient solution prepa-
red according to Hoagland for 2 weeks at pH 7, next for 14 days at pH 4.5 (without Cu+2) and in the presence of 20, 50, or 100 mg dm-3
copper ions. The control plants were grown continuously at pH 7. The physicochemical surface properties of the roots were exa- mined using two adsorbates – polar (water vapour) and non-polar (nitrogen). The surface properties of the roots grown at pH 4.5 without Cu+2 were apparently the same as those of controls. The
roots of rye which grew in the presence of Cu+2 were characte-
rized by lower (relative to controls) specific surface area values. Statistically significant differences in the size of the apparent surface area (determined by water vapour) were reported for roots in- cubated with copper ions at a concentration of 20 and 50 mg dm-3.
The average water vapour adsorption energy of the root surface decreased under the stress conditions. There were no statistically significant differences for the free surface area and characteristic energy of nitrogen adsorption.
K e y w o r d s: adsorption energy, water vapour/nitrogen, appa- rent and free surface area, pH, roots, copper
INTRODUCTION
Like most other metals, copper is taken up by roots and used as a trace element for activation of many enzymes (Buchanan et al., 2000). It plays a key role in photosynthetic
and respiratory electron transport chains, ethylene sensing,
cell wall metabolism, oxidative stress protection, and bio-genesis of the molybdenum cofactor (Yruela, 2009). Copper deficiency or excess can have a negative impact on plants. According to Kabata-Pendias and Pendias (1999), the total
content of Cu in agricultural Polish soil is in the range from
0.2 to 725 mg of copper kg-1 of soil. In general, copper
is strongly bound in soil. Low soil pH (pH <5) is one of the factors that increase the solubility of copper
(Sukreeya-pongse et al., 2002). The harmfulness of copper in the
biosphere is observed at certain concentrations of the soil solution (Sukreeyapongse et al., 2002; Tye et al., 2004). Plants absorb copper, usually in the form of Cu+2. The
amount of copper uptake by plants is proportional to the content of a soluble form of this element in the substrate (soil solution, culture medium). The optimum copper con-tent in the plants is between 5-20 mg kg-1 dry mass. The
copper content in the range 20-100 mg kg-1 dry mass may
be toxic for most plants (Kabata-Pendias and Pendias, 1999; Manivasagaperumal et al., 2011). The toxic impact of high concentrations of copper ions on a number of metabolic and physiological processes as well as morphological, biochemi-cal, and anatomical changes in plants have been demonstra-ted in many studies (Kopittke and Menzies, 2006; Michaud et al., 2008). The roots of plants are first exposed to the pho-totoxic effects of copper. The visible symptom of copper toxi-city is the reduction of the elongation growth, thickening and shortening of the roots, and in extreme cases root die-back. Copper toxicity was visible in damaged plant roots, with symptoms ranging from disruption of the root cuticle and reduced root hair proliferation to severe deformation of the root structure (Sheldon and Menzies, 2005). In addition to the structural changes, a number of biochemical chang-es in the roots exposed to high concentrations of copper were observed (Yruela, 2009). Since copper is a cofactor of many oxidases, the activity of the following enzymes can be changed:
- ascorbate oxidase located in the apoplast and regulating its redox state,
- laccase located in the apoplast, whose function is not well
understood although it is assumed to play a role in the
- multi-copper oxidase-like proteins involved in the cell wall formation process (Sedbrook et al., 2002).
Furthermore, stress activates a series of reactions asso-ciated with plant tolerance mechanisms in the roots. The main purpose of these mechanisms is to prevent accu-mulation of toxic concentrations of the metal in the sensitive areas of the root cell. Binding of Cu ions with the cell wall, increased synthesis of organic acids (citrate, malate, oxalate) and carbohydrates as well as proteins or peptides enriched in the cysteine or histidil groups excreted by plants (Yruela, 2009) are examples of mechanisms related to the Cu-stress, which act at the apoplast level.
In this study, it was assumed that the anatomical and biochemical changes associated with Cu stress would also affect the physicochemical properties of the surface roots.
Particular attention is focused on the surface area of the
roots. The specific surface area of roots (S) is (next to the cation exchange capacity) the other physicochemical magnitude that characterizes the uptake and transport (close to) of water and ions by the roots.
The specific surface area in plant roots is determined by the properties of the cell apoplast (the cell wall and free intercellular spaces), which forms the outer root tissue – the epidermis and primary cortex. The role of the cellular compartment in the detoxification of heavy metals is the subject of many studies (Manara, 2012).
In order to characterize the specific surface area of the
roots,the method of adsorption-desorption was used. The
basis of the adsorption – desorption method is to determine the quantity of a known substance (adsorbate), which is adsorbed on the surface of the investigated material (adsorbent), for example roots. Water vapour and nitrogen are the most common adsorbates. Due to the fact that water vapour as a polar adsorbate characterizes the polar adsorption centres while nitrogen characterizes non-polar
adsorption centres located on the surface of the tested
material, both adsorbates were used in the study.
The aim of the research, whose results are presented in this material, was to:
- determine the effect of phytotoxic concentrations of
cop-per ions on the changes in the surface area and adsorption energy of rye roots, and
- demonstrate whether these changes can equally be characterized by a polar adsorbate – water vapour and a non-polar adsorbate – nitrogen.
MATERIALS AND METHODS
Plant seeds were sown in blown polyethylene containers (5 dm3 capacity each) with styrofoam inserts in the drilled
holes. The reverse side of the insert was provided with a polyethylene network. Filter paper was placed between the insert and the polyethylene network. 80 seeds were sown in each container. After germination, 40 plants were left and
the filter paper was removed. The growth and development of the plants was carried out in hydroponics with strictly controlled mineral composition and pH of the medium. The medium was prepared according to a modified Hoagland medium supplemented with a complete set of micronutrients (Starck, 2007). The level of the medium was controlled every 24 h and if necessary supplemented with distilled water; the medium was entirely replaced every 7 days. The growth and development of the plants was performed in a daily cycle 16/8 h (day/night) at 296 K room temperature in the daytime and at 289 K overnight. Sodium 400th WLS lamps (lights intensity = 300µmol ∙ m-2 ∙ s-1 PAR - Photosynthetic
Active Radiation) were used. In order to ensure proper aero-bic conditions, the medium was additionally aerated using air pumps. In the initial phase of growth and develop-ment, the plants were grown in the medium at pH = 7 (Szatanik-Kloc, 2010, 2012). Copper phytotoxicity in-creases in soils with pH <5; therefore, 4 weeks after plant emergence, the medium pH was lowered to pH = 4.5 in some of the containers. Copper was added to the medium as hydrated copper sulphate (CuSO4 x 5 H2O) and Cu+2
ions were supplied in concentrations of 20, 50, and 100
mg dm-3. Plantsgrown continuously at pH 7 and pH 4.5
(without Cu+2 addition) were used as controls. Leaving
the plants at pH = 4.5 (without Cu+2) allowed us to assess
the effect of pH on the studied physicochemical properties
of roots. The pH of the medium was maintained at pH = 7 ± 0.2 for the control material and pH = 4.5 ± 0.2 for the stress caused by the low pH and the presence of copper ions. The medium was adjusted witha 0.1 mol dm-3
potassium hydroxide (KOH) solution and a 0.1 mol dm-3
hydrochloric acid (HCl) solution. The experiment was
re-peated three times. In order to remove the excess of the
nu-trient solution, the roots were washed with 0.001 mol dm-3
hydrochloric acid (HCl) and three times with distilled water. Studies conducted previously have shown that the
application of the procedure does not affect the surface
properties of the roots examined (Szatanik-Kloc, 2010). In the case of copper ions, it was demonstrated that the content of this element in the roots treated using the proce-dure described above amounted to 0.27 ± 0.01 g kg-1 dry
weight of root. In contrast, the content of Cu in roots to without this procedure was applied amounted to 0.26 ± 0.02 g kg-1 dry weight of root. In addition, no differences between
The water vapour and nitrogen adsorption on plant roots has polymolecular character. The method requires no sophisticated equipment. An adsorption isotherm is a func-tion relating the amount of adsorbed gas (vapour), a (g g-1),
to its equilibrium pressure p (Pa) during the pressure in-crease at a constant temperature. A desorption isotherm is the function measured during the pressure decrease.
Water vapour adsorption-desorption isotherms were measured using the vacuum chamber method at a constant temperature kept at 298±0.l K. The root samples (ca. 0.3 g air-dry roots) placed in the weighing vessels were put in a vacuum chamber over sulphuric acid solutions with decreasing concentrations (increasing the relative water vapour pressure p/p0). In the next step, the acid
concentra-tion was increased (a decrease in the relative water vapour
pressure p/p0) to measure the desorption of water from roots. Adsorption isotherms describe the amount of adsorbed gas (vapour), a (g g-1), at different equilibrium pressures
p (Pa) at a constant temperature. Desorption isotherms are the opposite. The mass of the root plus the mass of the water adsorbed on the root at a given pressure, a(p/p0),
were measured by weighing after 48 h of equilibration. After finishing the desorption measurements, the dry mass
of the roots mrwas determined by weighing the samples
after overnight drying at a temperature of 378 K. The amount of water adsorbed on the unit mass of the roots at a given pressure, a(p/p0), was calculated after subtracting
the mrfromthe a(p/p0) value and dividing the result by mr (Józefaciuk and Szatanik-Kloc, 2003). The relative vapour pressure (p/p0) over sulphuric acid at a given density was
calculated on the basis of data provided in the Physical Chemistry Handbook (Lide, 2004) and own calculations.
The adsorption-desorption isotherm of nitrogen vapour was measured instrumentally using Sorptomatic 1990 CE apparatus provided by FISONS (Italy) and a computer pro-gram Milestone 200. A sample of ca. 0.3 g of roots was placed in a container immersed in liquid nitrogen. The container was then outgassed and connected to a gase-ous nitrogen source of stepwise increasing pressure. The amount of the adsorbed gas was measured from the amount of nitrogen injected and its equilibrium pressure over the analyzed sample. Knowing the saturated vapour pressure of nitrogen at 292 K, the relative nitrogen vapour pressure was estimated (computer program Milestone 200) and the isotherms data were saved. Using these data, the isotherms were plotted and nitrogen surface areas and adsorption energies were calculated similarly as for water vapour adsorption. Water vapour and nitrogen adsorption-des-orption isotherms were measured in three replicates. The variations in the replicated data did not exceed 5%.
Surface area and adsorption energies were calculated using experimental desorption data for the p/p0 range
bet-ween ca. 0.05 and 0.6 (statistical monolayer capacity – am),
based on Eq. (1). In this pressure range, the data correlated
best (R2 > 0.95) with the linear form of the Aranovich
equation (Aranovich, 1992). In the linear form, this equation is as follow:
m
m a
x C a x
a
x = +
−
1 ) 1
( 2
1
where: a (g g-1) - amount of adsorbed (nitrogen/water)
vapour at the relative vapour pressure p/p0 = x (p0 is the
saturated vapour pressure) at temperature T (K), am(g g-1)
– statistical monolayer capacity, C = exp{(Ea-Ec)/RT} – constant related to the adsorption energy – Ea (J mol-1),
and the condensation energy of nitrogen/water vapour, Ec (J mol-1) and R(mol-1 K-1) is the universal gas constant.
Surface area values of the analysed roots were calculated from adsorption data using the above equation. At first, the am values were estimated from the slopes of the linearity range of Eq. (1), and next the surface areas of the samples were calculated as:
M a L S= ⋅ω⋅ m
where: L is Avogadro number, M is the molecular mass of
the adsorbate and w is the area occupied by a single adsor-bate molecule. The w value for water was taken as 1.08 10-19 m2 and for nitrogen as 1.62 10-19 m2 (Gregg and Sing,
1967, quoted by Józefaciuk et al. (2013).
Due to the fact that organic materials (such as humic acids, peat, plant roots) have slightly different sorption
properties than eg soil or minerals, Chiou et al. (1990) pro-posed using for the organic materials (instead of ‘surface area’) the name ‘apparent surface area’ in the method of adsorption-desorption of water vapour and the name ‘free surface area’ in the method of nitrogen adsorption-desorp-tion. Therefore, these names are used further in the paper.
Chemically different groups of atoms of various kinds and polarity (eg carboxylic, hydroxylic, phosphate, amine, peptide, located on various cell components) are present on root surfaces. These different surface groups (adsorp-tion sites – centres) bind adsorbate molecules with different forces (and energies), which in turn influences the adsorp-tion pathways. The input of different energy sites – centres to the total adsorption can be characterized by the adsorp-tion energy distribuadsorp-tion funcadsorp-tion. This funcadsorp-tion should be estimated from adsorption in the first layer (monolayer), because in next layers the surface adsorption forces are screened by already adsorbed molecules. The calculations of adsorption energy distribution functions were performed using adsorption data.
According to the theory of adsorption on heterogeneous
surfaces (Jaroniec and Brauer, 1986; Jaroniec et al., 1976; Kowalczyk et al., 2004), the total adsorption at a given
pressure p can be expressed as a sum of local adsorptions
ai on a given site of energy Ei= (Ea,i - Ec)/RT, where Ea,i is adsorption energy of the i-th site:
(1)
a(p) =
i n
=
∑
1 ai(p,Ei). (3)
Thus the total adsorption isotherm, Qt(p), can be written as
a sum of adsorptions on each sites, Qi(p, Ei), weighted by
their fractions, f(Ei):
(4)
where: am,i is the monolayer capacity of site i and values of f(Ei) fulfil normalization condition:
i n =
∑
1f(Ei) = 1. (5)
If the local adsorption isotherm in Eq. (4) is expressed by the Aranovich equation:
(6)
where: Ci is the value of the constant C of site i.
Solving Eq. (6) in respect to f(Ei) is an ill-conditioned problem. Small variation in experimental data can cause large variation in estimation of site fractions. The least sensitive to the experimental error, reasonably accurate, and most convenient way to overcome this problem is to apply the condensation approximation CA. This method is based on replacement of the true local isotherm by a step-function. Every pressure value becomes associated with the corresponding value of the adsorption energy, which provides adsorption equal to one-half of that at infinite energy. Following this definition, the final formula for
calculation of site fractions is:
i i i i i i
i E E
E x E x E f − ⋅ Q ⋅ − + ⋅ Q ⋅ − = + + + 1 1 2 1 1 1 2 1
1) (1 )
1 ( )
( (7)
where: xi = p/p0 – relative vapour pressure (p0 is the saturated
vapour pressure), x i+1 – next value of p/p0, Θl = a/am, – local
adsorption isotherm, a (g g-1) – amount of adsorbed (water
vapour /nitrogen), am(g g-1) – statistical monolayer capacity,
Ei= (Ea,i, - Ec) where Ea,I: adsorption energy of the i-th site, Ec: condensation energy, and E i+1: adsorption energy of next fractions. Adsorption energy is connected with the pressure of the adsorbate as follows from f(Ei) values, the average water vapour adsorption energy, Eav, can be calculated as:
Eav=
∑
=
n
i1
Ei f(Ei). (8)
The calculation of adsorption energy distribution functions (f(Ei) against Ei dependencies) was performed using Eq. (7). Energy values were expressed in the units of thermal energy, RT. The range of scaled energy (Ea-Ec)/RT from 0 to –7 was considered. The scaled energy equal to 0 holds
for energy adsorption equal to the condensation energy of
the vapour. The value of –7 was taken as the maximum adsorption energy. The maximum energy value in the condensation approximation should relate to the minimum value of the p/p0 applied. The minimum relative pressure
in our water vapour adsorption data sets was around 0.004, which corresponds to energy adsorption of ca. –5.5. Thus, it was reasonable to assume –6 as the maximum energy in the present investigations. However, this value can be considered only as a first estimate of the maximum energy because of the lack of experimental data at lower relative pressures. We arbitrarily set the maximum energy to –7 in the belief that if there were no sites with higher adsorption energies than –6, the corresponding values of f(Ei) will be close or equal to zero. Providing enough precision of the estimation of energy distribution functions for the replica-tes of water adsorption data required detection of the ad-sorbing sites differing at least by 1 energy unit. The value of adsorption (Qt) at a given energy was found by linear interpolation of the nearest experimental adsorption data. Although the nitrogen adsorption data were more precise and started at lower p/p0 values, for easier comparison
of the results the nitrogen adsorption energy distribution functions were calculated applying the same restrictions. Having f(Ei) values, average adsorption energies were calculated from Eq. (8). Dimensionless energies may be converted to adsorption energies. Since Ei RT = (Ea,i - Ec), one can easily calculate Ea,i(or Eav) values at temperature T of the measurements knowing that the condensation energy of water and nitrogen are equal to 40.7 and 5.61 kJ mol-1,
respectively, and R = 8.31 J mol-1 K-1.
More details on the above theoretical approach and the calculations are given in Józefaciuk and Szatanik-Kloc (2001) and Józefaciuk et al. (2013).
The results were subjected to statistical analysis using the program Statistica version 10.0. In order to test the hypothesis whether copper contributed statistically
signifi-cantly to the change in the surface area of the roots and
the average energy of adsorption, the analysis of variance (homogeneity of variance - the Fisher-Snedecor F-test) was used. If the values of the F test were higher than the values in the tables, it was assumed that the test variances were
not homogeneous and therefore copper affected statisti
-cally significantly the surface area and the average energy of adsorption. In order to determine the concentration of copper, which had a significant impact on the changes in the size of apparent/free surface area and average water vapour/nitrogen adsorption energy of roots, we used the post-hoc Test - RIR Tukey, which analyses the actual sig-nificant differences in the average.
) ( ) , ( ) , ( ) ( ) ( 1 ,
1 , i i
n i i m i m n
i mi
i i m E f E p a a a E p a a p a
p
∑
∑
RESULTS AND DISCUSSION
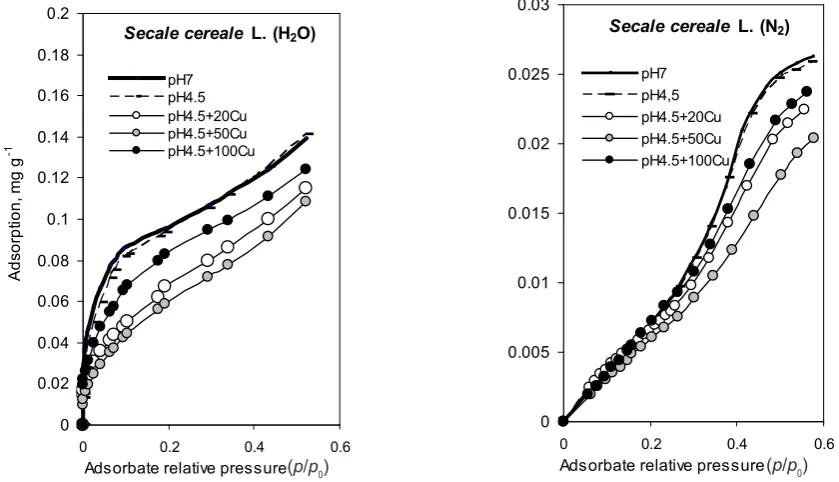
Adsorption-desorption isotherms (in terms of relative pressure of adsorbates p/p0 from 0 to 0.6) of water vapour and nitrogen for roots grown in the controlled conditions in the medium pH 7 and pH 4.5 with or without copper ions are shown in Fig. 1. The isotherms for the control pH 7 and for pH 4.5 (without Cu+2) samples were practically
identical for each root. This indicates that the influence of hydrogen ions (at pH 4.5) on the adsorption-desorption properties was insignificant. Protons alone did not alter the root physicochemical makeup. The rye roots treated with copper ions at concentrations of 20 and 50 mg dm-3 were
characterized by reduced adsorption-desorption of both ad-sorbates. For roots incubated in the solution with 100 mg
dm-3 Cu+2, the adsorption isotherms were similar to the
iso-therms of the control roots. The adsorption-desorption of nitrogen was significantly lower than the adsorption-desorption of water vapour. The free surface area calculated from nitrogen adsorption was much smaller than the appa-rent surface area. The specific surface area (free surface area) with determined nitrogen is more dependent on the root tissue anatomy including the size of the free inter-cellular spaces, the structure of the primary/secondary cell wall, and the possible damage and deformation of root tissues under stress. The adsorption of water vapour on roots is determined by the quantity and quality of polar adsorption centres, which are primarily carboxyl (mainly pectin), hydroxyl, and amino groups of root cell walls.
Conceptually, the specific surface area can be defined as the actual surface of the adsorbent that takes part in the ad-sorption per unit of mass.
The surface adsorbent should be viewed as a relative parameter of the surface adsorbent given the fine scale irregularities of the surface (Ościk, 1982). Therefore, the surface area may depend on the size of the adsorbate mole-cule. The sitting area of the water vapour molecule is 10.8 x10⁻²⁰ m2 and of nitrogen 16.2x10⁻²⁰ m2. Since the water
vapour molecules are smaller than the nitrogen molecules, they are adsorbed in a greater amount on the surface. Furthermore, the water vapour molecules adsorb on the polar centres, which are present in a great amount in the root. Therefore, the surface defined by the water vapour is always larger than the surface determined by nitro-gen. Regardless of the type of the adsorbate, the trend of the changes in the specific surface area of the roots grow-ing with copper was similar ie the smallest apparent and
free surface areas were noted in the root growing at the
concentrations of Cu+2 ions of 20 and 50 mg dm- 3 (Table 1).
However, there were no statistically significant (F test value) differences between the surfaces of the roots estimated using the method of adsorption-desorption of nitrogen. There were also no statistically significant differences between the apparent surface areas (estimated using the method of adsorption-desorption of water vapour) of the roots growing at pH 7 and pH 4.5 (without Cu+2). The lack of a statistically
significant effect of H+ ions on the physicochemical pro-perties of the roots of rye can be explained by the good
Secale cereale L. (H2O)
0 0.02 0.04 0.06 0.08 0.1 0.12 0.14 0.16 0.18 0.2
0 0.2 0.4 0.6 Adsorbate relative pressure (p/po)
A
ds
or
pt
ion,
m
g g
-1
pH7 pH4.5 pH4.5+20Cu pH4.5+50Cu pH4.5+100Cu
Secale cereale L. (N2)
0 0.005 0.01 0.015 0.02 0.025 0.03
0 0.2 0.4 0.6 Adsorbate relative pressure (p/p0)
pH7 pH4,5 pH4.5+20Cu pH4.5+50Cu pH4.5+100Cu
Fig. 1.Water vapour and nitrogen adsorption isotherms for Secale cereale L. roots growing in a nutrient solution prepared according to Hoagland with different contents of Cu+2. The number before the symbol of the element is the amount in mg dm-3 of copper added
to the nutrient solution.
tolerance of this cereal species to an acidic substrate (pH 5 – optimum for growth). Furthermore, according to Arnon and Johnson (1942), H+ ions act adversely on the root system only at a very low substrate pH (pH <3). Therefore,
it is assumed that acidic soils, the so-called secondary acidifying factors (inter alia, increasing mobility of heavy metals), limit plant growth. The size of the apparent surface
area of roots of Secale cereale L. (cv. Rostockie) decreased in the whole range of the copper concentration used. Statistically significant differences (with respect to the apparent surface area of the control roots) were observed in the apparent surface area for roots incubated with Cu+2
ions in the 20 and 50 mg dm-3 solutions. The size of the
ap-parent surface area of roots grown in copper at 100 mg
dm-3 did not show any statistically significant differences
with respect to the apparent surface area. Therefore, it
seems plausible that the 100 mg dm-3 copper concentration
in the nutrient solution for the studied Secale cereale L.
(cv. Rostockie) may be close to the sub lethal concentration. One of the parameters assessing metal toxicity is limitation of the root elongation growth and production of the biomass of roots and aboveground parts (Mantovi et al., 2003). For the tested Secale cereale L (cv. Rostockie), it was observed that the biomass of roots and aboveground parts between the control plants and plants treated with Cu-stress decreased proportionally to the increase in the copper concentration in the medium. The dry weight of the roots that grew in the conditions of the experiment, ie control > pH 4.5 > 20 Cu > 50 Cu > 100 Cu amounted to: in mg/plant (av. of 10 plants in 3 replications) 0.028 > 0.027> 0.017 > 0.013 > 0.01 and the aboveground parts 0.191 > 0.192 > 0.135 >0.125 > 0.048 (Szatanik-Kloc, 2010).
The general appearance of the plants growing under the optimal conditions (control), at pH 4.5 and Cu-stress is presented in Fig. 2. The negative impact of Cu-stress was visible in the aboveground parts. The aboveground parts of the plants were initially dark green and later they lost tur-gor and dried up. These reactions were observed mainly in plants growing at a copper concentration of 100 mg dm-3.
Similar signs of toxicity (but to a lesser extent) were observed in the aboveground parts of plants growing at a copper concentration of 50 mg dm-3. The aboveground
parts of the plants growing at a copper concentration of 20 mg dm-3 only faded. Copper is an ion that is retained
in the roots of plants. Only at the extremely high concentrations, it moves to the top parts resulting in the above-described symptoms (which has also been reported in the numerous papers Kabata-Pendias and Pendias, 1999; Mantovi et al., 2003). According to Szatanik-Kloc (2010),
the copper content in the studied Secale cereale L. (cv.
Rostockie) plants was based on kg-1 dw; in the aerial parts:
control – 0.12; pH 4.5 – 0.11, 20Cu – 0.97; 50Cu – 1.04; 100Cu – 4.11, and in the roots: control – 0.27; pH4.5 – T a b l e 1. Apparent (water vapour) and free (nitrogen) surface
area (S) of Secale cereale L. roots (the S values are presented as averages of 3 replications ± standard deviation). The values indi-cated in bold differ significantly (p < 0.05) from the control values in the object. RIR Tukey test
Variance
S – H2O S – N2
m2 g-1
pH 7 385.6 ± 18.5 92.4 ± 2.2
pH 4.5 384.7 ± 11.1 90.5 ± 1.3
pH 4.5 + 20 Cu 340.5 ± 18.3 76.1 ± 15.4 pH 4.5 + 50 Cu 338.6 ± 27.6 69.9 ± 27.7 pH 4.5 + 100 Cu 374.6 ± 11.8 80.3 ± 27.8
*F0.05 (4 ; 12) 8.54
p = 0.003 p = 0.5690.77
*F – The value of the statistical test F for analysis of variance. F test analysis of the variance value for α = 0.05 and a total of 4 variants and 12 samples. The value of the F test greater than the value in the table (3.47) indicates a statistically significant impact of the analysed factor (copper) on the apparent surface area of the roots. Similarly, the lower value of the F test shows no statistically significant effect of copper on the free surface area. RIR Tukey test analysing the actual differences in the means showed that the 20 and 50 mg dm-3 Cu+2 concentrations had a sig-
nificant influence on the size of the specific surface area. The statistically significant differences however concerned only the apparent surface area.
Control (pH 7) pH 4.5
pH4.5 + 20Cu+2 pH4.5 + 50Cu+2 pH4.5 + 100Cu+2
0.25, -1.66 20Cu; 50CU -3.79; 100Cu -4.81. The roots of plants that grew in the Cu-stress had a brown colour of diverse intensity.
The summary length of roots analysed under copper
stress (av. of 9 plants) decreased only in the case of plants that grew at a copper concentration of 100 mg
dm-3 and amounted to control – 207.8 cm, stress 100Cu
– 173.7 cm. In the other experimental variants, ie pH
4, 5, pH 4.5 + 20Cu, and pH 4.5 + 50Cu, the total root length was similar to the control variant (Szatanik-Kloc, 2010). In the shooting phase, in which the stress was applied, the root system of rye grows more slowly than the aboveground parts. It is therefore possible that at this stage of plant development the stress did not lead to statistically significant differences in biomass between the control and the stressed roots. However, the changes and the general appearance of biomass of the aboveground parts of the plants proved cessation of the physiological activity, which was particularly evident in the plants growing at the highest (Cu 100 mg dm-3) concentrations of copper.
According to Sheldon and Menzies (2005), copper toxicity can lead to severe deformation of the root structure. Such deformation was observed in other (clover, lupine)
plants under the influence of copper toxicity. It resulted
in an increase in the apparent and free surface area
(Szatanik-Kloc, 2010). In the roots of Secale cereale L. (cv. Rostockie), no such reactions were observed, even
at the highest concentration of copper, ie 100 mg dm-3.
Such high intensity of the stressor (Cu 100 mg dm-3) leads
to rapid destabilization of the plant organism, before the defence mechanisms (Sheldon and Menzies, 2005; Starck, 2007) are activated. At lower concentrations of copper (20 and 50 mg dm-3), the plants are still able to activate
the mechanisms of tolerance. The activation of potential mechanisms of tolerance to copper may affect the observed changes: a decrease in the size of the surface area and the adsorption energy characteristics.
The energetic character of the surface of the analysed
roots was interpreted as a function of the distribution and the average energy of adsorption of water vapour/nitrogen.
The energy of adsorption is due to the interaction energy
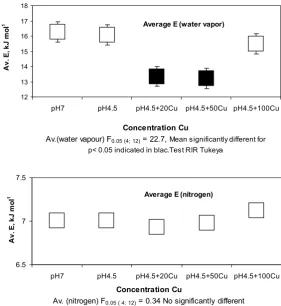
of the surface roots and the adsorbate (molecules of water vapour or nitrogen). The average adsorption energies characterize the general nature of the root surface energy and its changes under stress. Figure 3 shows the average energy of adsorption for the analyzed roots, which is
Average E (water vapor)
12 13 14 15 16 17 18
pH7 pH4.5 pH4.5+20Cu pH4.5+50Cu pH4.5+100Cu
Concentration Cu
Av.(water vapour) F0.05 (4; 12) = 22.7, Mean significantly different for
p< 0.05 indicated in blac.Test RIR Tukeya
A
v.
E
, kJ m
ol
-1
Average E (nitrogen)
6.5 7 7.5
pH7 pH4.5 pH4.5+20Cu pH4.5+50Cu pH4.5+100Cu
Concentration Cu
Av. (nitrogen) F0.05 ( 4: 12) = 0.34 No significantly different
A
v.
E
, kJ m
ol
-1
Fig. 3. Average adsorption energy (water vapour and nitrogen) for Secale cereale L. roots growing in a nutrient solution with different contents of Cu+2 (av. of 3 replicates). The value of the F test greater than the value in the table (3.47) indicates a statistically significant
calculated from the adsorption isotherms of water vapour (A) and nitrogen adsorption isotherms (B). In the Secale roots, the average energy of adsorption under the influence of Cu-stress decreased. A statistically significant decrease in the average energy of adsorption of water vapour was observed on the apparent surface area of the roots that grew at the copper concentrations of 20 and 50 mg dm-3.
At the copper concentration of 100 mg dm-3, the change
in the average energy of adsorption of water vapour was not statistically significant. There were also no statistically significant differences in the average energy of adsorption of nitrogen (Fig. 3B).
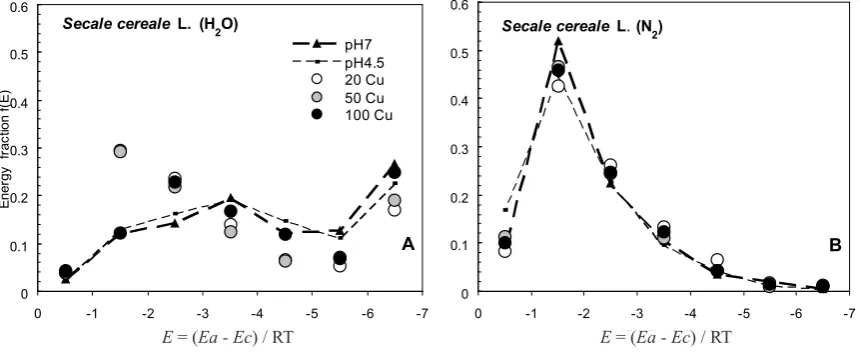
Adsorption energy distribution functions for the studied surfaces of the root are presented in Fig. 4 (A - water va-pour adsorption energy distribution function and B – nitro-gen adsorption energy distribution function). The dashed lines link points that characterize the different fractions of energy (the amount of energy centres of given energy Ei, Ei+1 another fraction, total of 7 fractions with different amounts of energy centres) analysed in the control roots
and pH4.5. Other points characterize the same fractions of energy but for roots under stress (Fig. 4A and B). For
the roots of Secale cereale L. growing in Cu-stress, the energy distribution function of water vapour adsorption (more dependent on the chemical nature of the root surface) showed a slight decrease in the quantity of adsorption centres (energy sites) of high energy (E = (Ea - Ec) / RT in the range from -5 to -7) and a decrease in the quantity of adsorption centres of medium energy (E = (Ea-Ec) / RT in the range of -3.5 to -4.5). For these roots, the increase in the number of sites (fractions of energy centres) with low energy of water vapour adsorption (adsorption energy distribution function E = (Ea-Ec) / RT between -0.5 to -2.5
(Fig. 4A) was observed. There were no differences in the size of individual energy fractions (with different centres of nitrogen adsorption energy) between the control roots and those treated with copper (Fig. 4B).
The main mechanical and chemical barrier to the pene-tration of heavy metals in the symplast is the cell wall. Immobilization of metals in the cell wall has been
demon-strated in the case of Zn+2, Pb+2 and Cu+2 ions (Hall, 2002;
Manara, 2012). The carboxyl groups (pectin and hemi-celluloses) are involved in the binding process of heavy metals in the cell wall. In optimal conditions of plant growth and development, these groups act inter alia as cationic exchangers. These are also the main groups of the surface that characterize polar adsorption sites. These groups characterize the sites (adsorption centres) with high energy of water vapour binding. Binding of copper ions with carboxyl groups of pectin may therefore reduce adsorption of molecules of water vapour. It may cause a reduction in
the apparent surface area, the amount of adsorption centres
of high-energy (high-energy fraction of adsorption centres), and the average adsorption energy of water vapour. Bernal et al. (2006) observed dark deposits attached to the outer surface of the cell wall containing a high level of copper in plants grown under metal stress conditions. Similarly, Yruela (2009) argues that copper ions can also be bound to cell walls and to the outer membrane surface of plant root cells. Apart from the carboxyl groups of pectin, metals are also bound by hystidyl groups and extracellular carbo-hydrates such as callose and mucilage (Hall, 2002). Moreover, one of the mechanisms of tolerance to copper (apart from binding of metal ions onto the cell wall) is the increased secretion of organic, citric and/or malic acid (Bernal et al., 2006; Murphy et al., 1999). The presence
Secale cereale L. (H2O)
A
0 0.1 0.2 0.3 0.4 0.5 0.6
-7 -6 -5 -4 -3 -2 -1 0
E=(Ea-Ec)/RT
Ener
gy
f
rac
tion f
(E
)
pH7 pH4.5 20 Cu 50 Cu 100 Cu
Secale cereale L. (N2)
B
0 0.1 0.2 0.3 0.4 0.5 0.6
-7 -6 -5 -4 -3 -2 -1 0
E=(Ea-Ec)/RT
pH7 pH4.5 20 Cu 50 Cu 100 Cu
Fig. 4. Adsorption energy distribution functions for Secale cereale L. roots growing in a nutrient solution with different contents of Cu+2
(points in the figure represent the individual fraction of energy and are the mean values of 3 replicates).
of these acids in the apoplast may cause an increase in
low-energy adsorption centres, which was observed in the experiment. This probably contributed to the reduction of the size of the apparent surface area and the average energy of adsorption of water vapour. These parameters determined from adsorption-desorption of the non-polar adsorbate – nitrogen and therefore dependent mainly on the structure of the outer root tissues (epidermis, cortex) were insignificant. The presence of lower metal concentrations induced structural changes in the analysed roots: cell wall deformation, cracks, and an increase in the distance between cells (sagging tissue), which has been observed in other plant species (Józefaciuk and Szatanik-Kloc, 2003, Szatanik-Kloc, 2010). For the tested Secale cereale L. root, the tissue structure changes were insignificant. According to the Manara (2012)
in the case of the Secale cereale L. (cv. Rostockie), the changes in the physicochemical properties (under stress) were rather associated with the change in the chemical nature of the surface due to the changes in biochemical reactions. It was found in the papers of other authors that the toxic concentration of metal ions is associated among other things with the increased synthesis of copper ligands - phosphates, maleates, phytochelatins, and metallothioneins. Lipid peroxidation and changes in the plasmalemma (rearrangement of proteins) as well as increased H2O2
levels were also observed. These probably contributed to reduction of the apparent surface area and the average energy of water vapour adsorption. Changes of the same parameters determined from adsorption-desorption of non-polar adsorbate (nitrogen) were small and not statistically significant. Since they depend mostly on the structure of the outer root tissue (epidermis and cortex), this can indicate that it remains not markedly altered.
CONCLUSIONS
1. It has been noticed that the roots grown at the doses (20, 50 and 100 mg dm-3) of copper used in the
experi-ment were characterized by a lower apparent surface area and a lower average energy of water vapour adsorption as compared to the roots of the control objects. Furthermore, a decrease in the high-energy adsorption sites (centres) and an increase in the low-energy adsorption sites were observed in the analyzed roots.
2. Statistically significant changes in the physicochemi-cal properties (apparent surface area and average energy of adsorption) were recorded for Secale cereale L. roots that grew in the copper concentrations of 20 and 50 mg dm3 of
the medium, given the fact that the properties were deter-mined by the polar adsorbate – water vapour.
3. The trend in the changes of the physicochemical properties (surface area, average energy of adsorption) determined by the polar (water vapour) and the non-polar (nitrogen) adsorbate under the stress was similar. However,
the changes in the physicochemical properties of the roots
determined by nitrogen were not statistically significant.
REFERENCES
Ansari S.A., Pramond Kumar, and Gupta B.N., 1995. Root surface area measurements based on ad-sorption and des-orption of nitrite. Plant Soil, 171, 33-137.
Aranovich G.L., 1992. The theory of polymolecular adsorption. Longmuir, 3, 736-739.
Arnon D.I. and Johnson C.M., 1942. Influence of hydrogen ion concentration on the growth of higher plants under con-trolled conditions. Plant Physiol., 17(4), 525-539.
Bernal M., Sánchez-Testillano P., Risueño M.C., and Yruela I., 2006. Excess copper induces structural changes in cul-tured photosynthetic soybean cells. Functional Plant Biol., 33, 1001-1012.
Buchanan B.B., Gruissem W., and Jones R.L., 2000. Bio- chemistry. Molecular Biology of Plants. American Society of Plant Physiologists, Rockville, ML, USA.
Chiou C.T., Lee J.F., and Boyd S.A., 1990. The surface area of organic matter. Environ. Sci. Technol., 24, 1164-1166. Jaroniec M. and Brauer P., 1986. Recent progress in
determina-tion of energetic heterogeneity of solids from adsorpdetermina-tion data. Surface Science Reports, 6(2), 65-117.
Jaroniec M., Rudzinski W., Sokołowski S., and Smarzewski R., 1976. Determination of energy distribution function from observed adsorption isotherms. J. Colloid Polymer Sci., 253(2), 164-166.
Józefaciuk G. and Szatanik-Kloc A., 2001. Aluminium – indu- ced changes in the surface and micro-pore properties of wheat roots: a study using the water vapor adsorption – de- sorption technique. Plant Soil, 233, 95-108.
Józefaciuk G. and Szatanik-Kloc A., 2003. Changes in specific area and energy of root surface of cereal plants in Al-solution cultures. Water vapor adsorption studies. Plant Soil, 250, 129-140.
Józefaciuk G., Łukowska M., and Szerement J., 2013. Determi- nation of energetic and geometric properties of plant roots specific surface from adsorption/desorption isotherm. Am. J. Plant Sci., 4, 1554-1561.
Hall J.L., 2002. Cellular mechanisms for heavy metal detoxifica-tion and tolerance. J. Exp. Bot., 53(366), 1-11.
Kabata-Pendias A. and Pendias H., 1999. Trace elements in soil and plants. CRC Press, Boca Raton, FL, USA.
Kopittke P.M. and Menzies N.W., 2006. Effect of Cu toxicity on growth of cowpea (Vigna unguiculata). Plant Soil, 279, 287-296.
Kowalczyk P., Tanaka H., Kanoh H., and Kaneko K., 2004. Adsorption energy distribution function from the Aranovich- Donohue lattice density functional theory. Langmuir, 20(6), 2324-2332.
Manara A., 2012. Plant responses to heavy metal toxicity. In: Plants and Heavy Met-als, Springer Briefs in Bio metals (Ed. A. Furini). DOI: 10.1007/978-94-007-4441-7_2, Manivasagaperumal R., Vijayarengal P., Balamurugan S., and
Thiyagarajan G., 2011. Effect of cop-per on growth, dry mat- ter yield and nutrient content of Vigna radiata (L). J. Phyto- logy, 3(3), 53-62.
Mantovi P. Bonazzi G., Maestri E., and Marmiroli N., 2003. Accumulation of copper and zinc from liq-uid manure in agricultural soils and crop plants. Plant Soil, 250, 249-257. Michaud A.M., Chappellaz C., and Hinsinger P., 2008. Copper
Murphy A.S., Eisenger W.R., Shaff J.E., Kochian L.V., and Taiz L., 1999. Early copper-induced leakage of K+ from Arabidopsis seedlings is mediated by ion channels and cou-pled to citrate efflux. Plant Physiol., 121, 1375-1382. Ościk J., 1982. Adsorption. Harwood Press, Chichester, UK. Sedbrook J.C., Carroll K.L., Hung K.F., Masson P.H., and
Somerville C.R., 2002. The arabidopsis SKU5 gene encodes an extra cellular glycosyl phosphatidylinositol-anchored glycoprotein involved in directional root growth plant cell. Plant Cell, 14, 1635-1648.
Sheldon A.R. and Menzies N.W., 2005. The effect of copper to- xicity on the growth and root morphology of Rhodes grass (Chloris gayana Knuth.) in resin buffered solution culture. Plant Soil, 278, 341-349.
Starck Z., 2007. Mineral Nutrition of Plants. In: Plants Physiology (in Polish). (Eds J. Kopcewicz, S. Lewak). Scientific Publi- shers PAN SA, Warsaw, Poland.
Sukreeyapongse O., Holm P.E., Strobel B.W., Panichsakpatana S., Magid J., and Hansen H.C.B., 2002. pH dependent release of cadmium, copper, and lead from natural and sludge-amended soils. J. Environ. Qual., 31, 1901-1909.
Szatanik-Kloc A., 2010. Changes in surface properties of plant roots determined by aluminium and copper phytotoxicity (in Polish). Acta Agrophysica, 176, 1-121.
Szatanik-Kloc A., 2012. Effect of the pH and Zn-stress on micropore system of rye roots (Secale cereale L.) Int. Agrophys., 26, 311-316.
Tye A.M., Young S., Crout N.M.J., Zhang H., Preston S., Zhao F.J., and McGrath S.P., 2004. Speciation and solubility of Cu, Ni and Pb in contaminated soils. Eur. J. Soil Sci., 55, 579-590.