VOLUME NO. 2 (2012), ISSUE NO. 8 (AUGUST) ISSN 2231-5756
A Monthly Double-Blind Peer Reviewed Refereed Open Access International e-Journal - Included in the International Serial Directories
Indexed & Listed at:
VOLUME NO. 2 (2012), ISSUE NO. 8 (AUGUST) ISSN 2231-5756
CONTENTS
CONTENTS
CONTENTS
CONTENTS
Sr.No.
TITLE & NAME OF THE AUTHOR (S)
Page No.
1. ANALYSIS OF IPOS UNDERPRICING: EVIDENCE FROM BOMBAY STOCK EXCHANGE
ROHIT BANSAL & DR. ASHU KHANNA
1 2. BANKRUPTCY PREDICTION OF FIRMS USING THE DATA MINING METHOD
ATIYE ASLANI KTULI & MANSOUR GARKAZ
8 3. THE EFFECT OF BASEL III REQUIREMENTS ON IMPROVING RISK-MANAGEMENT CAPABILITIES IN JORDANIAN BANKS
DR. MOHAMMED FAWZI ABU EL HAIJA
12 4. CAPITAL STRUCTURE DETERMINANTS: CRITICAL REVIEW FOR SELECTED INDIAN COMPANIES
DR. AVANISH KUMAR SHUKLA
18 5. IMPACT OF INFLATION ON BANK LENDING RATE IN BANGLADESH
EMON KALYAN CHOWDHURY
23 6. THE PERCEPTION OF BANK EMPLOYEES TOWARDS COST OF ADOPTION, RISK OF INNOVATION, AND STAFF TRAINING’S INFLUENCE ON THE
ADOPTION OF INFORMATION AND COMMUNICATION TECHNOLOGY (ICT) IN THE RWANDAN COMMERCIAL BANKS
MACHOGU MORONGE ABIUD & LYNET OKIKO
27
7. ICT, ELECTION AND DEVELOPMENT IN AFRICA
NDUONOFIT, LARRY-LOVE EFFIONG & ONWUKWE, VIVIAN CHIZOMA
32 8. MODERATING ROLE OF EMOTIONAL INTELLIGENCE TOWARDS STRESS AND EMPLOYEE PERFORMANCE IN THE INDIAN BANKING SECTOR
BEULAH VIJI CHRISTIANA.M & DR. V. MAHALAKSHMI
35 9. FACTORS INFLUENCING CUSTOMER LOYALTY IN MOBILE PHONE SERVICE - A STUDY WITH REFERENCE TO COIMBATORE CITY
DR. V.T.R .VIJAYAKUMAR & B.SUBHA
39 10. A STUDY ON OCCUPATIONAL STRESS AMONG GRADE I POLICE CONSTABLES
M.SHUNMUGA SUNDARAM & DR. M. JAYA KUMARAN
44 11. A STUDY ON THE IMPACT OF SPIRITUALITY ON ORGANISATIONAL PERFORMANCE WITH SPECIAL REFERENCE TO ORGANIISATIONS IN
SALEM CITY
DR. M. G.SARAVANA RAJ & R. FLORENCE BHARATHI
49
12. A COMPARATIVE STUDY OF SELF- EFFICACY AND SUBJECTIVE WELL- BEING AMONG EMPLOYED WOMEN AND UNEMPLOYED WOMEN
DR. K. JAYASHANKAR REDDY
54 13. NETWORK SECURITY THREATS AND SOLUTIONS IN A VIRTUAL MARKETPLACE
DR. PANKAJ KUMAR GUPTA & DR. AJAY KUMAR TIWARI
58 14. A STUDY OF SUPPLIERS CERTIFICATION AT DIFFERENT LAYERS AND ITS IMPACT ON QUALITY IN AUTO COMPONENT INDUSTRY
DR.DATTATRY RAMCHANDRA MANE
61 15. GLOBAL LIFE INSURANCE PENETRATION AND DENSITY
DR. GUDALA SYAMALA RAO
69 16. AN ENHANCE SECURITY OF PLAYFAIR CIPHER SUBSTITUTION USING A SIMPLE COLUMNAR TRANSPOSITION TECHNIQUE WITH MULTIPLE
ROUNDS (SCTTMR)
GAURAV SHRIVASTAVA, MANOJ DHAWAN & MANOJ CHOUHAN
75
17. CONSUMERS PERCEPTIONS OF CORPORATE SOCIAL RESPONSIBILITY: EMPIRICAL EVIDENCE
AMIT B. PATEL, DR. VIMAL K. BHATT & JATIN K. MODI
79 18. A STUDY ON FINANCIAL HEALTH OF KINGFISHER AIRLINES LTD: (Z- SCORE APPROACH)
JIGNESH. B. TOGADIYA & UTKARSH. H. TRIVEDI
84 19. STRATEGIES OF CUSTOMER RELATION MANAGEMENT IN MODERN MARKETING
DR. T. PALANISAMY & K. AMUTHA
88 20. CORPORATE GOVERNANCE IN OIL & GAS SECTOR: AN EMPIRICAL INVESTIGATION
RASHESH PATEL & SWATI PATEL
92 21. KNOWLEDGE MANAGEMENT & MOBILIZING KNOWLEDGE IN EDUCATION BY FOLLOWING CASE STUDY OF YU;GI-OH WORLD
SMITA.S.JAPE
101 22. STUDY OF CRM THROUGH SOCIAL NETWORKING SITE: A FACEBOOK PERSPECTIVE
TEENA BAGGA & APARAJITA BANERJEE
107 23. ORDINARY LEAST SQUARES METHOD AND ITS VARIANTS
R. SINGH
114 24. I T INFRASTRUCTURE IN CREATING POTENTIAL MARKETING OPPORTUNITIES IN INDUSTRIES: AN EMPIRICAL STUDY OF SELECT INDUSTRIES
IN KARNATAKA
MANJUNATH K R & RAJENDRA M
120
25. THE IMPACT OF KNOWLEDGE MANAGEMENT ON BUSINESS ORGANIZATION
SUNITA S. PADMANNAVAR & SMITA B. HANJE
126 26. LOCUS OF CONTROL AMONG HIGH SCHOOL TEACHERS
DEEPA MARINA RASQUINHA
129 27. KNOWLEDGE MANAGEMENT: A CONCEPTUAL UNDERSTANDING
AINARY ARUN KUMAR
135 28. A STUDY ON EFFECTIVENESS OF ORGANIZATIONAL HEALTH IN SMALL SCALE INDUSTRIES
DR. J. S. V. GOPALA SARMA
142 29. JOB SATISFACTION DURING RECESSION PERIOD: A CASE STUDY OF PUBLIC & PRIVATE INSURANCE IN PUNJAB
HARDEEP KAUR
149 30. BANKING SECTOR REFORMS IN INDIA
DR. SANDEEP KAUR
156
VOLUME NO. 2 (2012), ISSUE NO. 8 (AUGUST) ISSN 2231-5756
CHIEF PATRON
CHIEF PATRON
CHIEF PATRON
CHIEF PATRON
PROF. K. K. AGGARWAL
Chancellor, Lingaya’s University, Delhi
Founder Vice-Chancellor, Guru Gobind Singh Indraprastha University, Delhi
Ex. Pro Vice-Chancellor, Guru Jambheshwar University, Hisar
PATRON
PATRON
PATRON
PATRON
SH. RAM BHAJAN AGGARWAL
Ex. State Minister for Home & Tourism, Government of Haryana
Vice-President, Dadri Education Society, Charkhi Dadri
President, Chinar Syntex Ltd. (Textile Mills), Bhiwani
CO
CO
CO
CO----ORDINATOR
ORDINATOR
ORDINATOR
ORDINATOR
AMITA
Faculty, Government M. S., Mohali
ADVISORS
ADVISORS
ADVISORS
ADVISORS
DR. PRIYA RANJAN TRIVEDI
Chancellor, The Global Open University, Nagaland
PROF. M. S. SENAM RAJU
Director A. C. D., School of Management Studies, I.G.N.O.U., New Delhi
PROF. M. N. SHARMA
Chairman, M.B.A., Haryana College of Technology & Management, Kaithal
PROF. S. L. MAHANDRU
Principal (Retd.), Maharaja Agrasen College, Jagadhri
EDITOR
EDITOR
EDITOR
EDITOR
PROF. R. K. SHARMA
Professor, Bharti Vidyapeeth University Institute of Management & Research, New Delhi
CO
CO
CO
CO----EDITOR
EDITOR
EDITOR
EDITOR
DR. BHAVET
Faculty, M. M. Institute of Management, Maharishi Markandeshwar University, Mullana, Ambala, Haryana
EDITORIAL ADVISORY BOARD
EDITORIAL ADVISORY BOARD
EDITORIAL ADVISORY BOARD
EDITORIAL ADVISORY BOARD
DR. RAJESH MODI
Faculty, Yanbu Industrial College, Kingdom of Saudi Arabia
PROF. SANJIV MITTAL
University School of Management Studies, Guru Gobind Singh I. P. University, Delhi
PROF. ANIL K. SAINI
Chairperson (CRC), Guru Gobind Singh I. P. University, Delhi
DR. SAMBHAVNA
Faculty, I.I.T.M., Delhi
DR. MOHENDER KUMAR GUPTA
VOLUME NO. 2 (2012), ISSUE NO. 8 (AUGUST) ISSN 2231-5756
DR. SHIVAKUMAR DEENE
Asst. Professor, Dept. of Commerce, School of Business Studies, Central University of Karnataka, Gulbarga
MOHITA
Faculty, Yamuna Institute of Engineering & Technology, Village Gadholi, P. O. Gadhola, Yamunanagar
ASSOCIATE EDITORS
ASSOCIATE EDITORS
ASSOCIATE EDITORS
ASSOCIATE EDITORS
PROF. NAWAB ALI KHAN
Department of Commerce, Aligarh Muslim University, Aligarh, U.P.
PROF. ABHAY BANSAL
Head, Department of Information Technology, Amity School of Engineering & Technology, Amity University, Noida
PROF. A. SURYANARAYANA
Department of Business Management, Osmania University, Hyderabad
DR. SAMBHAV GARG
Faculty, M. M. Institute of Management, Maharishi Markandeshwar University, Mullana, Ambala, Haryana
PROF. V. SELVAM
SSL, VIT University, Vellore
DR. PARDEEP AHLAWAT
Associate Professor, Institute of Management Studies & Research, Maharshi Dayanand University, Rohtak
DR. S. TABASSUM SULTANA
Associate Professor, Department of Business Management, Matrusri Institute of P.G. Studies, Hyderabad
SURJEET SINGH
Asst. Professor, Department of Computer Science, G. M. N. (P.G.) College, Ambala Cantt.
TECHNICAL ADVISOR
TECHNICAL ADVISOR
TECHNICAL ADVISOR
TECHNICAL ADVISOR
AMITA
Faculty, Government H. S., Mohali
MOHITA
Faculty, Yamuna Institute of Engineering & Technology, Village Gadholi, P. O. Gadhola, Yamunanagar
FINANCIAL ADVISORS
FINANCIAL ADVISORS
FINANCIAL ADVISORS
FINANCIAL ADVISORS
DICKIN GOYAL
Advocate & Tax Adviser, Panchkula
NEENA
Investment Consultant, Chambaghat, Solan, Himachal Pradesh
LEGAL ADVISORS
LEGAL ADVISORS
LEGAL ADVISORS
LEGAL ADVISORS
JITENDER S. CHAHAL
Advocate, Punjab & Haryana High Court, Chandigarh U.T.
CHANDER BHUSHAN SHARMA
Advocate & Consultant, District Courts, Yamunanagar at Jagadhri
SUPERINTENDENT
SUPERINTENDENT
SUPERINTENDENT
SUPERINTENDENT
SURENDER KUMAR POONIA
VOLUME NO. 2 (2012), ISSUE NO. 8 (AUGUST) ISSN 2231-5756
CALL FOR MANUSCRIPTS
CALL FOR MANUSCRIPTS
CALL FOR MANUSCRIPTS
CALL FOR MANUSCRIPTS
Weinvite unpublished novel, original, empirical and high quality research work pertaining to recent developments & practices in the area of Computer, Business, Finance, Marketing, Human Resource Management, General Management, Banking, Insurance, Corporate Governance and emerging paradigms in allied subjects like Accounting Education; Accounting Information Systems; Accounting Theory & Practice; Auditing; Behavioral Accounting; Behavioral Economics; Corporate Finance; Cost Accounting; Econometrics; Economic Development; Economic History; Financial Institutions & Markets; Financial Services; Fiscal Policy; Government & Non Profit Accounting; Industrial Organization; International Economics & Trade; International Finance; Macro Economics; Micro Economics; Monetary Policy; Portfolio & Security Analysis; Public Policy Economics; Real Estate; Regional Economics; Tax Accounting; Advertising & Promotion Management; Business Education; Management Information Systems (MIS); Business Law, Public Responsibility & Ethics; Communication; Direct Marketing; E-Commerce; Global Business; Health Care Administration; Labor Relations & Human Resource Management; Marketing Research; Marketing Theory & Applications; Non-Profit Organizations; Office Administration/Management; Operations Research/Statistics; Organizational Behavior & Theory; Organizational Development; Production/Operations; Public Administration; Purchasing/Materials Management; Retailing; Sales/Selling; Services; Small Business Entrepreneurship; Strategic Management Policy; Technology/Innovation; Tourism, Hospitality & Leisure; Transportation/Physical Distribution; Algorithms; Artificial Intelligence; Compilers & Translation; Computer Aided Design (CAD); Computer Aided Manufacturing; Computer Graphics; Computer Organization & Architecture; Database Structures & Systems; Digital Logic; Discrete Structures; Internet; Management Information Systems; Modeling & Simulation; Multimedia; Neural Systems/Neural Networks; Numerical Analysis/Scientific Computing; Object Oriented Programming; Operating Systems; Programming Languages; Robotics; Symbolic & Formal Logic and Web Design. The above mentioned tracks are only indicative, and not exhaustive.
Anybody can submit the soft copy of his/her manuscript anytime in M.S. Word format after preparing the same as per our submission guidelines duly available on our website under the heading guidelines for submission, at the email address: [email protected].
GUIDELINES FOR SUBMISSION OF
GUIDELINES FOR SUBMISSION OF
GUIDELINES FOR SUBMISSION OF
GUIDELINES FOR SUBMISSION OF MANUSCRIPT
MANUSCRIPT
MANUSCRIPT
MANUSCRIPT
1. COVERING LETTER FOR SUBMISSION:
DATED: _____________
THE EDITOR
IJRCM
Subject: SUBMISSION OF MANUSCRIPT IN THE AREA OF .
(e.g. Finance/Marketing/HRM/General Management/Economics/Psychology/Law/Computer/IT/Engineering/Mathematics/other, please specify)
DEAR SIR/MADAM
Please find my submission of manuscript entitled ‘___________________________________________’ for possible publication in your journals.
I hereby affirm that the contents of this manuscript are original. Furthermore, it has neither been published elsewhere in any language fully or partly, nor is it under review for publication elsewhere.
I affirm that all the author (s) have seen and agreed to the submitted version of the manuscript and their inclusion of name (s) as co-author (s).
Also, if my/our manuscript is accepted, I/We agree to comply with the formalities as given on the website of the journal & you are free to publish our contribution in any of your journals.
NAME OF CORRESPONDING AUTHOR: Designation:
Affiliation with full address, contact numbers & Pin Code: Residential address with Pin Code:
Mobile Number (s): Landline Number (s): E-mail Address: Alternate E-mail Address:
NOTES:
a) The whole manuscript is required to be in ONE MS WORD FILE only (pdf. version is liable to be rejected without any consideration), which will start from the covering letter, inside the manuscript.
b) The sender is required to mention the following in the SUBJECT COLUMN of the mail:
New Manuscript for Review in the area of (Finance/Marketing/HRM/General Management/Economics/Psychology/Law/Computer/IT/ Engineering/Mathematics/other, please specify)
c) There is no need to give any text in the body of mail, except the cases where the author wishes to give any specific message w.r.t. to the manuscript. d) The total size of the file containing the manuscript is required to be below 500 KB.
e) Abstract alone will not be considered for review, and the author is required to submit the complete manuscript in the first instance.
f) The journal gives acknowledgement w.r.t. the receipt of every email and in case of non-receipt of acknowledgment from the journal, w.r.t. the submission of manuscript, within two days of submission, the corresponding author is required to demand for the same by sending separate mail to the journal.
2. MANUSCRIPT TITLE: The title of the paper should be in a 12 point Calibri Font. It should be bold typed, centered and fully capitalised.
3. AUTHOR NAME (S) & AFFILIATIONS: The author (s) full name, designation, affiliation (s), address, mobile/landline numbers, and email/alternate email address should be in italic & 11-point Calibri Font. It must be centered underneath the title.
VOLUME NO. 2 (2012), ISSUE NO. 8 (AUGUST) ISSN 2231-5756
5. KEYWORDS: Abstract must be followed by a list of keywords, subject to the maximum of five. These should be arranged in alphabetic order separated by commas and full stops at the end.
6. MANUSCRIPT: Manuscript must be in BRITISH ENGLISH prepared on a standard A4 size PORTRAIT SETTING PAPER. It must be prepared on a single space and single column with 1” margin set for top, bottom, left and right. It should be typed in 8 point Calibri Font with page numbers at the bottom and centre of every page. It should be free from grammatical, spelling and punctuation errors and must be thoroughly edited.
7. HEADINGS: All the headings should be in a 10 point Calibri Font. These must be bold-faced, aligned left and fully capitalised. Leave a blank line before each heading.
8. SUB-HEADINGS: All the sub-headings should be in a 8 point Calibri Font. These must be bold-faced, aligned left and fully capitalised.
9. MAIN TEXT: The main text should follow the following sequence:
INTRODUCTION
REVIEW OF LITERATURE
NEED/IMPORTANCE OF THE STUDY
STATEMENT OF THE PROBLEM
OBJECTIVES
HYPOTHESES
RESEARCH METHODOLOGY
RESULTS & DISCUSSION
FINDINGS
RECOMMENDATIONS/SUGGESTIONS
CONCLUSIONS
SCOPE FOR FURTHER RESEARCH
ACKNOWLEDGMENTS
REFERENCES
APPENDIX/ANNEXURE
It should be in a 8 point Calibri Font, single spaced and justified. The manuscript should preferably not exceed 5000 WORDS.
10. FIGURES &TABLES: These should be simple, crystal clear, centered, separately numbered & self explained, and titles must be above the table/figure. Sources of data should be mentioned below the table/figure. It should be ensured that the tables/figures are referred to from the main text.
11. EQUATIONS: These should be consecutively numbered in parentheses, horizontally centered with equation number placed at the right.
12. REFERENCES: The list of all references should be alphabetically arranged. The author (s) should mention only the actually utilised references in the preparation of manuscript and they are supposed to follow Harvard Style of Referencing. The author (s) are supposed to follow the references as per the following:
•
All works cited in the text (including sources for tables and figures) should be listed alphabetically.•
Use (ed.) for one editor, and (ed.s) for multiple editors.•
When listing two or more works by one author, use --- (20xx), such as after Kohl (1997), use --- (2001), etc, in chronologically ascending order.•
Indicate (opening and closing) page numbers for articles in journals and for chapters in books.•
The title of books and journals should be in italics. Double quotation marks are used for titles of journal articles, book chapters, dissertations, reports, working papers, unpublished material, etc.•
For titles in a language other than English, provide an English translation in parentheses.•
The location of endnotes within the text should be indicated by superscript numbers.PLEASE USE THE FOLLOWING FOR STYLE AND PUNCTUATION IN REFERENCES: BOOKS
•
Bowersox, Donald J., Closs, David J., (1996), "Logistical Management." Tata McGraw, Hill, New Delhi.•
Hunker, H.L. and A.J. Wright (1963), "Factors of Industrial Location in Ohio" Ohio State University, Nigeria. CONTRIBUTIONS TO BOOKS•
Sharma T., Kwatra, G. (2008) Effectiveness of Social Advertising: A Study of Selected Campaigns, Corporate Social Responsibility, Edited by David Crowther & Nicholas Capaldi, Ashgate Research Companion to Corporate Social Responsibility, Chapter 15, pp 287-303.JOURNAL AND OTHER ARTICLES
•
Schemenner, R.W., Huber, J.C. and Cook, R.L. (1987), "Geographic Differences and the Location of New Manufacturing Facilities," Journal of Urban Economics, Vol. 21, No. 1, pp. 83-104.CONFERENCE PAPERS
•
Garg, Sambhav (2011): "Business Ethics" Paper presented at the Annual International Conference for the All India Management Association, New Delhi, India, 19–22 June.UNPUBLISHED DISSERTATIONS AND THESES
•
Kumar S. (2011): "Customer Value: A Comparative Study of Rural and Urban Customers," Thesis, Kurukshetra University, Kurukshetra. ONLINE RESOURCESVOLUME NO. 2 (2012), ISSUE NO. 8 (AUGUST) ISSN 2231-5756
ANALYSIS OF IPOS UNDERPRICING: EVIDENCE FROM BOMBAY STOCK EXCHANGE
ROHIT BANSAL
RESEARCH SCHOLAR
INDIAN INSTITUTE OF TECHNOLOGY
ROORKEE
DR. ASHU KHANNA
ASST. PROFESSOR
INDIAN INSTITUTE OF TECHNOLOGY
ROORKEE
ABSTRACT
Underpricing of IPOs has been contemplated as a prevalent phenomenon across the world. When companies go public, the equity they sell in as initial public offering tends to be underpriced, resulting in a substantial price jump on the first-day trading. Nevertheless, underpricing an IPO results in “money left on the table”- lost capital that could have been projecting for the company had the stock been offered at a higher price. The main purpose of this paper is to investigate the difference in the firm-specific factors that significantly affect the underpricing of IPOs for the period of 2000-2011. Furthermore, it studies if there is any statistically significant difference in the pricing mechanism and underpricing. The research is established on an empirical study. The sample for the study consists of 320 IPOs. All the market & firm specific variables are regressed against the underpricing. Multiple regressions are used to find which variables statistically consequential in affecting underpricing. The factors embodied in the study are pricing mechanism (book built or fixed price option), subscription rate, and issue size. A two-way ANOVA is done to recognize if there is a statistically significant difference in the underpricing and pricing mechanisms. All the variables are regressed opposingly the underpricing. We found R square 37.6 % and adjusted R square 36%. However, Durbin-Watson imparted 1.633 value of this regression model. Subscription rate & issue size was found to be significant in affecting the underpricing. There is negative relationship amid issue size and level of underpricing, however, positive relationship in subscription rate and underpricing. Nevertheless, there is no significant difference between underpricing and pricing mechanism. The study provides useful insights into which market and firm specific variables are prominent in determining the extent of underpricing of IPOs. The study has more consequential implications for investors who subscribe to different IPOs for listing day gain as this study would benefit them in understanding which type of firms are more likely to underpriced.
KEYWORDS
IPO, Underpricing, Market related variables, pricing mechanism, Firm-specific factors.
1.0 INTRODUCTION
he decision to go public, or make an initial public offering (IPO) of equity, symbolizes an important landmark in a firm’s life cycle. There are several motives for a company to go public. First, the business can raise capital at a lower cost. The money raised can be use to finance investments for future growth of the company or acquiring additional business. Another reason for a company to go public is that selling shares on the stock market offers more liquidity to the existing shareholders. The shareholders of a private firm often have a large share of their wealth invested in the company. By turning to the stock market, the entrepreneur and existing shareholders have the opportunity to turn their investment into cash and diversify their investments. Third rationale is that an IPO brings the firm into the spotlight of other companies and increases the chance of potential mergers and acquisitions.
A well-functioning IPO market provides exit options for stakeholders in young firms, access to low cost capital for growing firms, and greater access to capital for future expansion of large firms. Flow of capital to firms can stimulate growth in an economy. Consequently, regulators are interested in mechanisms that facilitate better functioning IPO markets. India has a relatively mature capital market, with a long history of uninterrupted operations even across the World Wars.
In 1999, investment banks were allowed to use a version of book building as a mechanism for bringing IPOs to the Indian capital market. Book building refers to the process of generating, capturing, and recording investor demand for shares during an IPO in order to support efficient price discovery. The empirical evidence on the performance of private and government firms is also inconclusive. (Megginson W. N., 1994) Suggested that privatized firm perform better than their counterparts. On the other hands, (Kay, 1986) provided evidence which is supportive of government enterprise. Several papers discussed the vital role played by underpricing in achieving the desired ownership structure. Among these papers (LaPorta, 1999), has pointed out that for emerging market countries, ownership structure plays a very important role in corporate finance. (Kim, 2004), study the relations hip between managerial ownership and firm performance using Thai IPO firms. Signaling (Allen, 1989), asymmetric information (Ibbotson, 1975), Offer size (W.L. Megginson and K.A. Weiss, 1991) age of the firm (Muscarella, 1989), (W.L. Megginson and K.A. Weiss, 1991), (McDonald, 1972), Pricing mechanism at BSE (Bansal.R & Khanna, 2012)determinants of ipo underpricing at KSE (Sohail and Raheman, 2009).
1.1. PRICING MECHANISMS
There are two frequently used techniques to issue shares in an initial public offering; book building, fixed-price and auctions. In India and other countries, the book building technique is the most frequently used method to price shares.
1.1.1 BOOK-BUILDING
Book Building accusations price that the market can bear. Book building usually prompts to more aggressive pricing than traditional fixed price method. Under book building, since all applicants above the cut-off points are allotted shares, ideally, there should not be any pressure of unsatisfied demand in the market, leading to a lesser possibility of market prices rising above the issue price after listing. Thus, IPOs based on book building method may deliver fair pricing. 1.1.2 PRICE DISCOVERY THROUGH THE BOOK BUILDING PROCESS
“Book Building” means a process undertaken by which a demand for the securities tendered to be issued by a body corporate is elicited and built up, and the price for the securities is considered based on the bids obtained for the quantum of securities offered for subscription by the issuer. This method furnishes an opportunity to the market to discover price for securities.
1.1.3 COMPARISON OF PRICING MECHANISMS
Pricing is the main part of IPO process for both investors and issuing company or corporate house To. determine the right price of shares is most important. While deciding the IPOs, there are mainly two pricing methods that are IPO book building and fixed price option. The pricing processes are distinctive in these pricing mechanisms. So we must consider diverse things while calculating the price. And there is a variation in both pricing methods And. price update is depended on different market conditions.
VOLUME NO. 2 (2012), ISSUE NO. 8 (AUGUST) ISSN 2231-5756
2.0 WHAT IS UNDERPRICING?
Underpricing of IPOs has been considered as a prevalent phenomenon across the world. When companies go public, the equity they sell in as initial public offering tends to be underpriced, resulting in a substantial price jump on the first day trading. Underpricing is generating additional value in the stock when it first becomes traded. This leads to significant gains for investors who have been allocated shares at offer price. However, underpricing an IPO results in “money left on the table”- lost capital that could have been raised for the company had the stock been offered at a higher price. (Baron, 1982).
2.1 REASONS FOR UNDERPRICING
Allotment of shares in IPOs elevates an interesting question- what makes the investors rush towards IPOs? It seems that there is a significant difference in the prices at which the IPOs are offered to the investors and the price at which they trade on the day of the listing. So if the investors get shares allotted in an IPO at a lower price than sell them on the first day of listing at higher prices, then they can make substantial gains. This phenomenon is known a “under pricing” in the IPO market. In other words, the market (on the day of the listing) seems to conceive that the offer price of the stock was lower and justifies a higher price. The higher the underpricing, greater is the amount of money that can be made by investors who got allocations in the IPO and sell these on the day of listing. This phenomenon is also referred to as “money left on the table” by the firms.
Much of the theoretical research on IPOs has focused on explaining IPO underpricing. Possible reasons for underpricing include self-interested investment bankers (Baron, 1982), the “winner’s curse” (Rock, 1986), signaling (Allen, 1989) book building (Benveniste, 1989). Evidence suggests also that in some countries IPO underpricing may be due to the regulatory environment (Loughran T. &., 1994), because the allocation of IPO shares can be used as a bribe. Attempts were made to examine the reasons for the initial high returns of these new issues. Some theoretical work suggests that the underpricing of IPOs is associated with asymmetric information and investors' concerns that the decision to issue equity is an attempt to expropriate wealth from outsiders (Ibbotson, 1975).
Empirical studies have found evidence that the underpricing for IPOs of financial institutions is related to proxies for asymmetric information. Offer size
(Megginson, 1991), age of the firm(Muscarella, 1989); (Megginson, 1991);(McDonald, New issues stock price behaviour, 1972), and the volatility of the post-offer return (Ritter, 1984), have all been associated with IPO underpricing. Recently research work has been done on relationship of pricing mechanism and level of underpricing in Indian stock market by (Bansal, 2012).
This paper undertakes to investigate the extent of underpricing in the Indian primary market by taking a sample of IPOs for the period of eleven years from 2000 to 2011. In addition to, it also investigates what are the different market and firm specific factors that affect the underpricing of IPOs. These factors include subscription rate (Issue subscribe by Investors), issue size (Number of share offered * offer price), and pricing mechanism (book built & fixed price option).
Multiple regression exhibit that which among these variables is statistically significant to affecting underpricing.
The study furnishes useful insights into which market and firm specific variables are consequential in determining the extent of underpricing of IPOs. The study has more prominent implications for investors who subscribe to different IPOs for listing day gain as this study would help them in understanding which types of the firm are more likely to underprice. This model is also very useful to prediction in prognostication for upcoming public issue.
The rest of the paper is organized as follows. Section 3 describes the literature review which is followed by data and methodology in section 4 & 5. Section 6 shows results and discussion followed by conclusion in section 7.
3.0 LITERATURE REVIEW
One of the earliest and seminal works in the field was done by (Ibbotson R. , 1975).He studied both initial and aftermarket performance (measured by risk-adjusted returns) on newly issued common stocks which were offered to the public during the 1970s. The empirical evidence on the performance of private and government firms is also inconclusive. (Megginson W. N., 1994) Suggested that privatized firm perform better than their counterparts. On the other hands, (Kay, 1986) provided evidence which is supportive of government enterprise. Several papers discussed the vital role played by underpricing in achieving the desired ownership structure. Among these papers (LaPorta, 1999), has pointed out that for emerging market countries, ownership structure plays a very important role in corporate finance. (Kim, 2004), study the relations hip between managerial ownership and firm performance using Thai IPO firms. Signaling (Allen, 1989), asymmetric information (Ibbotson, 1975), Offer size (W.L. Megginson and K.A. Weiss, 1991) age of the firm (Muscarella, 1989), (W.L. Megginson and K.A. Weiss, 1991), (McDonald, 1972), Pricing mechanism at BSE (Bansal.R & Khanna, 2012)determinants of ipo underpricing at KSE (Sohail and Raheman, 2009). Recently (Islam A. a., 2010) conducted empirical tests on the relationship between Subscription rate, issue size, industry type and underpricing using 196 initial public offerings on the Dhaka Stock exchange.
(Rock, 1986), showed that those investors who are more informed (than the firm as well as other investors) about high under pricing offers crowd out uninformed investors. On the other hand, these more informed investors withdraw in issues, which are over priced leaving the uninformed investors with the winner’s curse problem. Thus, the uninformed investors would not participate in over priced issues. Hence in order to attract such investors, the firm tries to get under price its IPO.
(Loughran T. &., 2002), found that during 1990-1998 firms, which went public had total earnings of $8 billion while they left $27 billion on the table even though they paid $13 billion as fees to him under writers. This made Loughran and Ritter propound a prospect theory for under pricing where they state that issuers of IPOs leave a lot of money on the table because they see a prospect of higher trading price in the first few days of listing, consequently, offsetting their loss of wealth in under pricing the IPOs and in fact, resulting in net gains to their wealth levels. More importantly they found that most IPOs leave little money on the table.
(Leite, 2007), generalized the informational assumptions of the the Rock model to address empirical evidence and conjectures that the standard model based on informed and uninformed investors is unable to address. They exhibited that high (low) market returns induce the issuer to price the issue more conservatively (aggressively) to create a negative relation between the public signal and the quality of the marginal investor, and in turn a positive link between market returns and underpricing.
(Dolvin, 2008), addressed the question of if or not periods of high underpricing adversely affect pre-existing shareholders. They construct that high levels of underpricing are associated with increased share retention, which effectively offsets much of the potential cost. Comprehensive, the proportion of shareholder wealth lost is stable over time, unlike underpricing itself. Furthermore, many factors known to be related to underpricing are not significant determinants of the cost of going public to pre-existing owners.
(Kumar, 2010) has shown the efficiency of IPO issuing mechanisms using a sample of Indian IPOs that tapped the primary market during 2003-07 by taking into thoughtfulness the total costs the issuers have to face i.e., including both direct as well as indirect costs. He encounters that from a total cost point of view the issuers fare neither better nor worse using either book building or the fixed price offers. Their results also revealed that the issue expenses associated with book building is more than those associated with fixed price offers after controlling for issue size and firm specific characteristics.
(Islam and Ali, 2010), has Analyzed the levels of underpricing in initial public offerings (IPOs) and its determinants of Dhaka Stock Exchange (DSE). Key trends in the levels of underpricing and overpricing are highlighted out on a year to year, and industry as the industry basis. Regression Analysis shows that offer size and size of the company are positively related to the degree of underpricing. However, age of the firm and offer timing were build to have no significant impact on the degree of underpricing of IPO in the Dhaka Stock Exchange.
VOLUME NO. 2 (2012), ISSUE NO. 8 (AUGUST) ISSN 2231-5756
4.0 METHODOLOGY
The data is analyzed using multiple linear regression and ANOVA. All the firm specific variables are regressed against the underpricing to find out which variables are significant in determining the underpricing. A two-way ANOVA is done to see if there is a statistically significant difference in the underpricing between book build issues and issue by fixed price option.
H1: There is no statistical significant difference in subscription rate and level of underpricing. H2: There is no statistical significant difference in issue size and level of underpricing. H3: There is no statistical significant in pricing mechanism and level of underpricing. 4.1 MEASURES FOR VARIABLES
The variables used in the study have been measured as described below. 4.1.1. MEASURE OF UNDERPRICING
Consistent with the standard methodology, underpricing is calculated as the percentage change from the offer price to the closing price in the secondary market.
Traditional Underpricing = ((closing price - offer price) /offer price) * 100. Log underpricing = ln (P1-P0/P0)* 100
Log Underpricing = ln (closing price/ offer price) is used to determine the level of underpricing and to make standard practice and to avoid hetroscadisticity. Underpricing is used as dependent variable in this regression model.
4.1.2. MEASURE OF SUBSCRIPTION
The subscription measured as the quantity of shares of the total times had investors subscribe after the issue. The natural logarithm of this value is used as it is a standard practice and to remove hetroscadisticity.
4.1.3. MEASURE OF ISSUE SIZE
The issue size is measured as the total number of shares offered multiplied by the offer price. Again, the natural logarithm of this value is used as a standard practice and to remove hetroscadisticity.
4.1.4 MEASURE OF PRICING MECHANISM
A dummy variable is used to find the effect of pricing mechanism on level of underpricing. If ipo issued by book build is give 1 otherwise 0. 4.2 THE MULTIPLE REGRESSIONS MODEL
The impact of the independent variables namely, Subscription rate , Issue size, pricing mechanism both Book build & Fixed price option on the dependent variable underpricing is modeled through multiple regression as:
Underpricing = α + β1 Subscription + β2Issue Size + β3pricing mechanism + e
5.0. DATA COLLECTION
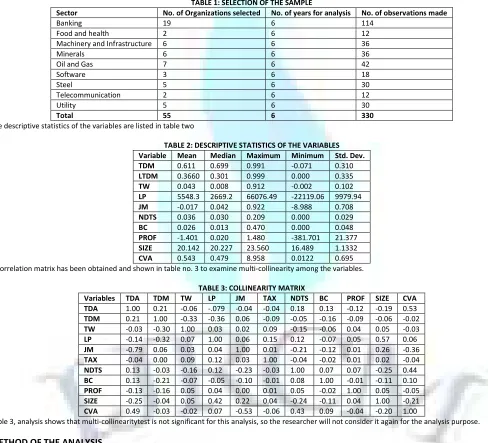
The data for the study was obtained from the website of the Bombay stock Exchange (BSE) http://www.bse-india.com/ under the heading of book building in IPOS. We also supplemented these data from CMIE & Capital line database. The period for which the data was taken for the study was Jan 2000 to 31st dec 2011. BSE was selected for the purpose of this study because it is the largest exchange in the country in terms of trading volumes. There were a total 550 IPOs for the period under study out of which 320 IPOs were underpriced.
IPOS ON BOMBAY STOCK EXCHANGE FROM 2000-2011
TABLE 1: IPOS AT BOMABY STOCK EXCHANGE FROM 2000-2011
Year Total Issue Issue in Bse BB method FPO method BB-Underp Fpo-Underp
2000 118 67 11 56 6 30
2001 16 10 2 8 0 2
2002 5 5 1 4 0 4
2003 14 11 4 7 3 5
2004 28 25 17 8 9 6
2005 70 67 48 19 26 14
2006 90 89 68 21 36 14
2007 106 105 91 14 58 7
2008 38 38 33 5 16 2
2009 21 21 21 0 14 0
2010 73 73 71 2 47 2
2011 40 39 38 1 19 0
Total 619 550 405 145 234 86
6.0 RESULTS ANALYSIS
6.1. DESCRIPTIVE STATISTICSThe descriptive statistics of the various variables in the model are as follows- DESCRIPTIVE STATISTICS
TABLE 2: PROVIDES THE DESCRIPTIVE STATISTICS FOR THE OVERALL STUDY SAMPLE Ln_UND Ln_SUBSC Ln_ISSUESI
Mean 3.164458 2.280388 4.476758 Median 3.280198 2.197225 4.440404 Maximum 7.476755 5.068904 9.646987 Minimum -0.336472 0.000000 -0.400478 Std. Dev. 1.357890 1.330978 1.748377 Skewness 0.240327 0.052702 0.084059 Kurtosis 3.060826 1.793809 3.433706
Jarque-Bera 3.129709 19.54677 2.884866 Probability 0.209118 0.000057 0.236352
VOLUME NO. 2 (2012), ISSUE NO. 8 (AUGUST) ISSN 2231-5756 6.2. CHECKING THE DATA FOR STAIONARITY OF THE TIME SERIES
A plot of the degree of the underpricing with respect to the number of observations (320) was obtained. Since the issues listed by close of Dec, 2011 were the most recent and the count was from them backwards up to Jan – 2000, the plot shows that the degree of underpricing.
FIG 1: DEGREE OF UNDERPRICING AND AUTO CORRELATION FUNCTION (ACF)
6 0 5 5 5 0 4 5 4 0 3 5 3 0 2 5 2 0 1 5 1 0 5 1 1 . 0 0 . 8 0 . 6 0 . 4 0 . 2 0 . 0 - 0 . 2 - 0 . 4 - 0 . 6 - 0 . 8 - 1 . 0
L a g
A
u
to
c
o
rr
e
la
ti
o
n
A u t o c o r r e l a t i o n F u n c t i o n f o r U N D E R ( w i t h 5 % s i g n i f i c a n c e l i m i t s f o r t h e a u t o c o r r e l a t i o n s )
FIG 2: DEGREE OF UNDERPRICING – FIRMS TO THE EXTREME LEFT IN THE X ASIS WERE LISTED IN JAN 2000 AND THOSE TO THE EXTREME RIGHT IN DEC-2011. OTHER FIRMS GOT LISTED IN THE INTERVENING MONTHS. Y AXIS SHOWS THE DEGREE OF UNDERPRICING IN PERCENTAGE TERMS.
In order to test whether the series is stationary or not, the plots of auto correlation functions (ACF) were used and were found to be within confidence intervals. To further establish stationarity, a unit root stationarity test.
TABLE NO 4: STATIONARITY RESULTS BY AUGMENTED DICKEY-FULLER TEST EQUATION Null Hypothesis: UNDER has a unit root Exogenous: Constant
Lag Length: 0 (Automatic - based on SIC, maxlag=16)
t-Statistic Prob.*
Augmented Dickey-Fuller test statistic -13.93049 0.0000
Test critical values: 1% level -3.450812
5% level -2.870444
10% level -2.571584 *MacKinnon (1996) one-sided p-values.
The computed ADF test-statistic (-13.93) is smaller than the critical values - "tau" ( -2.5715, -2.870, -3.4508 at 10%, 5%, 1% significant level, respectively), therefore we can reject Ho. It means the underpricing I series doesn't has an unit root problem and the underpricing series is a stationary series at 1%, 10% and 5% significant level.
6.3. TESTING THE NORMALITY OF THE DEPENDENT VARIABLE
In order to find out whether the dependent variable which is degree of underpricing follows the normality assumption or not, we plotted the histogram and conducted Jarque Bera test which gave the following results:
0 100 200 300 400 500 600 700
25 50 75 100 125 150 175 200 225 250 275 300
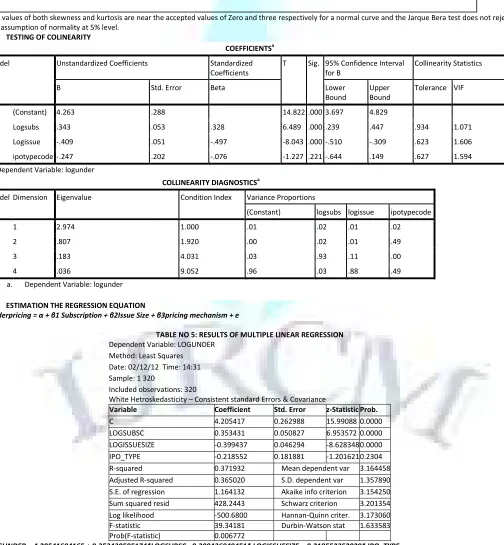
VOLUME NO. 2 (2012), ISSUE NO. 8 (AUGUST) ISSN 2231-5756 FIG 3 – TESTING FOR THE NORMALITY ASSUMPTION OF THE DEGREE OF UNDERPRICING
The values of both skewness and kurtosis are near the accepted values of Zero and three respectively for a normal curve and the Jarque Bera test does not reject the assumption of normality at 5% level.
6.4. TESTING OF COLINEARITY
COEFFICIENTSa
Model Unstandardized Coefficients Standardized
Coefficients
T Sig. 95% Confidence Interval for B
Collinearity Statistics
B Std. Error Beta Lower
Bound
Upper Bound
Tolerance VIF
(Constant) 4.263 .288 14.822 .000 3.697 4.829
Logsubs .343 .053 .328 6.489 .000 .239 .447 .934 1.071
Logissue -.409 .051 -.497 -8.043 .000 -.510 -.309 .623 1.606
ipotypecode -.247 .202 -.076 -1.227 .221 -.644 .149 .627 1.594
a. Dependent Variable: logunder
COLLINEARITY DIAGNOSTICSa
Model Dimension Eigenvalue Condition Index Variance Proportions
(Constant) logsubs logissue ipotypecode
1 1 2.974 1.000 .01 .02 .01 .02
2 .807 1.920 .00 .02 .01 .49
3 .183 4.031 .03 .93 .11 .00
4 .036 9.052 .96 .03 .88 .49
a. Dependent Variable: logunder
6.5. ESTIMATION THE REGRESSION EQUATION
Underpricing = α + β1 Subscription + β2Issue Size + β3pricing mechanism + e
TABLE NO 5: RESULTS OF MULTIPLE LINEAR REGRESSION Dependent Variable: LOGUNDER
Method: Least Squares Date: 02/12/12 Time: 14:31 Sample: 1 320
Included observations: 320
White Hetroskedasticity – Consistent standard Errors & Covariance
Variable Coefficient Std. Error z-Statistic Prob.
C 4.205417 0.262988 15.99088 0.0000
LOGSUBSC 0.353431 0.050827 6.953572 0.0000
LOGISSUESIZE -0.399437 0.046294 -8.628348 0.0000
IPO_TYPE -0.218552 0.181881 -1.201621 0.2304
R-squared 0.371932 Mean dependent var 3.164458
Adjusted R-squared 0.365020 S.D. dependent var 1.357890
S.E. of regression 1.164132 Akaike info criterion 3.154250
Sum squared resid 428.2443 Schwarz criterion 3.201354
Log likelihood -500.6800 Hannan-Quinn criter. 3.173060
F-statistic 39.34181 Durbin-Watson stat 1.633583
Prob(F-statistic) 0.006772
LOGUNDER = 4.20541694165 + 0.353430595174*LOGSUBSC - 0.399436849451* LOGISSUESIZE - 0.218552352029* IPO_TYPE
0 5 10 15 20 25 30
0 1 2 3 4 5 6 7
Series:
L
O
G
U
NDE
R
Sam
ple
1
32
0
Observ
at
ion
s
320
Mean
3.164458
Median
3.280198
Maximum 7.476755
Minimum
-0.336472
Std. Dev. 1.357890
Skewness 0.240327
Kurtosis
3.060826
VOLUME NO. 2 (2012), ISSUE NO. 8 (AUGUST) ISSN 2231-5756 The adjusted R squared is 36.50%. The low value could be because of the wide heterogeneity in the firms considered as the sample. The coefficient of SUBSC & issue size is significant at 1% level. The Durbin Watson statistic is close to 2, which reveal that the degree of undepricing is not simulated by first-order auto correlations. In fact, we have checked for the robustness of these results by Akaike information Criterion (AIC) improves slightly.
ANOVA
Sum of Squares df Mean Square F Sig.
Between Groups 15.712 1 15.712 7.589 .006
Within Groups 658.346 318 2.070
Total 674.058 319
Predictors: (Constant), ipotypecode a. Dependent Variable: logunder
ANOVAb
Model Sum of Squares df Mean Square F Sig.
1 Regression 167.315 3 55.772 39.34 .000a
Residual 506.743 316 1.604
Total 674.058 319
a. Predictors: (Constant), ipotypecode, logsubs, logissue b. Dependent Variable: logunder
RESIDUALS STATISTICSa
Minimum Maximum Mean Std. Deviation N
Predicted Value .4924 4.9266 3.1302 .72422 320
Residual -5.35723 2.84949 .00000 1.26037 320
Std. Predicted Value -3.642 2.480 .000 1.000 320
Std. Residual -4.230 2.250 .000 .995 320
a. Dependent Variable: logunder
7.0 DISCUSSION
Derived on the results of multiple linear regressions it was construct that variables such as subscription and issue size are statistically significant at 1% level of significance. Ipo type has no relevant association at the level of underpricing. There is a consequential relationship between subscription rate and the level of underpricing at 1% level of significance (z = 6.95). So we reject hypothesis 1. The subscription has positive association with the underpricing, which insinuates that higher subscription rate tends to more underpriced and vice-versa. At the time of higher subscription rate the investors who fail to get shares in the ipo market might be transforming towards this increased demand in the secondary market, leading to higher underpricing.
There is a significant connection between issue size and level of underpricing at 1 % level of significant (z= 8.62), which reject hypothesis 2. The issue size has a negative impact on the underpricing, which intimates that firms with more issue size tend to be underpriced less and vice-versa. It can be authoritative that large issue size leads to be increased in supply of share in ipo, leading to lesser underpricing. There is no significant distinction in pricing mechanism and underpricing ( z= -1.21). So we accept hypothesis 3 at 5% level of significance (table value z = -1.96). There is no significant difference between pricing mechanism and level of underpricing.
Our study also gave corresponding results regarding subscription rate, i.e. (1(Ritter, 1984), are having a positive relationship between the level of underpricing and the ex ante uncertainty about the value of the firm. The results indicating the positive relationship of subscription rate & level of underpricing in the present study is in confirmation with results found by (Islam, 2010), in their study. The results indicating the negative relationship of issue size with underpricing in the present study is in confirmation with the results found by (Deb, 2010), book build has found to be more effective pricing mechanism compare to fixed price option The results indicating that there is no significant relationship between pricing mechanism and level of underpricing is in confirmation with result found by (Bansal, 2012). Pricing mechanism is no significant related with level of underpricing.
8.0 CONCLUSION
This study has several important contributions. This paper analyzed the extent of underpricing in the Indian primary market and examined as to which factors are weighty in affecting the underpricing. Between the variables, only the subscription and issue size was found to be relevant in affecting the underpricing. There is a momentous negative relationship between the issue size and underpricing. While there is a important positive relationship between the subscription and underpricing which implies that larger issuing size firms underpriced less and vice-versa. And firm with highly subscribed tends to be more underpriced. Notwithstanding, there is no significant difference between underpricing and pricing mechanism.
REFERENCES
1. Allen, F., and Faulhaber, G. (1989), “Signaling by under pricing in the IPO market “, Journal of Financial Economics, Vol. 23, pp. 303-323.
2. Bansal,R., and Khanna, Ashu. (2012), “pricing mechanism and explaining underpricing of ipos”: evidence from bombay stock exchange, India, International journal of research in finance and marketing, Vol. 2, No. 2, pp. 205-216.
3. Baron, D.P. (1982), “A Model of the Demand for Investment Banking Advising and Distribution Services for New Issues”, The Journal of Finance, Vol.37, No. 4, pp. 955-976.
4. Benveniste, L.M., and Spindt, P.A. (1989), “How investment bankers determine the offer price and allocation of new issues”, Journal of Financial Economics, Vol. 24, pp. 343-361.
5. Deb, Saikat. Sovan., and Merisetty, Vijaya. B. (2010), “Information content of IPO grading, Journal of banking & Finance”, Vol. 34, pp. 2294-2305.
6. Dolvin, S.D., and Jordan, B.D. (2008), “Underpricing, overhang, and the cost of going public to pre-exiting shareholders”, Journal of Business Finance and Accounting, Vol. 35, pp. 434-458.
7. Ibbotson, R.G. (1975), “Price performance of common stock new issues”, Journal of Financial Economics, Vol. 2, pp. 235-272. 8. Leite, T. (2000), “Adverse selection, public information, and underpricing in IPOs”, Journal of corporate Finance, Vol. 13, pp. 813-903.
413-VOLUME NO. 2 (2012), ISSUE NO. 8 (AUGUST) ISSN 2231-5756 11. McDonald, J.G., and A.K. Fisher. (1972), “New Issues Stock Price Behavior”, Journal of Finance, pp. 97-102.
12. Megginson, W.L., and K.A. Weiss. (1991), “Venture capitalist certification in initial public offerings, Journal of Finance, Vol. 46, pp. 879–903.
13. Muscarella, C. J., and Vetsuypens, M. R. (1989), “A simple test of Baron's model of IPO underpricing”, Journal of Financial Economics, Vol. 24, pp. 125–135. 14. Ritter, J.R. (1984), “Signaling and the Evaluation of Unseasoned New Issues: A Comment”, the Journal of Finance, Vol. 39, pp. 1231-1237.
15. Ritter, J.R. (1991), “The Long Run Performance of Initial Public Offerings”, the Journal of Finance, Vol. 46, pp. 3-27. 16. Rock, K. (1986), “Why new issues are underpriced?”, Journal of Financial Economics, Vol. 15, pp. 187-212. 17. SEBI, (2009), Annual reports for share market. India. http:/www.sebi.co.in
VOLUME NO. 2 (2012), ISSUE NO. 8 (AUGUST) ISSN 2231-5756
BANKRUPTCY PREDICTION OF FIRMS USING THE DATA MINING METHOD
ATIYE ASLANI KTULI
STUDENT
DEPARTMENT OF ACCOUNTING
NEYSHABUR BRANCH
ISLAMIC AZAD UNIVERSITY
NEYSHABUR
MANSOUR GARKAZ
ASSOCIATE PROFESSOR
DEPARTMENT OF ACCOUNTING
ALIABADKATOOL BRANCH
ISLAMIC AZAD UNIVERSITY
ALIABADKATUL
ABSTRACT
The purpose of this paper is to anticipate financial bankruptcy of firms in Iranian Stock Exchange using the data mining technique. To that effect, required data were gathered from financial statements of 89 companies listed in Iranian Stock Exchange active in the business of Compact Disks, and the required data were estimated and extracted for a seven-year period (2003-2009). Statistical methods used in this paper include regression analysis, diagnostic analysis, and artificial neural network. The neural network used in this paper is a multilayer perceptron trained by error back propagation algorithm and include triple layer feed-forward neural network arranged as input, centric and output neurons. The sample of the study consists of two groups of bankrupted and solvent firms. The bankrupts group has been selected based on “Article 141” of Commerce Law during 2003 to 2009, and the solvent group has been chosen randomly and with respects to the industry of the bankrupted firm. Results reveal that data mining model with 53.78% accuracy in identifying bankrupted firms and 97.10% accuracy in identifying solvent firms, and artificial neural network model with 85% accuracy in identifying bankrupted firms and 95% accuracy in identifying solvent firms can predict bankruptcy of the firms.
KEYWORDS
bankruptcy prediction, data mining, artificial neural network model, diagnostic analysis.
INTRODUCTION
ankruptcy of firms usually has an impact on stock exchanges’ liquidity and economy development. In time of bankruptcy, banks normally make funds less available to bankrupted firms and, in order to recompense the extra-risk, ask for higher interests. Similarly, financial investment institutes, such as pension funds institutes and insurance companies, decrease buying shares and focus more on investments and bonds issued by banks or similar markets. All these would lead to lesser liquidity in capital market, increase in firms’ capital cost and decrease in economical growth. With respects to adverse effects of bankruptcy on capital markets and economy, scholars and stakeholders decided to develop prediction models by using different approaches in order to reduce the disadvantages and damages due to those adverse effects. Usually, different and interrelated factors lead to bankruptcy of firms; hence, it is not a simple task to identify the exact cause or causes of bankruptcy and financial issues in each specific case. Generally, factors that lead to bankruptcy of organizations are whether internal or external to the organization. External factors are those that are not controllable by the firm, however, they may lead to financial problems for the firm. On the other hand, internal factors are due to managers’ faults or their inability in taking appropriate actions with respects to managerial decisions; examples include providing and increasing customers’ credit, excessive sales on credit, and inefficient management.[1] Bankruptcy prediction is a binary prediction in which the firm is either bankrupted or solvent and the model developed for such prediction should be capable of determining state of bankruptcy or non-bankruptcy of firms. Data mining methods include: 1- Artificial Neural Network; 2- Diagnostic Analysis; 3- Regression Analysis; 4- Neuro-fuzzy.
In a study titled “A Comparative Study of Bankruptcy Prediction using Altman, Logit and Artificial Neural Network Models”, Garkaz and Barzegar Khandoozi (2010) analyzed this issue during the 2003-2009 period; financial ratios in neural network model include: 1- working capital to total assets; 2- retained earnings to total assets; 3- EBIT to total assets; 4- equity to debt ratio; 5- net sales to total assets. Accuracy of the models in the year of bankruptcy, one year and two years previous to that is 83.5%, 76.5% and 79.5%, for Altman model; 73.5%, 64.7% and 63.8% for logit model; and, 93.7%, 99.4% and 90% for Artificial Neural Network, respectively.
In a paper titled “Predicting Financial Exhaustion of Firms in Tehran Stock Exchange during 2006-2009 using Logit, Neuro-Fuzzy Network, and Neural Network”, Moosavi and Ahangari (2012) used MAE (Mean Absolute Error) and RMSE (Root Mean Squared Error) to evaluate performance of these algorithms. According to findings, mean errors for neural, logit and neuro-fuzzy models were 31%, 39% and 41%, based on RMSE, and 23%, 32% and 34%, based on MAE, respectively. Using neuro-fuzzy model, Zangane (2009) showed that both neuro-fuzzy and logistic regression can predict bankruptcy of firms; the period for that study was 1997-2008. Findings revealed an accuracy of 96.27% for neuro-fuzzy model and 80.21% for logistic regression model.
Sung Yin Chun (2009) compared logit, artificial neural network, combinatory multiple discriminant analysis, decision tree, support vector technique and combinatory neural network technique, and by using neural network learning, offered a hybrid model for predicting bankruptcy. The results showed an accuracy of 78.15% for combinatory multiple discriminant analysis model, 78.04% for logit model, 78.01% for artificial neural network model, 72.38% for decision tree, 78.0170% for support vector technique, and 78.92% for combinatory neural network model.
Yeldiz and Akkoc (2010) conducted a research titled “Bankruptcy Prediction using Neuro Fuzzy: An Application in Turkish Banks”. The sample of the study consisted of 55 banks that were divided to two groups as training and validation. The training group consisted of 11 bankrupted banks and 22 solvent banks. The validation group consisted of 8 bankrupted banks and 14 solvent banks. Independent variables consisted of the following six financial ratios: 1- capital ratios; 2- assets quality; 3- liquidity; 4- profitability; 5- income-expenditure structure; and 6- activity ratios. The results showed an accuracy of 90.91%.
RESEARCH DATA, HYPOTHESIS AND METHODOLOGY
In this research, which mainly aims at predicting firms’ bankruptcy using the best predictor variables from previous studies, perceptron neural networks and diagnostic analysis are used alongside the following predictor variables. It should be mentioned that “Clause 141” of Commerce Law is the criteria for choosing a firm as bankrupted. According to “Clause 141” of Commerce Law, in the event of loss of at least half of the firm’s assets, board of directors is obliged to bring together members of the general meeting of stakeholders as to decide for liquidation or survival of the firm.
VOLUME NO. 2 (2012), ISSUE NO. 8 (AUGUST) ISSN 2231-5756 Data include: 1- shareholders’ equity to total liabilities and shareholders’ equity ratio; 2- leverage ratios; 3- debt to equity ratio; 4- return on assets; 5- earning per share ratio; 6- return on equity ratio; 7- current ratio; 8- quick ratio; 9- current assets to total assets ratio; 10- cash flow to total debt ratio; 11- cash flow ratio; 12- inventories to total asset ratio; 13- inventories to sales ratio. Statistically, this research is a modeling study, and with respects to its methodology, it is a descriptive (semi-experimental) correlation study in which the relationship between variables is analyzed with regards to the research’s objective.
Criteria for Sample Companies
They should be listed in Stock Exchange and their fiscal year should end by mid-March each year. They should not be financial intermediary firms and information about them should be available.
Hypotheses:
Hypothesis 1- Data mining model can predict firms’ bankruptcy.
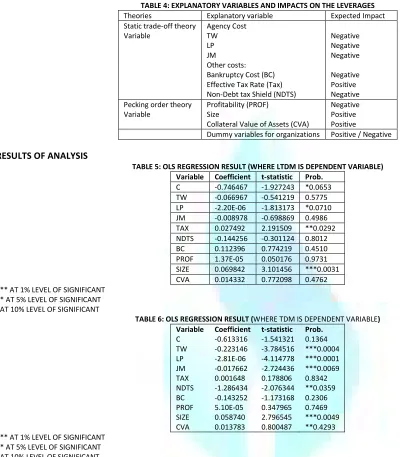
First, using data refinement methods, wild data were removed and then lost data were simulated using simulation method in data mining. Subsequently, we have examined factors influencing bankruptcy by using diagnostic analysis method. The results are shown in figure 1. Using Fisher statistic, we concluded that variables are significant and therefore predictable.
TABLE 1: SIGNIFICANT DIAGNOSTIC MODEL
F-value P-value
19.19 0.000
19.19F=
TABLE 2: SIGNIFICANT COEFFICIENTS TEST
Wilks' Partial F-remove p-level Equity ratio/assets 0.6791 0.9997 0.1911 0.6621 Equity Ratio 0.6792 0.9996 0.2222 0.6375 Debt/Equity 0.6823 0.9950 2.8764 0.0904
Profit before interest and taxes/ interest 0.6791
0.9997 0.1530
0.6958
Return on Assets 0.7420
0.9150 52.7839
0.0000
Earnings Per Share(EPS) 0.6825
0.9948 2.9797
0.0849
Return on equity 0.6828 0.9943 3.2382 0.0725 Currnt ratio 0.6810 0.9969 1.7931 0.1811 Acid-test raito 0.6792 0.9996 0.2275 0.6336
Currunt assets to total assets 0.6795
0.9992 0.4619
0.4970
Cash flow to totall debt ratio 0.6825
0.9947 3.0247
0.0825
Cash flow ratio 0.6849
0.9912 5.0376
0.0252
Inventory to total assets ratio 0.6874
0.9876 7.1160
0.0079
Inventory to sale ratio 0.7117
0.9539 27.4320
0.0000
According to figure 2, F function can be achieved through statistics of the similar test. From these statistics, it was revealed that what coefficients are significant and what are their values. In general, Return on Assets, Cash Flow ratio, Inventories to Total Assets ratio, and Inventories to Sales ratio are significant in the model; we used step-by-step diagnosis analysis technique to eliminate them. The results are shown in figure 3.
TABLE 3: SIGNIFICANT S ANALYSIS STEP-BY-STEP DIAGNOSIS TECHNIQUE
F-value P-value
62.95 0.000
According to figure 3, it can be seen that the model is still statistically significant even after elimination of redundant variables. Now we examine the effect of significant variables of the model.
TABLE 4: SIGNIFICANT S ANALYSIS STEP-BY-STEP VALUES
Wilks' Partial
F-remove p-level
Return on Assets 0.884333
0.787644 155.8338
0.000000
Inventory To Sale Ratio 0.736270
0.946039 32.9682
0.000000
Inventory To Total Assets ratio 0.706778
0.985514 8.4958
0.003698
Cash flow ratio 0.703012
0.990795 5.3702
0.020832
TABLE 5: VALUES OF SIGNIFICANT S ANALYSIS STEP-BY-STEP DIAGNOSIS TECHNIQUE
Non-bankrupt bankrupt
Return on Assets 2.81911
-1.30751
Inventory To Sale Ratio 3.77797
5.80543
Inventory To Total Assets ratio -0.06060
-0.08599
Cash flow ratio 0.00163
0.00327
Fixed -1.33353
-2.48236
According to figure 5, diagnosis function for solvent firms is as follows and the criterion for assuming a firm as solvent is 0.5918. P=-1.33353+2.81911* Return on Assets +3.77797* INVENTORY TO SALE RATIO
-0.06060*INVENTORY TO TOTAL ASSETS ratio +0.00163* CASH FLOW RATIO
Diagnosis function for bankrupted firms is as follows and the criterion for assuming as bankrupted is 0.4082.
VOLUME NO. 2 (2012), ISSUE NO. 8 (AUGUST) ISSN 2231-5756 TABLE 6: EXPLANATORY POWER OF DATA MINING
Percent correct Non-bankrupt bankrupt Non-bankrupt 97.10 335 10 bankrupt 53.78 110 128 Overall firms 79.42 445 138
Considering the probability value and comparing that value with the significance level, one can conclude that the “Data mining model can predict firms’ bankruptcy”.
Hypothesis 2- Artificial neural network model can predict firm’s bankruptcy.
Similarly, to determine explanatory power of neural network model, data refining and simulation methods were used at first. Subsequently, using various models of neural networks, we tried to estimate the accuracy of neural networks in bankruptcy prediction. Neural function used in this study is perceptron. Based on a computing unit called perceptron, a type of neural network is generated. A perceptron takes a vector of inputs with real numbers and calculates a linear combination of these inputs. If the result exceeds a specific threshold, perceptron’s output will be equal to 1, otherwise it will be equal to -1.
Perceptron’s output is calculated based on the following equation:
We fed the network with the data for 5 times; the results are as follow: In figure 7 the accuracy of different neural networks are presented
TABLE 7: THE ACCURACY OF DIFFERENT NEURAL NETWORKS
neural network Training perf. Test perf. MLP 14-12-2 86.29550 90.51724 MLP 14-9-2 88.43683 89.65517 MLP 14-4-2 87.36617 88.79310 MLP 14-7-2 91.00642 90.51724
MLP 14-8-2 86.72377
88.79310
According to figure 7, it is MLP 14-7-2 neural network model that has predicted a high percentage of the bankruptcies. After employing mentioned neural networks, predicted bankruptcy of each network is shown in figure 8.
TABLE 8: PREDICTED BANKRUPTCY OF EACH NETWORK
Non-bankrupt bankrupt MLP 14-12-2 Overall firms 280 187 accurate predictions 270 133 Inaccurate predictions 10 54
accurate predictability power 96
71
inaccurate predictability power 3 28 MLP 14-9-2 Overall firms 280 187 accurate predictions 265 148 Inaccurate predictions 15 39
accurate predictability power 94
79
inaccurate predictability power 5 20 MLP 14-4-2 Overall firms 280 187 accurate predictions 258 150 Inaccurate predictions 22 37
accurate predictability power 92
80
inaccurate predictability power 7 19 MLP 14-7-2 Overall firms 280 187 accurate predictions 266 159 Inaccurate predictions 14 28
accurate predictability power 95
85
inaccurate predictability power 5
14
MLP 14-8-2 Overall firms 280 187 accurate predictions 271 134 Inaccurate predictions 9 53
accurate predictability power 96
71
inaccurate predictability power 3
28
As mentioned, according to figure 8 the best neural network model is MLP 14-7-2 model that has the highest accurate predictability power. Overall, 280 bankrupted firms and 187 solvent firms were observed. Of these observations, 266 of solvent firms and 159 of bankrupted firms were accurately selected. Inaccurate predictions were 14 for solvent firms and 28 for bankrupted firms. The prediction accuracy percentage is 95 for solvent firms and 85 for bankrupted firms which shows better results than other models. Since neural networks predict the status of the firms accurately in 90 percent of times, it could be accepted that neural networks can predict bankruptcy of firms.
Hypothesis 3- The level of the first type error is equal for data mining and neural networks bankruptcy prediction models. (First type error means that the firm is solvent but the model has selected it as bankrupted.)
Since the bankruptcy predictability power of neural network model and diagnosis analysis technique is identified, it would be adequate to compare inaccuracy of the two models in determining bankruptcies; then, the following hypotheses are proposed:
H0: The level of the first type error is the same for data mining and neural networks bankruptcy prediction models. H1: The level of the first type error is not the same for data mining and neural networks bankruptcy prediction models. The statistical representation of this hypothesis is as follows:
VOLUME NO. 2 (2012), ISSUE NO. 8 (AUGUST) ISSN 2231-5756 Where α1 and α2 are first type errors of diagnosis analysis and neural networks models, respectively.
TABLE 9: THE LEVEL OF THE FIRST TYPE ERROR IS THE SAME FOR DATA MINING AND NEURAL NETWORKS BANKRUPTCY
first type error The prediction accurate solvent
Inaccurate predictions for solvent
data mining 2.90
335 10
neural networks 5.00
266 14
TABLE 10: TABLE OF TEST RATIO
Z-value P-value
1.3258 0.1849
With regards to the probability value and comparing that value with the significance level, one can conclude that the null hypothesis or the hypothesis stating “the level of the first type error is the same for data mining and neural networks bankruptcy prediction models” is not rejected in 95% confidence level. As the values for errors are too close, it cannot be generalized, and so they are assumed as equal.
Hypothesis 4- The level of the second type error is the same for data mining and neural networks bankruptcy prediction models. (First type error means that the firm is bankrupted but the model has selected it as bankrupted.)
It is adequate to compare inaccuracy of the two models in determining non-bankruptcies; then, the following hypotheses are proposed: H0: The level of the second type error is the same for data mining and neural networks bankruptcy prediction models.
H1: The level of the second type error is not the same for data mining and neural networks bankruptcy prediction models. H0: β1=β2
H1: β1≠ β2
Where β1 and β2 are the second type errors of diagnosis analysis and neural networks models, respectively. According to diagnosis analysis and neural networks models:
TABLE 11: THE LEVEL OF THE SECOND TYPE ERROR IS THE SAME FOR DATA MINING AND NEURAL NETWORKS BANKRUPTCY
second type error accurate predictions in bankrupt
inaccurate predictions in bankrupt
data mining 46%
128 110
neural networks 15%
159 28
TABLE 13: TABLE OF TEST RATIO
Z-value P-value
7.5225 0.0000
With regards to the probability value and comparing that value with the significance level, one can conclude that the null hypothesis or the hypothesis stating “the level of the first type error is the same for data mining and neural networks bankruptcy prediction models” is not rejected in 95% confidence level. As the difference is high, the result can be generalized.
RESULTS AND FINDINGS
In order to perform statistical analysis required for predicting firms’ bankruptcy using data mining method, 89 companies listed in Iranian Stock Exchange were chosen as samples for this study and the required data were estimated and extracted for a seven-year period (2003-2009). To determine the accuracy of the proposed hypotheses using the designed tests, information’s averages were analyzed. Based on the first hypothesis of the research, data mining method can predict bankr