TECHNICAL NOTE
THERMAL CONTACT RESISTANCE OF WAVY
SURFACES
Ahmad Saboonchi and Zaeim Mousavy Mohammadi
Department of Mechanical Engineering, Isfahan University of Technology Isfahan, 84156, Iran, ahmadsab@cc.iut.ac.ir - szaeemm@yahoo.com
(Received: December 23, 2003 - Accepted in Revised Form: May 10, 2004)
Abstract In this paper, the method of determining thermal contact resistance of wavy surfaces is discussed exactly. For determining the thermal contact resistance of real contacts, a new method has been presented. In this method, assuming a regular sinusoidal surface profile, the real contact area in terms of applied forces has been determined. Then thermal contact resistance has been calculated. Testing 6 kinds of insulator’s combinations with wavy surfaces has approved the reliability of the analysis. The results of experiments and analysis had good agreement with each other.
Key Words Thermal Contact Resistance, Wavy Surface, Sinusoidal Surface Profile
ﻩﺪﻴﻜﭼ
ﻩﺪﻴﻜﭼ
ﻩﺪﻴﻜﭼ
ﻩﺪﻴﻜﭼ
ﺭﻮﻄﺑﺭﺍﺪﺟﻮﻣﺡﻮﻄﺳﺱﺎﻤﺗﻲﺗﺭﺍﺮﺣﺖﻣﻭﺎﻘﻣﻦﻴﻴﻌﺗﺵﻭﺭﻪﻟﺎﻘﻣﻦﻳﺍﺭﺩ ﻲﺳﺭﺮﺑﻖﻴﻗﺩ
ﺪﺷ ﺖﺳﺍﻩ . ﻱﺍﺮﺑ
ﺖﺳﺍ ﻩﺪﻳﺩﺮﮔﻪﺋﺍﺭﺍ ﻱﺪﻳﺪﺟ ﺵﻭﺭ ﺱﺎﻤﺗﺡﻮﻄﺳ ﻲﺗﺭﺍﺮﺣ ﺖﻣﻭﺎﻘﻣ ﻦﻴﻴﻌﺗ .
ﻞﻴﻓﻭﺮﭘ ﻚﻳ ﺽﺮﻓ ﺎﺑﺵﻭﺭ ﻦﻳﺍ ﺭﺩ
ﻦﻴﻴﻌﺗﻲﻟﺎﻤﻋﺍﻱﻭﺮﻴﻧﺐﺴﺣﺮﺑﻲﻌﻗﺍﻭﺱﺎﻤﺗﺢﻄﺳ،ﻲﺳﻮﻨﻴﺳﻢﻈﻨﻣ ﺪﺷ
ﻩ ﻭ ﺳ ﺖﻣﻭﺎﻘﻣﺲﭙ ﻪﺒﺳﺎﺤﻣﺱﺎﻤﺗﻲﺗﺭﺍﺮﺣ
ﺖﺳﺍ ﻩﺪﺷ .
ﺪﺷ ﻊﻗﺍﻭﺪﻴﻳﺄﺗ ﺩﺭﻮﻣﻞﻴﻠﺤﺗﺖﻗﺩ ،ﺭﺍﺪﺟﻮﻣﺡﻮﻄﺳﺎﺑ ﻖﻳﺎﻋﺕﻭﺎﻔﺘﻣ ﺐﻴﻛﺮﺗﻉﻮﻧﺶﺷﺶﻳﺎﻣﺯﺁﺎﺑ ﻭﻩ
ﻪﮐﻩﺪﺷﻩﺩﺍﺩﻥﺎﺸﻧ ﺪﻧﺭﺍﺩﺮﮕﻳﺪﻜﻳﺎﺑﻲﺑﻮﺧﻖﻓﺍﻮﺗﻲﻫﺎﮕﺸﻳﺎﻣﺯﺁﻭﻲﻠﻴﻠﺤﺗﺞﻳﺎﺘﻧ
.
1. INTRODUCTION
An extensive literature review in connection with contact conductance heat transfer has been provided in reference [1]. Available references show that most of the researches have been conducted on the hard flat surfaces (such as metallic contacts) which are rough on microscopic scale [1]. Analysis of the effect of thermal contact resistance (T.C.R.) on a couple of isolators’ characteristics has been the final goal of this research work. The modified results obtained from previous analyses may be applied to some types of isolators. Therefore, it’s essential to determine these isolators’ conditions. For example, unevenness of the surfaces of the most isolators could be seen easily without any apparatus. So unevenness could be simulated as regular geometric figures. Considering a microscopic section of an interface the modes of heat transfer across an interface would be:
• Solid to solid thermal radiation in the gaps.
• Convective, gaseous, molecular or other conduction through the gaps.
• Solid to solid conduction through the real contact area.
For mean temperatures below 600°C the radiative heat transfer amounts is small [2]. Since the temperatures of tests in this paper were below 600°C, the gap radiation is neglected. In contact conductance problems, heat transfer is not assumed in convection form [2]. Thermal gap conductance is described completely in reference [3]. In this paper, solid to solid conduction through the real contact area will be considered.
2. MODELING CONTACT OF WAVY SURFACES
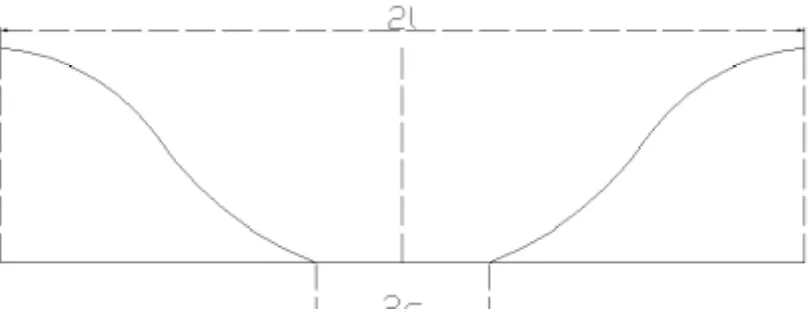
assuming the waves with similar periodically patterns. In a contact, the surfaces aren’t connected to each other in the entire contact region. So heat is transmitted from solid to solid contacts and gaps. One can assume these two mechanisms as two parallel thermal resistance [4]. Second, one of the surfaces is flat and the other one is rough (Figure 1). Furthermore, the waves of the rough surface in their undeformed state are taken as purely sinusoidal with a wavelength that is large in comparison to the amplitude. Third, as most of previous investigations, it is assumed constant temperature over the contact region [5,6,7].
The principle subject of this paper is determination of real contacts thermal resistance. For calculating thermal gap resistance, the “interpolated simple kinetic theory” by Yovanovich was used [3].
3. THERMAL RESISTANCE OF REAL CONTACT AREA
In the case of wavy contacts, the contact effects on the unevenness, is the most important point for indicating thermal resistance of real contacts area. For example, how the applied force deforms the unevenness of a surface. For analyzing, the subject
“Pressure Between Two Bodies in Contact [8]” has been used. Supposing Figure 1 and assumption of section 2, one can obtain the length of two contacting bodies pressing together [8]:
)
(
)
K
K
(
P
4
c
2 1
2 1 2
ρ
+
ρ
π
+
=
(1)where c is the half length of contact, P the applied force per unit length, ρ curvature of the surfaces, and K obtained from:
G
2
1
K
=
−
ν
(2)where υ and G are Poisson’s ratio and shear modulus, respectively. P is obtained from:
pl
2
P
=
(3)where p is applied pressure on the surfaces and 2l wavelength of the sinusoidal surface unevenness. Indicating curvatures of the surfaces is the next step. Considering Figure 1 and the sinusoidal surface profile, the equation of profile obtained as follows:
]
1
)
2
x
l
(
Sin
[
2
b
y
=
π
−
π
+
(4)With assumption that wavelength is large in comparison to the amplitude, the first surface curvature will be calculated in the following way:
2 2 p
l
2
b
1π
=
ρ
(5)where b is the amplitude of sinusoidal wavy surface. Since the second surface is flat, the curvature of it will be zero. So value of ρ1+ρ2 in
the absence of heat flow is that of the first surface. However, the curvature of a surface depends on the changes in temperature and heat flow through the boundary. For plain strain and steady state temperature distribution, the thermoelastically-induced curvature of boundaries will be proportional to the local heat flux [9]. In particular, we have: n t
q
k
)
1
(
+
υ
α
=
ρ
(6)where δ = α(1+υ)/k is known as the thermal distortivity and α, υ, k are the thermal expansion coefficient constant, Poisson’s ratio and thermal conductivity, respectively, for the material [9]. It is assumed that heat is transmitted only where there is solid to solid contact, so one can write:
n
q
c
2
q
l
2
×
∞=
×
(7)Substituting value of qn in (6), ρt will be obtained:
δ
=
ρ
∞c
q
.l
t (8)
Using this value, the mismatch in curvatures caused by heat flow is:
c
)
(
lq
2 1 tt
t 2 1
δ
−
δ
=
ρ
−
ρ
=
ρ
∆
∞ (9)Adding the contributions (5) and (9), the total curvature will be obtained:
c
lq
l
b
(
)
2
1 2 2 2 2 1δ
δ
π
ρ
ρ
+
=
+
∞−
(10)Substituting (2), (3) and (10) into (1) leads to the following quadratic equation for determining the extent of contact:
0
)
K
K
(
pl
8
c
)
(
lq
c
l
2
b
2 1 1 2 2 2 3=
+
−
δ
−
δ
π
+
π
∞ (11)Assuming A and B as below, equation (14) will be
obtained:
b
l
A
23
π
=
(12)b
)
K
K
(
pl
16
B
3 31 2π
+
−
=
(13)0
B
c
)
(
Aq
2
c
2−
δ
1−
δ
2+
=
∞ (14)
Since the constant B is negative, the equation (14) always has a positive answer:
B
)]
(
Aq
[
)
(
Aq
c
22 1 2
1
−
δ
+
δ
−
δ
−
δ
=
∞ ∞(15)
As seen from (15), the extent of contact c depends on direction of heat flux and material of the surface 1 and 2. Therefore, thermal contact conductance of wavy surfaces depends on the order of surface location.
Now the main value of analysis is determined. Having length of contact region, one can calculate the thermal contact resistance of real contact region. So area of real contact region is used instead of apparent contact area region:
s 1 s
A
k
b
R
=
(16)where b is height of unevenness, k1 thermal TABLE 1. Analytical and Experimental Results of Thermal Contact Resistance –Carbon and Carbon.
p (bar)
TCRe
Experimental (W/m2.K)-1
TCRt
Analytical (W/m2.K)-1
WTCRe
(%)
2.5 5.9x10⁻³ 4.8x10⁻³ 1.27
5 5.4x10⁻³ 4.6x10⁻³ 1.3
7.5 5.1x10⁻³ 4.4x10⁻³ 1.27
10 4.6x10⁻³ 4.2x10⁻³ 1.33
TABLE 2. Analytical and Experimental Results of Thermal Contact Resistance –Carbon and Glass.
p (bar)
TCRe
Experimental (W/m2.K)-1
TCRt
Analytical (W/m2.K)-1 W(%) TCRe
1.8 3.6x10⁻³ 3x10⁻³ 4.2
3.7 3.1x10⁻³ 2.7x10⁻³ 4.8
5.5 2.8x10⁻³ 2.4x10⁻³ 5.4
7.4 2.5x10⁻³ 2.2x10⁻³ 6
TABLE 3. Analytical and Experimental Results of Thermal Contact Resistance – Alumina and Glass.
p (bar)
TCRe
Experimental (W/m2.K)-1
TCRt
Analytical (W/m2.K)-1 W(%) TCRe
2.4 2.1x10⁻³ 1.6x10⁻³ 7.6
4.7 2x10⁻³ 1.53x10⁻³ 8
7.1 1.8x10⁻³ 1.46x10⁻³ 8.9
conductivity of wavy surface and As area of real
contact region. As is the summation of contacts
areas. So:
2
s
n
.
c
A
=
π
(17)With assumption of sinusoidal surface, equation (17) can be written in the following terms:
2
s
2
l
.
c
w
l
2
a
A
=
×
π
(18)According Figure 1 a and w are apparent length and apparent width of contact region, 2l is wavelength of the sinusoidal surface unevenness. Knowing that apparent contact region is Aa = a×w,
equation (18) will convert to:
a 2
2
s
4
l
A
c
A
=
π
(19)Considering equations (15), (16) and (19), the thermal contact resistance of real contact area can be calculated.
TABLE 4. Analytical and Experimental Results of Thermal Contact Resistance – Glass and Alumina.
p (bar)
TCRe
Experimental (W/m2.K)-1
TCRt
Analytical (W/m2.K)-1
WTCRe
(%)
2.4 2.3x10⁻³ 1.67x10⁻³ 6.9
4.7 2.2x10⁻³ 1.65x10⁻³ 7.7
7.1 2.1x10⁻³ 1.64x10⁻³ 8.1
9.5 2x10⁻³ 1.63x10⁻³ 8.5
TABLE 5. Analytical and Experimental Results of Thermal Contact Resistance – Carbon and Alumina.
p (bar)
TCRe
Experimental (W/m2.K)-1
TCRt
Analytical (W/m2.K)-1
WTCRe
(%)
2.6 4x10⁻³ 2.9x10⁻³ 2.1
5.2 3.3x10⁻³ 2.6x10⁻³ 2.4
7.9 3x10⁻³ 2.3x10⁻³ 2.6
10.5 2.7x10⁻³ 2.1x10⁻³ 2.8
TABLE 6. Analytical and Experimental Results of Thermal Contact Resistance – Alumina and Carbon.
p (bar)
TCRe
Experimental (W/m2.K)-1
TCRt
Analytical (W/m2.K)-1 W(%) TCRe
2.6 4.5x10⁻³ 3.2x10⁻³ 2
5.2 4.3x10⁻³ 3.1x10⁻³ 2.1
7.9 4.1x10⁻³ 3x10⁻³ 2.2
4. COMPARISON OF EXPERIMENTAL AND ANALYSIS RESULTS
In this section, the experimental and analysis results have been compared. Three types of isolators used for experiments are:
• Carbonic isolators
• Glass isolators
• Alumina
Combining these three types with changing order of location, six types of experiment were done. Each combination was tested under 4 applied forces. The experimental results and uncertainty of experiments are presented in the tables below. Analytically calculated thermal contact resistance in terms of applied force is shown in these tables, too.
It may be noted that there are two extra contacts on one side of any test specimen in the test device. So these two contacts increase the thermal contact resistance obtained by experiments. This is the most important reason of the difference between analyses and experiments.
5. THE EFFECT SIZES OF UNCERTAINTY PARAMETERS
5.1
Carbon-Carbon, Carbon-Alumina and
Alumina-Carbon Experiments The effect
sizes of uncertainty parameters in these experiments are as follows:1- uncertainty in measuring area of test specimens
2- uncertainty in measuring heat flux
3- uncertainty in measuring thickness of alumina test specimens
4- uncertainty in measuring thickness of carbon test specimens
5- uncertainty in measuring temperature drop
5.2 .
Glass-Alumina, Alumina-Glass and
Carbon-Glass Experiments The effect sizes
of uncertainty parameters in these experiments are as follows:1- uncertainty in measuring thickness of glass test
specimens
2- uncertainty in measuring area of test specimens
3- uncertainty in measuring heat flux
4- uncertainty in measuring thickness of alumina and carbon test specimens
5- uncertainty in measuring temperature drop
It can be seen that difference between part A and B is the importance of measuring glass test specimens thickness. Because of very lower thermal conductivity of glass specimens, the effect of glass thickness is very effective on uncertainty.
6. CONCLUSIONS
In this paper, the method of calculating thermal contact resistance of wavy surfaces is discussed completely. The results of experiments and analysis had good agreement with each other. For determining the thermal contact resistance of real contacts, a new method had been introduced. In this method some assumptions had been used. Changing these assumptions into more real conditions, one may obtain some better results. There is an interesting result obtained from the analysis: the extent of contact depends on the direction of heat flux and materials of the surfaces. Therefor, thermal contact conductance of wavy surfaces depends on the order of surface location. This point is seen in the experiments’ results too. At last, it may be noted that by knowing thermal contact resistance, exact determination of total conductivity of multi-layer isolators will be available.
NOMENCLATURES
Symbols
:A Area,m2
a Apparent length of contact region,m b Height of unevenness of a surface, m c Half of the real contact spot length, m G Shear modulus, GPa
l Half of the sinusoidal surface unevenness wavelength,m
n Number of contact areas
P Applied force per unit length,N/m p Pressure, N/m2
q Heat flux, W/m2
qn Local heat flux, W/m2
Rs Thermal contact resistance of real contact
region, m2K/W
TCR Thermal contact resistance, m2K/W
W Uncertainty, %
w Apparent width of contact region,m y The sinusoidal surface profile
Greek Alphabets
:α Thermal expansion coefficient, 1/K
δ Thermal distortivity
ν Poisson’s ratio
ρ Surface curvature, 1/m
Subscripts
:1. Body no.1 2. Body no.2 a Apparent e Experimental
t Thermal, Theoretical
7. APENDIX
6.1. Practical Experiments Performed Six
different types of experiments were designed by arranging a 2×2 combination of the three insulation materials under study. A seventh experiment was also designed by placing two identical layers of carbon insulator.When two glass or fibrous Alumina insulators were placed in the test unit, due to high insulating properties of these materials the temperature rose considerably high beyond the working range of the thermocouples. Therefore, it was impossible to run these two types of experiment.
Overall, 7 different combinations of the insulating materials were tested. Each combination was tested under 4 different compression forces in order to be able to plot the heat resistance variations of the contact
surface in terms of the load exerted. To ensure that the test results were accurate, each test was run at least twice. In cases where test results showed great differences, the whole test set was repeated to ensure unrealistically large values are not included in the averages. The principle underlying the test unit was the same as that in units used to measure convection heat coefficient for different materials. The unit is made up of two major parts (detail explanation of unit is shown on the Figure 3).
An electric resistance is used to create a thermal flux on one end of the test specimen while circulating water absorbs the thermal flux on the other. This helps the thermal distribution to reach its stable conditions faster. The thermocouples interposed along the unit are used to obtain the thermal distribution in the test specimen and, thus, to compute the convection heat coefficient of the specimen by measuring the thermal flux passing through it. However, as our goal in these experiments was to obtain the heat resistance of the contact surface, the 7 combinations were subjected to the tests. If the values for heat convection coefficients of each of the two constituents are given, the difference between heat convection coefficients can then be computed both in the presence of the contact surface resistance and in the absence of this phenomenon. The difference thus computed is, in fact, the objective of this study, i.e., the heat resistance of the contact surface between two objects. In other words, for each of the combinations set up in this study, the following relation holds:
R = R1 + Rc + R2 (1)
where R is the overall heat resistance of each combination, R1 and R2 are the heat resistances of
insulators 1 and 2, respectively, and Rc is the heat
resistance of the contact surface in each combination. The values for R1 and R2 can be
R = A.∆T/Q (2)
where A is the area of the specimen, ∆T is temperature difference, and Q is thermal flux passing through the specimen. Finally, the value for the surface contact heat resistance, Rc, can be
computed from relations (1) and (2).
6. REFERENCES
1. Saboonchi, A., and Mousavy, Z. M., “An Analysis of Thermal Contact Resistance Theories”, Proceeding of the 1st Scientific-Application Aerospace Organization Conference, Tehran, Vol. 8, No. 1, (September 2000),
241-252.
2. Mousavy, Z. M., “Thermal Contact Resistance of Wavy Surfaces”, MS Thesis, Isfahan University of Technology, (2001).
3. Song, S., Yovanovich, M. M., and Goodman, F. O., “Thermal Gap Conductance of Conforming Surfaces in Contact”, Journal of Heat Transfer, Vol. 115, (1993) 533-540.
4. Incropra, F. P. and Dewitt, D. P., “Introduction to Heat Transfer”, Library of Congress Cataloging in Publication Data, 2nd Edition, (1990).
5. Yovanovich, M. M., De Vall, J. and Hegazy, A., “A Statistical Model to Predict Thermal Gap Conductance between Conforming Rough Surfaces”, AIAA-82-0888, (1982).
6. Mikic, B., “Thermal Constriction Resistance due to Uniform Surface Conditions; Contact Resistance at Non-Uniform Interface Pressure”, Int. J. Heat Mass Transfer,
Vol. 13, (1970), 1497-1500.
7. Greenwood, J. A., “Constriction Resistance and the Real Area in Contact”, Br.J. Appl. Physics, Vol. 17, (1966),
1621-1632.
8. Timoshenko, S., “Theory of Elasticity”, McGraw-Hill Book Co., New York, Third Edition, (1970).
9. Taein, Y. and Barber, J. R., “Stability of a Semi-Infinite Strip in Thermoelastic Contact with a Rigid Wall”, Int. J. Solids Structures, Vol. 32, No. 3/4, (1995), 553-567.
1. Holder plates 2. Guides
3. System heat insulator 4. Thermocouples 5. Electrical heater 6. The first test specimen 7. The second test specimen 8. Cooling coil 9. Load cell
10.
The specimens contact region