Analysis of threshed rice mixture separation through vibration
screen using discrete element method
Li Hua
1,
Wang Jinshuang
2,
Yuan Jianbo
3,
Yin Wenqing
1*,
Wang Zhiming
2,
Qian Youzhang
1(1. College of Engineering, Nanjing Agricultural University, Nanjing 210095, China;
2. Jinhua Vocational Technical College, Jinhua 321000, Zhejiang, China; 3. Nanjing Tech University, Nanjing 210093, China)
Abstract: The discrete element method was utilized to construct three-dimensional discrete element models for the rice mixture, and their motions were analyzed numerically on a planar vibration screening device. The results showed that, after falling onto the vibrating screen surface, the mixture undergoes a reciprocating motion within the same cycle. During the screening process, the mixture undergoes segregation, slides along the screen surface, passes through the screen and then falls. In comparing the movement of grains and shriveled grains, it can be seen that the velocity of shriveled grains experiences cyclical changes, which is consistent with the grains’ motion cycle. The impact on grains is shown to be greater than that on shriveled grains, and the average speeds of shriveled grains and grains converge. The curve shows that the screening of repetitive movements has a significant effect on the average velocity of shriveled grains, but also the velocity of shriveled grains and the vibration parameters can be well represented by a fitting equation. It is beneficial for the separation of grains from shriveled grains to choose a greater vibration frequency and screen surface inclination in the range of commonly used.
Keywords: rice mixture separation, vibration screen, discrete element method, numerical computation, mechanism
DOI: 10.25165/j.ijabe.20171006.2910
Citation: Li H, Wang J S, Yuan J B, Yin W Q, Wang Z M, Qian Y Z. Analysis of threshed rice mixture separation through vibration screen using discrete element method. Int J Agric & Biol Eng, 2017; 10(6): 231–239.
1 Introduction
China is the world’s largest rice producing country,
and the rice harvest is highly dependent on the efficiency
of the harvester for simultaneously completing the cutting,
Received date: 2016-10-10 Accepted date: 2017-01-26
Biographies: Li Hua, PhD, Professor, research focuses on agricultural mechanization and biomass energy, Email: [email protected]; Wang Jinshuang, Master, Associate Professor, research focuses on agricultural harvesting equipment, Email: [email protected]; Yuan Jianbo, Master student, research focuses on modern agricultural machinery equipment, Email: [email protected]; Wang Zhiming, PhD, Associate Professor, research focuses on modern agricultural machinery equipment, Email: [email protected]; Qian Youzhang, Master, research focuses on modern agricultural machinery equipment, Email: [email protected].
*Corresponding author: Yin Wenqing, PhD, Professor, research focuses on agricultural mechanization and automation. College of Engineering, Nanjing Agricultural University, No. 40, Dianjiangtai Road, Pukou Nanjing 210095, Jiangsu, China. Tel: +86- 13851938631, Fax:+86-25-58606699, Email: [email protected].
threshing, cleaning and separation work during harvest.
A plane vibratory screening device is an important
component of the modern combine harvester and has a
significant influence on the separation performance.
The screening process of the threshed mixture (which
contains short straws, grains, shriveledgrains and crushed
leaves) is a multiple stochastic discrete process. Relying
on the powerful computing capabilities of modern
computers, the microscopic behavior of screening as well
as the screening mechanism can be explored based on the
discrete element method (DEM). This process has
attracted much research attention.
Cleary and Sawley[1,2] used the discrete element
method and a three-dimensional (3D) spherical model to
conduct a DEM simulation of the particle mixing as well
as the screening process on a screen surface in the vertical
vibration direction. They analyzed the screening
and found that DEM can be used as an auxiliary design
tool for screening equipment. Furthermore, Li et al.[3,4]
applied the two-dimensional circular DEM model and
utilized a stationary tilting screen surface to simulate the
screening process of the granular assembly of the
different binary grain sizes, and examine the movement
process and separation mechanism of particle groups on
the plane sieve for discussing the impact of various
factors on screening efficiency. Using the 3D discrete
element method, Chen and Tong[5] simulated the collision
of particles on the vibrating surface in screening process
and examined the effects of vibration frequency and
screen surface length on the screening efficiency. Jiao
et al.[6] set up a DEM screening system using VC+ and
achieved a dynamic simulation of vibration screening. Wiącek[7]
determined influences of the particle shape and
friction on the mechanical response of a granular
assembly in a uniaxial compression through DEM
simulations and laboratory experiments with pea bean
seeds. Zhao et al.[8,9] used DEM to conduct a 3D
simulation on the vibratory screening process of minerals
to explore the ore screening mechanism and study the
influence of vibratory screen motion parameters on
screening efficiency. Jiao and Zhao[10] used the DEM
method to conduct a numerical calculation and simulation
on the vibratory screening of rice and brown rice, and
compared with the experimental results which
demonstrated that the numerical computation was feasible.
Lenaerts et al.[11] introduced modified DEM for better
fitting simulations of the grain-straw separation, which is
one of the most critical processes in combine harvesters.
Among studies involving numerical simulations of
grain screening, many scholars overlooked the effect that
particle shape can have on screening. In such studies, a
spherical particle model is typically adopted, which exists
a significant difference in actual situations on the ratio of the mixture’s different components and the screen surface size parameters. In fact, minimal research has been
conducted on comparing the movement patterns of
different components in the screening process, and there
is little in-depth study on the movement of the granular
assembly and the screening mechanism.
In this paper, the screening process of the grain
mixture on the vibratory sieve was reproduced through
numerical calculations of different components on the
sieve using the soft ball model of 3D discrete element
Through simulation experiments, the average impact and
the average velocity of grains and shriveled grains during
screening was studied to reveal their movement patterns
on the screen surface and vibration screening mechanism.
2 Multi-component discrete element model
and simulation parameters
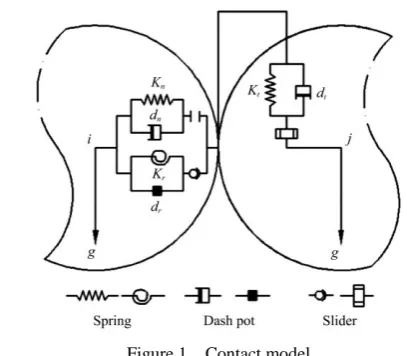
2.1 Discrete element contact mechanics model
The soft ball contact model by modified discrete
element method (MDEM) was adopted as shown in
Figure 1.
Figure 1 Contact model
In Figure 1, Kn, Kt and Kr are normal stiffness,
tangential stiffness and roll stiffness, respectively, while
dn, dt and dr are the damping for normal stiffness,
tangential stiffness and roll stiffness, respectively.
Particles are subject to gravity in addition to the normal
and tangential contact force between particles.
Furthermore, they are also subject to the moment caused
by the tangential force as well as the rolling friction
moment. Therefore, the motion[12] of the ith particles can
be expressed by the following two equations:
, ,
1( )
i n i
i i j n ij t ij dV
m m g F F
dt
(1), ,
1( )
i n i
i j t ij r ij d
I T T
dt
(2)
where, mi is the mass of the particle i; Ii is the moment of
inertia of the particle i; ni is the total number of particles
that have contact with the particle i; g is the gravitational
the time step; and ωi is the angular velocity of the particle
i. The normal force Fn,ij, the tangential force Ft,ij, the
rolling friction torque Tr,ij, and the tangential torque Tt,ij
can be obtained by using the basic Newtonian mechanics
formula[8]. Each individual particle simultaneously
moves and rolls under the action of the above forces and
moments.
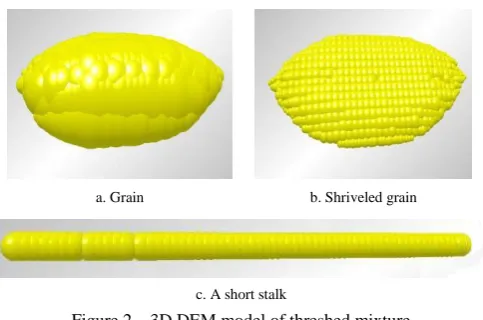
2.2 3D discrete element model for threshed grain
mixture
In the previous study, the research team constructed a
3D CAD model of a threshed grain mixture[13]. As a
result, the bonded particle method[14,15] was used in this
study to represent the non-spherical shape of three kinds
of extractions with multiple spheres adhered together.
The physical properties of the adhered spheres were the
same as the corresponding mixture. Relying on this
method, a 3D discrete element model of the rice grain
mixture was constructed as shown in Figure 2.
a. Grain b. Shriveled grain
c. A short stalk
Figure 2 3D DEM model of threshed mixture
2.3 Model of vibrating screen
Louver sieves are usually applied to the screening
systems of small combined harvesters. Because of the
sieve’s reciprocating motion and wind force, the threshed
mixture grains can be separated when they fall onto the
screening surface. In order to save computation time,
some parts not in contact with the grains were removed.
The simplified vibrating screen is shown in Figure 3.
Additionally, the fish scale of chaffer opening is 20°, the
size of fish scale is 8 mm×8 mm, the length of the sifter is
1000 mm and the width of the sifter is 300 mm.
Figure 3 Simplified vibrating screen
2.4 Simulation software and simulation
The discrete element analysis tool from EDEM2.3
was used for the simulation. In the simulation, since the
sifter is a moving part, it was set to perform a linear back
and forth motion[16]. In the particle mixture used for the
simulation, the ratio of grains, shriveled grains and short
stalks produced per second was assumed to be
793:205:2[17], and the step length was 0.02 s. The
components and physical parameters of the granular
material were set as shown in Table 1, and the physical
parameters for the interactions between particles are
shown in Table 2[18,19].
Table 1 Physical parameters of granular materials
Material Density/kg·m-3 Shear modulus/Pa Poisson’s ratio
Steel 7850 1×10¹⁰ 0.30
Grain 1280 2.1×10⁵ 0.25
Short stalk 160 4.4×10³ 0.45
Shriveled grain 190 2.0×10⁵ 0.35
Table 2 Physical parameters of particle interactions
Coefficient of rolling friction
Coefficient of static friction
Coefficient of restitution
Grain–grain 0.25 0.75 0.43
Grain–stalk 0.17 0.50 0.36
Grain–shriveled grain 0.28 0.84 0.42
Grain–steel 0.12 0.35 0.45
Shriveled–shriveled grain 0.31 0.93 0.38
Shriveled–steel 0.18 0.53 0.39
Shriveled–stalk 0.24 0.77 0.31
Stalk–stalk 0.15 0.46 0.22
Stalk–steel 0.10 0.26 0.29
2.5 Experimental design
In order to study the screening mechanism of the
granular assembly under different vibration parameters,
an experiment focused on numerical simulations under
examining single parameter based upon the sieve’s
motion parameters during vibratory screening. As
shown in Table 3, four levels were set for each of the
parameters, and numerical calculations were made using
various combinations.
Table 3 Grouped experiments examining single parameters
Experiment No. Factor Level Conditions
1-4 Amplitude/mm 20, 25, 30, 35 α=4°, f=4 Hz 5-8 Frequency/Hz 3, 4, 5, 6 α=4°, A=25 mm 8-12 Sieve surface
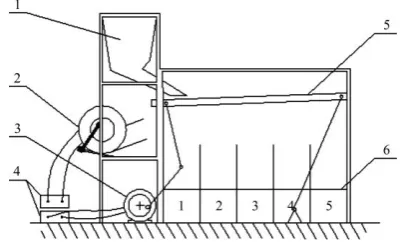
3 Experiment verification
3.1 Cleaning testing platform
The experimental platform is shown in Figure 4.
The vibration sieve was driven by the electromotor and
its speed was controlled by the converter. When the
threshed mixture grain fell onto the screening room, the
mixture grain could be separated by the combined action
of the wind force and the vibration force. The speed of
the fan could also be changed by another converter. In
order to analyze the distribution of undersized grain, the
flow board was set up, and the undersized grain could
therefore fall into five sample boxes.
1. Hopper 2. Fan 3. Electro motor 4. Converter 5. Vibration sieve 6. Sample box
Figure 4 Cleaning device
3.2 Test methods
To conduct quantitative analysis assessing the
accuracy of the DEM simulation, using the same
parameters, undersized material was collected along the
length of the vibrating screen and its distribution could be
examined. Comparing values obtained from the DEM
simulation analysis, the accuracy of the simulation was
verified. The following parameters were set: amplitude,
25 mm; screen surface inclination, 4°; and frequency,
4 Hz. The software EDEM 2.3 was used to simulate and
calculate the weight percentage of different areas. After
each test was finished, the undersized material in the five
sampling boxes (from front to back, No. 1-5) was
respectively weighed and then the weight percentage of
each sample box could be calculated. The test was
repeated seven times and the average of percentages
could be deduced.
3.3 Resultsanalysis
Experimental data and values obtained the DEM
simulations are shown in Figure 5. As shown in Table 4,
the mean difference was smaller for the two groups.
According to the t-test critical value table (Critical
confidence level), t(4,0.05)=2.78, calculated value t=
0.0073<2.78, showed that the difference between the data
of the two groups was smaller at a 0.05 significance level
and the correlation coefficient of the paired sample was
0.9867. The data from the two groups were highly
correlated. Thus, the DEM model and simulation
parameters were confirmed as valid for further
simulations.
Figure 5 DEM simulation and experimental values
Table 4 Data variance analysis of the two groups
Mean difference
Standard
deviation Standard error p t df
0.0161 4.9132 2.1972 0.0073 4 0.9945
Note: Correlation coefficient of paired sample: 0.9867, 95% confidence interval: 6.1166-6.0864.
4 Results and analysis
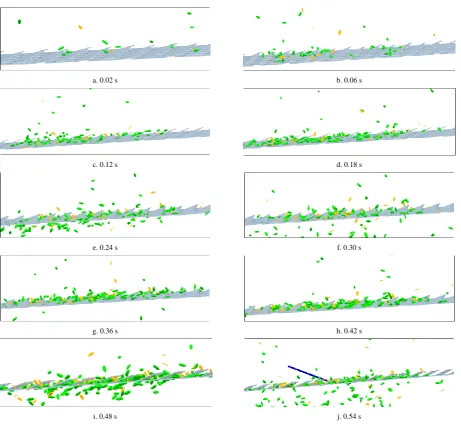
4.1 Simulations and analysis
Figure 6 presents the simulation results of the
threshed mixture screened on the planar sieve over 0.6 s
using the following parameters: amplitude, 25 mm;
screen surface inclination, 4°; and frequency, 4 Hz. In
order to allow for clear observation, the grains, shriveled
grains and short stalks were respectively designated as
green, yellow and blue.
Figure 6 indicates that the grain mixture entered the
planar vibratory screening device at the initial velocity.
Then, due to gravity, the mixture fell onto the screen
surface. When the vibrating sieve motion reached 1/2
cycle, the mixture gradually accumulated on the screen
surface. Under the sieve’s vibration force, the mixture
shook and segregated as well as slid to one side due to the
pushing effect of the screen surface. When the vibrating
making contact with the screen surface, and the smaller
particles could be sieved through so as to produce
parabolic movement. Because their size made it
difficult for short stalks to pass through the sieve, they
remained on the screen surface. In fact, the only means
of separating them from the other particles was by
pushing them to the rear of the sieve under the sieve’s
pushing effect. During the screening process, no
significant difference could be observed between the
movement of the grains and that of the shriveled grains.
a. 0.02 s b. 0.06 s
c. 0.12 s d. 0.18 s
e. 0.24 s f. 0.30 s
g. 0.36 s h. 0.42 s
i. 0.48 s j. 0.54 s
Figure 6 Simulation of vibrating screening
4.2 Particle mixture motion analysis
Figure 7 shows the detail of changes in the average
impact and velocity of the grains and shriveled grains at
an instance during the screening process using the
following parameters: amplitude, 25 mm; inclination, 4°;
and frequency, 4 Hz.
Figures 7 and 8 indicate that, after the grains and
shriveled grains fell onto the screen surface, their average
impact and speed periodically varied, but the cycle was
consistent. Compared to the shriveled grains, the grains
demonstrated a far greater average impact, and their
average speed was slightly less during the screening
process. The mechanism could be interpreted as
follows: due to their physical properties, the grains made
greater impact during the screening motion, but because
of their relatively large mass, acceleration was relatively
small, and their average velocity during motion was
slightly less than that of the shriveled grains.
Furthermore, as the average instantaneous speeds of the
grains and shriveled grains were similar during motion, it
was difficult to effectively separate the grains from the
shriveled grains by only using the separation functions of
Figure 7 Change of average impact on particles
Figure 8 Change of average speed of particles
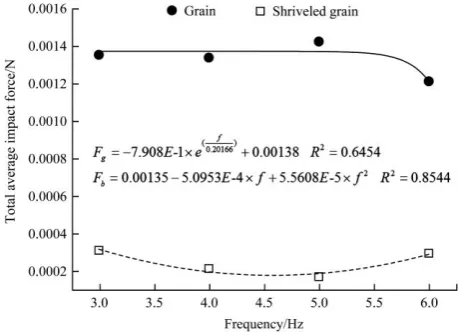
4.3 Effect of vibration parameters on average
impact of particle mixture
For a more intuitive analysis of the effects of various
factors on the average impact of the particle mixture, the
results obtained from numerical calculations were further
analyzed in order to identify any patterns, as shown in
Figures 9-11.
Under the same conditions, the grains made a greater
impact than did the shriveled grains. When the
amplitude was increased, the impact exhibited a declining
tendency because the greater distance the particles were
pushed along the screen surface during a cycle, the
smaller the change in the interaction force between the
particles, and the smaller the total force. Furthermore,
when the frequency was changed from 3 Hz to 5 Hz, and
the screen surface inclination was changed from 3° to 5°,
the change in the average impact grains made was small,
thus indicating that a smaller vibration frequency and
screen surface inclination slightly affected the external
force that the grains were subjected. However, when the
frequency was increased to 6 Hz, the average impact on
the grains was reduced; thus, this indicated that with a
high frequency, the impact on the grains was offset when
the grains moved back and forth on the screen surface.
Furthermore, when the screen surface inclination was
increased by 6°, the average impact on the grains
significantly increased, thereby indicating that the total
impact on the grain mixture increased by a large margin
due to the influence of gravity at a greater tilting angle.
As for the shriveled grains, when the frequency was
highest (6 Hz) and smallest (3 Hz), the impact on them
was greater than it was when the frequency was 4 Hz and
5 Hz. The underlying mechanism could be that the mass
of the shriveled grains was smaller, so when the vibration
frequency was both relatively high and low, a more
obvious increase in the interaction forces between the
particles could be observed. The screen surface
inclination had less impact on the shriveled grains, and
the mechanism here was related to their smaller mass as
well as the smaller effect that gravity had on the increased
impact they were subjected.
Figure 9 Average impacts on particles at different amplitudes
Figure 11 Average impacts on particles at different sieve angles The relationship between the R2 (Goodness of fit)
value based on the curve fitting and the impact on
shriveled grain (Fb) experienced by the shriveled grains
as well as various factors was significantly strong,
whereas the variation pattern of the impact on grains (Fg)
according to various factors was not as significant after
fitting.
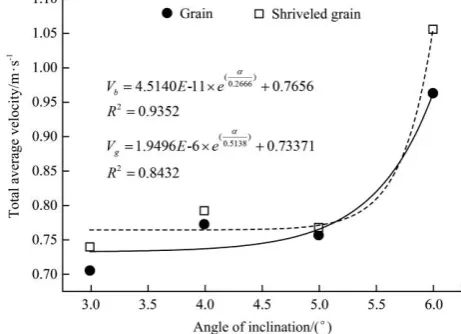
4.4 Impacts of various factors on average velocity of
particle mixture
After the numerical results were processed, the
variation pattern of the average velocity of the grains and
shriveled grains under varying factors was obtained and is
shown in Figures 12-14.
Figures 12-14 indicate that, under the same conditions,
the average velocity of the shriveled grains was higher
than that of the grains. At amplitudes of 20 mm and
30 mm, the average velocity of the particles was
relatively high. Furthermore, as the frequency and the
screen surface inclination increased, the average velocity
of the grains and shriveled grains also showed a tendency
to increase. This is because the shriveled grains had a
smaller mass and could accelerate faster in the course of
contact with the screen surface, and thus were faster than
the grains. At a greater frequency, the acceleration of
the back and forth motion of the screen surface increased,
the speed of the particles increased under the pushing
motion, and the overall speed increased. Be in a greater
screen inclination condition, the velocity showed an
increasing trend under the influence of gravity.
According to the R2 value of the curve fitting, the curve
equation reflecting the relationship between the shriveled
grains’ velocity (Vb) and the vibration parameters was
significantly stronger, and the curve equation
demonstrating the relationship between the velocity (Vg)
and the frequency of the grains and the screen surface
inclination was also quite significant, whereas the curve
equation between the grain velocity (Vg) and the
amplitude variation was of average significance.
Figure 12 Average velocity of particles at different amplitudes
Figure 13 Average velocity of particles at different frequencies
5 Conclusions
A 3D soft-sphere discrete element model was adopted
in this work to construct a 3D discrete element model for
each component of a threshed rice mixture. The
screening process was numerically calculated, and the
following conclusions could be made:
(1) The rice grain mixture 3D discrete element model,
which was developed in this study by using bonding
method, reproduced the screening process of
multi-component mixtures; a multi-component mixture
underwent a back and forth motion within a single cycle,
and the motions of the grains and shriveled grains were
found to be similar, but the short stalks were difficult to
sift.
(2) When being screened with the vibratory screen,
the impact that both the grains and shriveled grains was
subjected to and their velocity changed periodically.
The impact on the grains was much greater than it was on
the shriveled grains but, during the screening process, the velocity of the grains’ motion was less than that of the shriveled grains, with only a small difference existing
between them.
(3) The relationship between the average impact on
the particle flow and the average velocity and the
vibration parameters was analyzed, and curve fitting was
performed. The results revealed that the relationship
between the impact on the shriveled grains and their
average velocity and vibration parameters was
significantly strong. It is beneficial for the separation of
grains from shriveled grains when the frequency was set
as 6 Hz and the screen surface inclination was set as 6°.
Acknowledgement
This work was supported by the National Natural
Science Foundation of China (51305182) and the
Ministry of Agriculture Key Laboratory of Modern
Agricultural Equipment Grant (201303 003).
[References]
[1] Cleary P W, Sawley M L. DEM modelling of industrial granular flows: 3D case studies and the effect of particle shape on hopper discharge. Applied Mathematical
Modelling, 2002; 26(2): 89–111.
[2] Cleary P W. DEM simulation of industrial particle flows: Case studies of dragline excavators, mixing in tumblers and centrifugal mills. Powder Technology, 2000; 109(1–3): 83–104.
[3] Li J, Webb C, Pandiella S S, Campbell G M. Discrete particle motion on sieves—a numerical study using the DEM simulation. Powder Technology, 2003; 133(1-3): 190–202. [4] Li J, Wee C, Pandiella S S, Campbell G M. A numerical
simulation of separation of crop seeds by screening–effect of particle bed depth. Food and Bioproducts Processing, 2002; 2: 109–117.
[5] Chen Y H, Tong X. Application of the DEM to screening process: a 3D simulation. Mining Science and Technology, 2009; 19: 493–497.
[6] Jiao H G, Li J R, Zhao J F, Zhao Y M. Discussion on the calculation parameters of discrete element method. Journal of Henan Polytechnic University (Natural Science), 2007; 1: 88–93. (in Chinese)
[7] Wiącek J. Geometrical parameters of binary granular mixtures with size ratio and volume fraction: experiments and DEM simulations. Granular Matter, 2016; 18(3): 42. [8] Zhao Y M, Zhang S G, Jiao H G, Tie Z J. Simulation of
discrete element of particles motion on the vibration plane. China University of Mining & Technology, 2006; 35(5): 586–590. (in Chinese)
[9] Jiao H G, Zhao Y M. Screen simulation using a particle discrete element method. China University of Mining & Technology, 2007; 36(2): 232–236. (in Chinese)
[10] Jiao H G, Zhao Y M. Computer emulation of particle motion on the screen plate and its validation by test. Mining & Metallurgy, 2006; 15(1): 63–67. (in Chinese)
[11] Lenaerts B, Aertsen T, Tijskens E, de Ketelaere B, Ramon H, de Baerdemaeker J, et al. Simulation of grain–straw separation by Discrete Element Modeling with bendable straw particles. Computers and Electronics in Agriculture, 2014; 101: 24–33.
[12] Zhao L L, Liu C S, Yan J X, Jiang X W, Zhang Y. Numerical simulation of particle segregation behavior in different vibration modes. Acta. Phys. Sin., 2010; 59(04): 2582–2588. (in Chinese)
[13] Zhao L L, Liu C S, Yan J X, Jiang X W, Zhu Y. Numerical simulation on segregation process of particles using 3D discrete element method. Acta Phys Sin, 2010; 59(3): 1870–1877. (in Chinese)
[15] Zhao L L, Liu C S, Yan J X, Xu Z P. Numerical simulation of particles screening process based on 3D discrete element method. China Coal Society, 2010; 35(2): 307–311. (in Chinese)
[16] Oda M, Iwashita K, Kakiuchi T. Importance of particle rotation in the mechanics of granular materials. Powders & grains, 1997; 97: 207–210.
[17] Zhao Y Z, Jiang M Q, Xu P, Zheng J Y. Discrete element
simulation of the microscopic mechanical structure in sandpile. Acta Phys Sin, 2009; 58(03): 1819–1825. (in Chinese)
[18] Li H, Yin W Q, Gao X, Liu Y. Construction of three-dimensional model of grain based on reverse engineering. Nat. Sci. Ed., 2011; 39(12): 201–206. (in Chinese)