RESEARCH ARTICLE
A closer look at the items within three
measures of evolution acceptance: analysis
of the MATE, I-SEA, and GAENE as a single
corpus of items
William L. Romine
1*, Amber N. Todd
2and Emily M. Walter
3Abstract
Background: Current direct Likert measures for evolution acceptance include the MATE, GAENE, and I-SEA. Pros and cons of each of these instruments have been debated, and yet there is a dearth of research teasing out their similari-ties and differences when they are used together in a single context beyond the fact that their measures tend to be highly correlated. We administered these to 452 college students in non-major biology classes at two research-inten-sive universities from the Midwestern and Western United States to investigate the measurement properties of the items within these instruments when combined as a single corpus.
Results: Factor analysis using exploratory and confirmatory methods, and Rasch analyses, suggested that a two-dimensional factor structure best describes the corpus of items. Whether the item was positively or negatively worded was the key delimiter in its factor assignment. Examination of the highest loading items on the respective fac-tors indicates that the first factor measures acceptance of the truth of evolution and the second factor measures rejec-tion of incredible ideas about evolurejec-tion. The correlation of these two factors is 0.73, indicating that they share 53% of their variance with each other. When treated unidimensionally, eleven items exhibited potential misfit with the Rasch model. This number dropped to nine items when the two factors were considered. These items, and implications for future use of the MATE, GAENE, and I-SEA together, are discussed in detail.
Conclusions: This study is the first analysis of the MATE, GAENE, and I-SEA as a single corpus of items, and yet corrob-orates previous work showing that these instruments yield measures with highly similar quantitative interpretations. This study also corroborates the effect of negative item wording on how college students interpret the item. While this finding can be applied to college-level students taking undergraduate non-majors biology coursework, work with more advanced biology students has demonstrated that this apparent item wording effect tends to disappear as students advance and become more accepting of evolution. We conclude that despite apparent epistemological dif-ferences between the MATE, GAENE, and I-SEA, these can be treated as a single set of items measuring a single factor or two factors without significant loss of quantitative interpretability.
Keywords: Evolution, Acceptance, Measurement, Macroevolution, Microevolution, Human evolution, Exploratory factor analysis, Rasch analysis
© The Author(s) 2018. This article is distributed under the terms of the Creative Commons Attribution 4.0 International License (http://creat iveco mmons .org/licen ses/by/4.0/), which permits unrestricted use, distribution, and reproduction in any medium, provided you give appropriate credit to the original author(s) and the source, provide a link to the Creative Commons license, and indicate if changes were made.
Open Access
*Correspondence: [email protected]
1 Department of Biological Sciences, Wright State University, 3640 Colonel Glenn Hwy, Dayton, OH 45431, USA
Introduction
Darwin’s release of On the Origin of Species in 1859 sent a wave of disconcert which surged rapidly across the seas. According to a Pew Research Center survey reported in Masci (2017), only 62% of United States residents agree that humans have evolved over time, and only half of these state that evolution is the sole reason that humans change. These statistics are even more sobering in Latin America and the Middle East, where less than half of the current citizenry accepts evolution (Masci 2017). A 2008 report suggests that as few as 1 in 5 college students agree that humans evolve (Lovely and Kondrick 2008); indeed this nearly 160-year-old conflict has been a con-tinual bane of efforts to teach the biological sciences in an authentic, useful, and accurate way (Smith 2010). Despite a history of anti-evolutionist pressure from individual states (Lerner 2000), current K-16 standards both recog-nize and emphasize the importance of including evolu-tion as a foundaevolu-tional component of biology instrucevolu-tion (NGSS Lead States 2013; Brewer and Smith 2011).
Increasing evolution acceptance remains an important implicit target for biology instruction across the globe, now more than ever given recent empirical (Romine et al. 2016; Nadelson and Southerland 2010) and theo-retical (Deniz et al. 2008; Ha et al. 2012) work document-ing the marriage of evolution acceptance and content understanding. Indeed, evolution acceptance may be an important component of meeting the plausibility and fruitfulness conditions suggested by conceptual change theory (Strike and Posner 1992) required before students are willing to accept scientific ideas explaining how spe-cies change over time (Deniz et al. 2008). Interpretation of the moderate relationship between evolution knowl-edge and acceptance (Romine et al. 2016; Nadelson and Southerland 2010) through the lens of conceptual change theory suggests that evolution acceptance may serve as an important intermediary between biology instruc-tion and a student’s willingness to actually change his/ her ideas about evolution (Deniz et al. 2008). Putting a quantitative measure on evolution acceptance therefore becomes important toward facilitating understanding of how our instruction is impacting the way our students think about evolution.
This call to assess evolution acceptance has been addressed multiple times in the past two decades. Rut-ledge and Warden (1999) advanced the first effort to provide a valid quantitative measure for evolution acceptance—the Measure of Acceptance of the Theory of Evolution (MATE) (also described in Rutledge and Sadler
2007). Since its development, the MATE has been used extensively to measure evolution acceptance within a variety of instructional settings and populations includ-ing science teachers and students at academic levels
spanning from elementary to undergraduate (Romine et al. 2017). Through its usage, a number of limitations of the MATE have surfaced (for a detailed discussion, see Hogan 2000; Smith 2010; Smith et al. 2016; Wagler and Wagler 2013; Nadelson and Southerland 2012). Two recent evolution acceptance instruments, the Inventory of Student Evolution Acceptance (I-SEA) (Nadelson and Southerland 2012) and the Generalized Acceptance of Evolution Evaluation (GAENE) (Smith et al. 2016) were developed to provide measures that overcome key limita-tions of the way in which the MATE measures evolution acceptance, which include the lack of attention paid to the context of the evolutionary event and the conflation with evolution knowledge and religiosity.
Nadelson and Southerland (2012) developed the I-SEA to make measures of evolution acceptance more fine-grained, embracing the possibility that evolution accept-ance may comprise multiple related constructs which account for the specific type of evolution being consid-ered. The authors cite that micro- and macroevolution are viewed differently by students (Nehm and Ha 2011). Specifically, many who reject macroevolution may read-ily accept ideas about microevolution (Scott 2005), and further, even those who accept evolution over long time scales often believe that humans are exempt from the process of evolution (Gallup 2010).
Some items of the MATE involve context and others do not but the role of context in measurement of accept-ance was not carefully considered. Hence the I-SEA instrument puts forth a three-dimensional model where acceptance of evolution is assessed along three con-structs: (1) microevolution, (2) macroevolution, and (3) human evolution. In this article, we use the word “dimen-sion” to refer to a quantitative representation of a con-struct which accounts for the correlation between item responses (Kline 2014). In discussion of the methods and results, we will also use the term “factor”, which refers to an individual construct or dimension (Kline 2014). In the case of the I-SEA, Nadelson and Southerland (2012) use three dimensions to account for the relation-ships between the responses, whereas the MATE and the GAENE use a single dimension to account for the cor-relation between responses on their respective items. In the development of the GAENE, Smith et al. (2016) argue that conflation of acceptance with knowledge, belief, and religious connotation limits the content validity of the MATE, thereby limiting our ability to use the MATE as a valid measure of evolution acceptance. Smith and col-leagues henceforth developed set of items which are worded in such a way that they avoid these confounding factors.
frameworks underlying their development have clear qualitative differences. This said, it is difficult to over-look the similarity in structure of the MATE, I-SEA, and GAENE, namely that they comprise Likert items asking participants the extent to which they agree or disagree with a statement about evolution. A recent study was undertaken to tease out differences between the MATE and the GAENE within an undergraduate health sciences context (Metzger et al. 2018). Metzger and colleagues found that, while the GAENE shows better fit statistics than the MATE within a confirmatory factor analysis model, the reliability of both instruments is high (r > 0.9 when treated unidimensionally), and agreement between unidimensional MATE and GAENE measures (disattenu-ated r = 0.9) is high enough to justify that both instru-ments may generate similar quantitative conclusions within the same study. Can this be taken to imply that measures generated by the MATE, GAENE, and I-SEA actually harbor a similar quantitative interpretation? To what extent can the MATE, I-SEA, and GAENE be used interchangeably as a single corpus of items? In this study, we address these overarching questions. To follow, we provide a review of current evolution acceptance instru-mentation, how these measures fit into current theoreti-cal frameworks around evolution acceptance, and then proceed to discuss our research questions.
Validated measures of evolution acceptance
Both qualitative and quantitative methods have been utilized to understand evolution acceptance. Qualitative methods include open response (Nehm and Schonfeld
2007; Robbins and Roy 2007) and interview protocols (Donnelly et al. 2009; Nehm and Reilly 2007). In this study, we focus on quantitative measurement of evolu-tion acceptance, which has been pursued with significant interest for over two decades. Johnson and Peeples (1987) represented one of the first attempts to measure evolu-tion acceptance using a survey with documented psycho-metric information. Just over a decade later, the Measure of Acceptance of the Theory of Evolution (MATE) was developed (Rutledge and Warden 1999).
The MATE contains 20 total items—10 positively-worded and 10 negatively-positively-worded—which focus pri-marily on acceptance of evolution over long time scales including common ancestry and human evolution. The MATE has been both utilized and criticized extensively since its development (for a review, see Romine et al.
2017). The MATE has been used as a unidimensional
measure throughout its history. By “unidimensional”, we are referring to the idea that a single measure or score is sufficient to describe the relationships between stu-dents’ responses (Kline 2014). This statistical argument is extended to the qualitative interpretation that the
MATE measures acceptance of evolution as a single con-struct. Wagler and Wagler (2013) provided evidence that the MATE is not unidimensional, and further exhibits dynamic dimensionality across different groups, mean-ing that the MATE measures different constructs within different populations. Using Rasch analysis, Romine et al. (2017) corroborated the claim of multidimensionality in a sample consisting primarily of science non-majors, find-ing that the MATE works better as a two-dimensional instrument. This means that two scores or measures are needed to capture the relationships between under-graduate students’ responses on the items. In Romine and colleagues’ study, the MATE was found to measure the following constructs: (1) acceptance of facts and (2) acceptance of credibility of statements related to evolu-tion. This dimensionality was delineated by whether or not the items were negatively worded.
The Inventory of Student Evolution Acceptance (I-SEA) and the Evolution Attitudes and Literacy Survey (EALS) are also constructed multidimensionally, meaning that multiple quantitative measures are used to account for students’ observed responses (Kline 2014). The I-SEA
(Nadelson and Southerland 2012) was designed to
improve on the MATE by disentangling microevolution, macroevolution, and human evolution contexts. This is an important contribution given that microevolutionary events may be easier for students to accept than those related to macro- and human evolution (Alters and Alters
2001; Scott 2005). Given these goals, the I-SEA consists of 24 total items, 9 of which are negatively worded, with 8 items assigned to one of three subscales for constructs defining acceptance of microevolution, macroevolu-tion, and human evolumacroevolu-tion, respectively. The authors hypothesized that the items related to acceptance of microevolution would be easier than the items measur-ing acceptance of macroevolution and human evolution, and their analysis bears this out (Nadelson and Souther-land 2012). Here, it may be useful to draw a distinction between Nadelson and Southerland’s (2012) decision to use 3 dimensions to explain the differences in items, including their difficulty, versus letting the items take a difficulty hierarchy along a single dimension as is often done in Rasch studies (Boone et al. 2013). Nadelson and Southerland show that the 3-dimensional model explains students’ responses adequately; however, the efficacy of the comparatively parsimonious approach of defining the items hierarchically along a single unidimensional Rasch scale remains unexplored.
conservativism, knowledge, misconceptions, and expo-sure to evolution (Hawley et al. 2011). Given the length of the EALS, a study to shorten it was undertaken, and a short form (EALS-SF) was thereby developed which the authors claim retains the psychometric integrity of the original (Short and Hawley 2012). The approach taken by the EALS contrasts with other existing instruments which ask students about their acceptance of evolution directly.
The Generalized Acceptance of Evolution Evaluation (GAENE) is the most recent development in the line of evolution acceptance instrumentation. It is claimed to measure evolution acceptance unidimensionally with-out the potential confounds with knowledge of evolution and religion (Smith et al. 2016). The GAENE consists of 13 items, all of which are positively-worded. Unlike the MATE and the I-SEA, the items on the GAENE have less focus on specific evolutionary contexts. Rather, the items tend to provide more general opinion-related statements including whether one accepts that there is evidence for evolution, whether evolution is important in the study of biology, and whether one is willing to advocate for evo-lution. Like the MATE, the GAENE has been validated using Rasch methods.
Lack of alignment with theoretical understanding of evolution acceptance
Although current evolution acceptance instruments gen-erate measures which have shown to be useful within specific research studies, we find that these instruments do not address adequately current theoretical perspec-tives around evolution acceptance. The model put forth by Deniz et al. (2008) considers evolution thinking in terms of cognitive, affective, and contextual domains. Their model conceptualizes evolution acceptance as a product of both cognition and affect around the theory of evolution. While the model of Deniz et al. (2008) focuses on evolution thinking in general, the model of Ha et al. (2012) has a more constrained focus on evolution accept-ance specifically, suggesting that this is mediated through both conscious and unconscious pathways. Foremost, people will make a conscious decision on whether or not they accept evolution through their understanding of evolution and their reasoning around what they perceive as evidence for or against evolution. Indeed, facilitation of conscious experiences is an important focus of evi-dence-based pedagogies focused on evolution (Romine and Todd 2017; Beard et al. 2014). Ha et al. (2012) further propose that these conscious experiences will merge with past experiences, values, and social interactions to gener-ate unconscious feelings which manifest as an underlying feeling of certainty.
Significant work has been done towards exploring the relationship between knowledge of evolution and accept-ance of evolutionary theory (Nadelson and Southerland
2010; Romine et al. 2017). However, it is currently diffi-cult to tease out how much of this relationship is due to the fact that evolution acceptance as it is currently being measured reflects knowledge of evolution. The MATE has been criticized on the grounds that it possibly con-flates knowledge of evolution with acceptance of evolu-tionary theory (Hogan 2000; Smith 2010; Wagler and Wagler 2013), and both the MATE and the I-SEA are criticized on the grounds that they are not tied to a theo-retical foundation for evolution acceptance (Smith et al.
2016).
Purpose of the Research
What all of these instruments have in common is that they give the student a statement, and then ask for an indication of agreement or disagreement with that state-ment via a Likert scale. It is clear that these instrustate-ments have important qualitative differences; for example, the MATE and GAENE do not have the focus on microevo-lution which is seen in the I-SEA. It can also be argued that the GAENE is more context-independent than the MATE and I-SEA. However, even a cursory inspection of these instruments reveals that their item stems are quite similar in their wording and/or get at acceptance in a similar way. For example, the GAENE asks for agree-ment with: “Evolution is a scientific fact”. The MATE asks for agreement with: “Evolution is not a scientifically valid theory”. As another example, the I-SEA asks: “Species exist today on the same form that they always have”, while the MATE asks: “Humans exist today in the same form that they always have”. While not all of the items bear this level of similarity, one can reasonably posit that a person agreeing with one statement will tend to agree with other related statements in the corpus regardless of the instru-ment on which these stateinstru-ments appear. However, this needs to be tested, and hence raises two potential lines of inquiry: (1) do the MATE, I-SEA, and GAENE get at a similar construct, and (2) how are the items on these instruments similar or different in how they measure evolution acceptance? We explore these lines of inquiry through three questions:
1. What is the dimensionality of the corpus of items provided by the MATE, I-SEA, and GAENE, and how can the dimension(s) be interpreted?
3. What do these instruments together tell us about the construct of evolution acceptance as it is currently being measured?
Methods Context
We administered the MATE, I-SEA, and GAENE 2.1, to 452 college students taking introductory biology classes at two doctoral universities with moderate research activ-ity using an IRB-approved protocol. Of these students, 354 hailed from a university in the Midwestern United States, and 98 were attending a university in the West-ern United States. One hundred fifty-two students (34%) reported male gender, and 273 (60%) reported female. Two hundred sixty-nine students (60%) reported White ethnicity. However, other ethnicities were reported, including Black (52, 12%), Hispanic (53, 12%), and Asian (29, 7%). Eight students (2%) reported indigenous Ameri-can heritage, and 25 students (6%) reported other eth-nicities not included in the survey. We finally inquired into students’ religious preferences. Two hundred ninety-eight students (66%) reported Christian faith. Agnostic (28, 6%) and Atheist (23, 5%) preferences were reported by 51 students. Eighteen students (4%) reported Islamic faith, 8 (2%) were Buddhist, and 3 (1%) where Hindu. The remainder reported other faiths, or chose not to report.
Factor analysis
We used exploratory factor analysis (EFA) in SPSS 21.0 to reconcile how the items on these three instruments define latent dimensions related to evolution acceptance, and then followed Nadelson and Southerland (2012) in proceeding to use confirmatory factor analysis (CFA) to evaluate how well the hypothesized factor solution derived from EFA reproduces the relationships between the item responses. While the dimensionality of these individual instruments has been discussed and explored in previous work, we initially took the position in this study that we did not know the dimensionality of this collection of items when they are administered together, thereby warranting an a posteori approach for exploring dimensionality. This can be contrasted with the a priori, or hypothesis-driven, approach that involves study of the items through a pre-specified model. EFA is a variable-centered clustering technique where latent factors among observed variables are extracted mathematically from the data (Collins and Lanza 2013). EFA has been used exten-sively in science education research, particularly in the context of instrument validation (i.e. Romine et al. 2013; Corwin et al. 2015), and is a technique that is often asso-ciated with classical test validation methods and other
situations where the researcher wishes to reduce a larger feature set to relatively few latent constructs or dimen-sions (Henson and Roberts 2006).
While methods from Rasch, Item Response Theory (IRT), and CFA traditions are confirmatory in nature, meaning that the measurement model is specified a priori, EFA is exploratory in nature, meaning that the measurement model is extracted mathematically from the data a posteori. EFA is therefore a useful tool when the researcher intends to extract a factor structure from the data mathematically without invoking prior infor-mation (Costello and Osborne 2005). Given its explora-tory nature, a key challenge when conducting an EFA was deciding how many factors should be extracted from the data. Many different guidelines exist for making this decision which can result in different conclusions; we used the scree test (Cattell 1966) in combination with “reasoned reflection” (Henson and Roberts 2006, p. 399) based on the structure of the solution. Specifically, we sought a solution that both makes sense and yields dimensions which are conceptually separable, which is referred to as simple structure (Bryant and Yarnold
1995). After factor extraction, we utilized the promax rotation method (Hendrickson and White 1964) to diag-onalize the factor solution. This oblique rotation method allowed the factors to be correlated, which assisted us in deriving a conceptually understandable and separable factor solution.
Although the scree criterion and the requirement of simple structure can provide evidence for the suitability of the factor solution derived from EFA, there are none-theless multiple methods for extracting the optimal num-ber of factors which often yield different conclusions (Fabrigar and Wegener 2011). Further, a decision regard-ing the extent to which a loadregard-ing is high or low, impor-tant or ignorable, is subjective. Following Nadelson and Southerland (2012), we therefore used a CFA process to quantify the extent to which our factor solutions derived from EFA actually reproduced the data. Our models assumed no cross-loading between items and utilized the probit link to account for the categorical nature of the responses. Estimation was done using the diagonally weighted least squares (WLSMV) estimator in Mplus 7 (Muthén and Muthén 2012). Fit with the data was evalu-ated using the Root Mean Square Error of Approxima-tion (RMSEA), Comparative Fit Index (CFI), and the Tucker-Lewis Index (TLI). An RMSEA close to 0.06 (Hu and Bentler 1999), but not above 0.07 (Steiger 2007) is indicative of acceptable fit. Acceptable fit is also indicated by a CFI and TLI above 0.9 (Bentler 1990; Bentler and Bonnet 1980).
to outline some limitations of EFA, and factor analysis in general. From the perspective of test validation, EFA is criticized based on its treatment of ordinal observa-tions as linear measures and its tendency to select for items which are similar in difficulty (Wright 1996), which is contrary to the objective of more contemporary meth-odologies such as Rasch modeling (Wright 1996; Boone and Scantlebury 2006). Further, factor analysis is a data-fitting approach which can be dubious when validity of the assessment is in question—rather, a data-independ-ent validity standard is needed (Boone and Scantlebury
2006). Given these criticisms, and its discord with the Rasch validation philosophy in particular, we do not use factor analysis as an end to validation, but instead as a starting point to inform us about how to proceed with Rasch modeling.
Rasch analysis
After making a reflective and informed decision on the number of factors to retain, and observing the spe-cific items loading onto particular factors, our atten-tion turned to construct validity of the individual items towards measurement of each dimension, which we call an acceptance sub-construct from here on. Given that a student’s appraisal of each item was rated on a Likert scale, we utilized the Rasch rating scale model (Andrich
1982) as a criterion for validity. Rasch models differ in philosophy from other models like IRT and classical test theory (CTT) in that Rasch provides a philosophi-cal criterion for validity of the data as opposed to letting the model define the data. This practice of evaluating the quality of the data through a standard model is dif-ferent from the statistical practice of fitting the model to the data, which the goal of IRT and CTT. Whether to use Rasch or IRT modeling for validation of tests and surveys has been debated contentiously for many years (Andrich 2004). This said, it is straightforward to argue that the Rasch approach better aligns with the labora-tory practice of calibrating machines based on a fixed standard before their use. Further, use of a fixed stand-ard better aligns with the scientific practice of falsifica-tion (Popper 1957; Lakatos 1976) than use of statistical data-fitting approaches. Beyond these epistemological advantages, the Rasch approach facilitates generation of item-independent estimates of acceptance and person-independent estimates of item difficulty (also true with IRT), generation of linear estimates, and the ability to map student and item measures along a common scale (Boone and Scantlebury 2006).
We used the WINSTEPS software package (Linacre
2006) to fit a unidimensional Rasch rating scale model to each dimension using the items within each acceptance sub-construct informed by the factor analyses. These
provided a standard for the validity of the items and subscales. Conformity of the response patterns of each item to expected fit with the Rasch model was evalu-ated through mean squares fit. We used infit and outfit of the item response patterns with respect to what the model would predict based on the item’s difficulty. These measures of fit have expected values of 1, but Wright et al. (1994) suggest that values between 0.5 and 1.5 are indicative of potentially useful items. Other sources sug-gest a more conservative range of 0.7–1.3 for acceptable agreement with expected fit (Bond and Fox 2015). Val-ues below 0.5 indicate that the item fits the model bet-ter than we would expect in real data, possibly indicating bias in the item that favors students with high acceptance (Masters 1988). With regards to measurement validity, misfitting items represent a significant validity concern as they indicate bias in favor of students with weak lev-els of acceptance which contradicts the intended scale directionality (Bond and Fox 2015). We evaluated items with respect to the mean squares fit thresholds of 1.3 and 1.5 as potentially indicative of moderate and high misfit, respectively, with Rasch model expectations.
In addition to item validity, we were also interested in the usefulness of the scale itself in explaining and quan-tifying students’ acceptance. Of primary concern was unidimensionality of the items in each acceptance sub-construct: the efficacy of the Rasch model in capturing the systematic variance in the item responses within each subscale. As with item fit, we evaluated unidimensional-ity using a falsificationist perspective. We first invoked the assumption that the items are unidimensional, and then attempted to falsify this by inspecting the residu-als in the item responses with respect to the model. If the items measure a single dimension, then the residuals should be random, or homoscedastic. We implemented principal components analysis (PCA) on the residu-als, and inspected the first eigenvalue. If the residuals are random, this eigenvalue should fall below 2 items of variance (Linacre and Tennant 2009). A first eigenvalue above 2 indicates some systematic departure from uni-dimensionality in the set of items with respect to the intended acceptance sub-construct and warrants explo-ration of which particular items are responsible for mul-tidimensionality of the scale.
Results
Factor structure of the item corpus
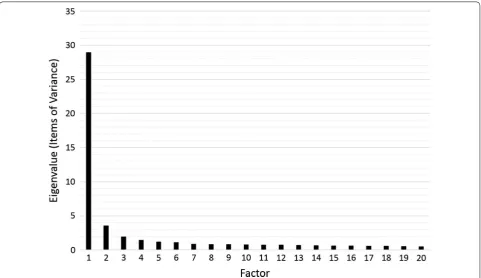
of evolution. However, the second eigenvalue accounts for 3.5 items of variance, an additional 6.2% of the total variance. After 2 dimensions, the eigenvalue of the sub-sequent dimension drops to 1.9 items of variance, for an additional 3.3% of variance. By Cattell’s (1966) scree crite-rion (scree plot in Fig. 1), this indicates that 2 dimensions may provide a more informative description of the struc-ture of this corpus of items. CFA on the factor solution also bears this out. A 1-dimensional CFA model yields an RMSEA of 0.08, a CFI of 0.92, and a TLI of 0.91. This indicates moderate-to-good fit. However, a 2-dimen-sional CFA model with ignorable cross-loading between items significantly improves fit to the data (χ2= 98.2, df= 1, p ≪ 0.001), yielding an RMSEA of 0.064, a CFI of 0.95, and a TLI of 0.94. CFI and TLI values indicate that the 2-dimensional model fits well. That the RMSEA is below 0.07, also indicates acceptable fit. It is noteworthy that our RMSEA value exceeds that reported by Nadel-son and Southerland (2012) for the I-SEA, and the CFI values in these respective studies match. These indices indicate collectively that a 2-dimensional factor struc-ture is both necessary and sufficient to obtain acceptable fit with the data. If one adopts the 2-dimensional model, the correlation between these two acceptance sub-con-structs is 0.73, indicating that they share 53% of their var-iance with each other. This demonstrates that these two
sub-constructs share significant similarity, but nonethe-less have important differences that need explaining.
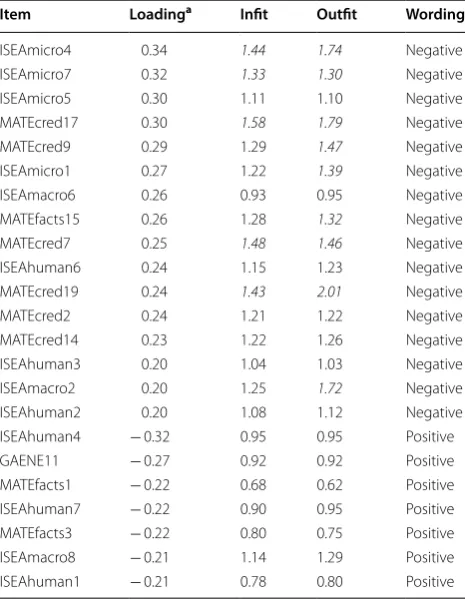
The items display an interesting pattern in the oblique 2-dimensional factor structure (Table 1); namely that items with positive loadings (measured between 0.37 and 0.91) onto the first dimension (F1) are positively worded while items with positive loadings (measured between 0.50 and 0.92) onto the second dimension (F2) are nega-tively worded. Further, we observe that these loadings exhibit the simple structure that is coveted in measure-ment (Bryant and Yarnold 1995)—negatively-worded items have comparatively small loadings onto the first dimension (between − 0.26 and 0.28) while positively worded items have comparatively small loadings onto the second dimension (between − 0.19 and 0.24). This indicates that the measure of each acceptance sub-con-struct aligning with a dimension has a unique and precise meaning which is independent of the other dimension—a measure for the first dimension is not confounded by the second dimension, and vice versa. We now consult the factor loadings on the 2-dimensional model (columns 3 and 4 in Table 1) to evaluate the extent to which this solu-tion makes sense, and to gain insight into the structure of these dimensions. We evaluated their qualitative mean-ing by inspectmean-ing the items with the highest factor load-ings onto the respective dimensions (Table 2).
Table 1 Two-dimensional factor loadings and Rasch item difficulty and mean squares fit statistics for both 1-dimensional and 2-dimensional usages
Item Wording EFA dimensionality 1D 1D 1D 2D 2D 2D
F1 loading F2 loading Difficulty Infit Outfit Difficulty Infit Outfit
ISEAMacro1 P 0.87 − 0.03 − 0.17 0.67 0.63 − 0.15 0.70 0.68
ISEAMacro2a N 0.12 0.62 0.15 1.25 1.72 0.06 1.05 1.16
ISEAMacro3 P 0.70 0.15 − 0.33 0.62 0.62 − 0.33 0.72 0.75
ISEAMacro4 P 0.77 − 0.05 0.39 0.95 1.07 0.53 1.05 1.17
ISEAMacro5 P 0.72 0.08 − 0.32 0.75 0.78 − 0.33 0.83 0.88
ISEAMacro6 N 0.23 0.58 0.28 0.93 0.95 0.19 0.82 0.84
ISEAMacro7 P 0.71 0.05 − 0.36 0.73 0.73 − 0.38 0.84 0.82
ISEAMacro8b P 0.78 − 0.13 0.27 1.14 1.29 0.39 1.23 1.37
ISEAMicro1a N − 0.17 0.83 − 0.18 1.22 1.39 − 0.31 0.92 1.15
ISEAMicro2 P 0.61 0.04 − 0.52 0.96 1.03 − 0.57 1.12 1.17
ISEAMicro3b P 0.37 0.24 − 0.68 1.07 0.92 − 0.77 1.32 1.17
ISEAMicro4a N − 0.26 0.92 − 0.24 1.44 1.74 − 0.36 0.97 1.02
ISEAMicro5 N − 0.06 0.82 − 0.26 1.11 1.10 − 0.39 0.83 0.95
ISEAMicro6 P 0.50 0.15 − 0.34 0.89 0.91 − 0.35 1.06 1.06
ISEAMicro7a N − 0.04 0.78 − 0.39 1.33 1.30 − 0.52 0.97 0.91
ISEAMicro8 P 0.72 0.07 − 0.14 0.76 0.72 − 0.11 0.83 0.79
ISEAHuman1 P 0.81 0.01 0.19 0.78 0.80 0.29 0.81 0.84
ISEAHuman2 N 0.24 0.58 0.46 1.08 1.12 0.38 1.01 1.01
ISEAHuman3 N 0.23 0.61 0.26 1.04 1.03 0.18 0.90 0.90
ISEAHuman4 P 0.85 − 0.01 0.17 0.95 0.95 0.27 0.99 0.99
ISEAHuman5 P 0.73 0.08 − 0.02 1.01 0.98 0.03 1.18 1.17
ISEAHuman6 N 0.11 0.67 0.09 1.15 1.23 − 0.01 0.95 1.04
ISEAHuman7 P 0.84 − 0.02 0.08 0.90 0.95 0.16 0.92 0.96
ISEAHuman8 P 0.63 − 0.10 − 0.15 1.00 1.08 − 0.11 1.15 1.18
MATEfacts1 P 0.82 0.07 − 0.13 0.68 0.62 − 0.09 0.71 0.65
MATEcred2 N 0.07 0.65 0.27 1.21 1.22 0.18 1.02 1.06
MATEfacts3 P 0.87 − 0.01 0.09 0.80 0.75 0.18 0.84 0.79
MATEcred4 N 0.12 0.66 0.26 1.08 1.17 0.16 0.94 0.97
MATEcred5b P 0.46 0.05 − 0.50 1.12 1.23 − 0.56 1.33 1.39
MATEcred6 N 0.28 0.50 0.46 0.91 1.00 0.40 0.85 0.90
MATEcred7a N 0.07 0.59 − 0.31 1.48 1.46 − 0.43 1.24 1.23
MATEfacts8 P 0.73 0.09 − 0.15 0.68 0.65 − 0.13 0.77 0.74
MATEcred9a N 0.03 0.73 − 0.07 1.29 1.47 − 0.18 0.99 0.99
MATEcred10 N 0.21 0.63 − 0.03 1.00 1.02 − 0.13 0.90 0.87
MATEfacts11 P 0.64 0.10 − 0.15 1.05 1.06 − 0.12 1.21 1.16
MATEfacts12 P 0.70 0.09 0.04 0.69 0.72 0.11 0.78 0.94
MATEfacts13 P 0.79 − 0.01 − 0.04 0.71 0.84 0.01 0.76 0.91
MATEcred14 N 0.14 0.69 0.13 1.22 1.26 0.03 1.04 1.03
MATEfacts15a N 0.10 0.69 0.20 1.28 1.32 0.11 1.02 1.01
MATEfacts16 P 0.73 0.10 0.11 0.78 0.76 0.20 0.85 0.84
MATEcred17a,b N − 0.22 0.69 0.22 1.58 1.79 0.12 1.31 1.53
MATEfacts18 P 0.80 0.06 − 0.11 0.61 0.59 − 0.07 0.66 0.63
MATEcred19a,b N − 0.05 0.56 0.58 1.43 2.01 0.52 1.25 1.54
MATEfacts20 P 0.64 0.24 − 0.01 0.72 0.70 0.05 0.87 0.88
GAENE1a,b P 0.60 − 0.03 − 0.24 1.23 1.36 − 0.23 1.42 1.52
GAENE2 P 0.66 0.14 − 0.03 0.72 0.74 0.02 0.84 0.85
The five items which load most highly onto the first dimension (loadings between 0.84 and 0.91) address acceptance of evolution as a mechanism for the origin of life as we know it today. Four out of these five items address human evolution specifically, meaning that a student’s score on this acceptance sub-construct may be influenced most highly by their acceptance of human evolution. For example, item GAENE11 is the highest loading item (loading = 0.91), and states: Evolution is a good explanation for how humans emerged on Earth. Item MATEfacts3 is quite similar, stating: Modern humans are the product of evolutionary processes that have occurred over millions of years. ISEAhuman4 and 7 solicit agree-ment with the idea that humans and apes share a com-mon ancestor. And ISEAmacro1 asks for agreement with the idea that new species evolved from ancestral species. In sum, these items solicit appraisal of evolution as a true, useful, and valid theory. It is interesting that the highest loading items address human evolution. Conceptually,
a factor loading for an item is derived from a regression equation where a student’s measure for a latent con-struct or dimension is a predictor of his/her response for a certain item. This addresses the question: how well do students’ measures for a certain construct explain their responses for an item defining that construct? Based on this conception, the high factor loadings for the human evolution items indicate that students’ measures for this construct do very well in predicting how they will respond on these items. This implies that students who accept evolution as true, useful, and valid will tend to report very high acceptance for these items, whereas stu-dents who reject evolution will tend to report very low acceptance with high predictability. From here on, we label the construct underlying this dimension: acceptance of the truth of evolution.
After reverse coding, the five items which load most highly onto the second dimension (loadings between 0.73 and 0.92) address rejection of incredible or false
a Potential item misfit with the Rasch model in a unidimensional treatment b Potential item misfit with the Rasch model in a two-dimensional treatment
Table 1 (continued)
Item Wording EFA dimensionality 1D 1D 1D 2D 2D 2D
F1 loading F2 loading Difficulty Infit Outfit Difficulty Infit Outfit
GAENE4 P 0.81 0.01 − 0.27 0.96 0.89 − 0.27 1.03 0.96
GAENE5 P 0.69 0.02 − 0.51 0.98 0.98 − 0.57 1.08 1.08
GAENE6b P 0.73 − 0.05 0.84 1.20 1.29 1.08 1.28 1.51
GAENE7 P 0.53 0.05 − 0.73 1.06 1.06 − 0.83 1.23 1.21
GAENE8a,b P 0.79 − 0.19 0.92 1.18 1.50 1.18 1.30 1.69
GAENE9 P 0.81 − 0.03 0.15 0.84 0.85 0.24 0.89 0.87
GAENE10 P 0.73 0.08 0.52 1.03 1.05 0.69 1.11 1.17
GAENE11 P 0.91 − 0.07 0.36 0.92 0.92 0.49 0.93 0.94
GAENE12 P 0.78 − 0.07 0.71 1.09 1.15 0.93 1.15 1.19
GAENE13 P 0.79 0.08 − 0.10 0.69 0.64 − 0.07 0.73 0.68
Table 2 The highest loading items onto the first (F1) and second (F2) dimensions
Name F1 F2 Wording Stem
GAENE11 0.91 − 0.07 P Evolution is a good explanation of how humans first emerged on the earth ISEAMacro1 0.87 − 0.03 P I think that new species evolved from ancestral species
MATEfacts3 0.87 − 0.01 P Modern humans are the product of evolutionary processes that have occurred over millions of years ISEAHuman4 0.85 − 0.01 P I think that humans and apes share an ancient ancestor
ISEAHuman7 0.84 − 0.02 P The many characteristics that humans share with other primates (i.e., chimpanzees, gorillas) can best be explained by our sharing a common ancestor
ISEAMicro4 − 0.26 0.92 N Species were created to be perfectly suited to their environment, so they do not change
ISEAMicro1 − 0.17 0.83 N I think that organisms, as they exist now, are perfectly adapted to their natural environments and so will not continue to change
ideas underlying hesitancy against the theory of evolu-tion. These five highest loading items get at the idea that species do not change. For example, the highest loading item (loading = 0.92), ISEAmicro4, states: Species were created to be perfectly suited to their environment, so they do not change. ISEAmicro7 and MATEcred9 are worded nearly identically, stating that organisms (or species) exist in the same form they always have. ISEAmicro5 solicits non-acceptance of the idea that organisms will evolve new traits over time. Finally, ISEAmicro1 addresses a pos-sible root for these above conceptions: that organisms are currently perfectly suited to their environments, and so do not change. Acceptance of change (or in this case, rejec-tion of the idea that organisms do not change over time), is required in order to find the theory of evolution cred-ible and useful. While these represent the highest load-ing items, a vast majority of the negatively worded items present false ideas that must be rejected in order to find the theory of evolution credible and useful. We therefore label the construct underlying this dimension: rejection of incredible ideas about evolution.
Rasch analysis
1‑dimensional usage
Rasch analysis gives compelling evidence for the useful-ness of these items as a unidimensional measure, but as with the EFA, also suggests that a two-dimensional construction may increase the usefulness of the meas-ure. When the 57 items are treated as measuring a sin-gle factor, acceptance of evolution, they yield measures with a reliability of 0.98 (separation = 6.71). Further, 46 out of the 57 items (81%) fit the Rasch model well, indi-cating that most of the items provide useful measures for acceptance of evolution as a single dimension. Five of these items displayed at least one fit index (mean squares infit or outfit) above 1.50, while the other six items dis-played a fit index above 1.30.
The eigenvalue of the first factor derived from PCA on the residuals with respect to this model contains 2.11 items of variance. This is very close to 2, but nonethe-less suggests a small departure from unidimensionality (Linacre and Tennant 2009). A closer look at items load-ing onto this factor corroborates our EFA results that whether the item is positively or negatively worded is to blame for this departure from unidimensionality. Inspec-tion of Table 3 shows that sixteen negatively-worded items have positive loadings of 0.2 or above onto this residual factor, and also tend to be the items which misfit the Rasch model. On the other hand, seven items display negative loadings of 0.2 or above onto this residual factor. These items display positive wording and good fit with the Rasch model. In summary, while one can argue that the MATE, I-SEA, and GAENE are useful in measuring
evolution acceptance as a single construct, introduction of negative wording into the MATE and I-SEA gets at a different aspect of evolution acceptance than the posi-tively worded items. Instead of measuring acceptance that evolution is true, the negatively worded items focus on ability or willingness to reject incredible ideas about evolution which lead one to not accept the theory. For example, those students scoring high (after reverse cod-ing) on MATEcred19 (infit = 1.48, outfit = 2.01) reject the idea that organisms came into existence at about the same time. Those with a high score on ISEAmicro4 (infit = 1.44, outfit = 1.74) reject the idea that species were created to be perfectly suited to their environment, and therefore do not change. Those scoring high on MATEcred17 (infit = 1.58, outfit = 1.79) reject the idea that much of the scientific community doubts if evolution occurs. That these items misfit the Rasch model indicates that students’ acceptance of evolution as a single latent variable does not explain the response patterns on these items.
2‑dimensional usage
When the 57 items are broken into two separate sub-constructs consisting of the 38 positively worded and 19 negatively worded items, respectively, excellent reliability is maintained and the measures become unidimensional. The 38 positively-worded items provide a measure for acceptance of the truth of evolution with a Rasch person reliability of 0.97 (separation = 5.95). The first eigenvalue from PCA on residuals from the Rasch rating scale model fitting these items consists of 1.51 items of variance, which is well below 2. The 19 negatively worded items generate measures for rejection of incredible ideas about evolution with a Rasch person reliability of 0.94 (separa-tion = 4.09). The Rasch model also shows that this scale is unidimensional, with a first eigenvalue of 1.15 items of variance from PCA on the residuals with respect to the model.
Only two of the 19 items measuring rejection of incredible ideas displayed significant misfit with the Rasch model. These items come from the MATE (items MATEcred17 and MATEcred19), and display mean squares fit indices greater than 1.50. MATEcred17 states much of the scientific community doubts if evolu-tion occurs and MATEcred19 states with few exceptions, organisms came into existence about the same time. These items are also of moderate-to-high difficulty in compari-son with the other items measuring this construct, indi-cating that even students who tend to reject the other erroneous or incredible ideas, thus getting high meas-ures on the rejection of incredible ideas construct, tend to accept these ideas.
Discussion
Parametrizing evolution acceptance
The purpose of this study was to examine the measure-ment properties of the items contained in three quanti-tative evolution acceptance instruments, each of which captures evolution acceptance differently in terms of dimensionality and context. The MATE was designed as a unidimensional measure which used macroevolution and human evolution contexts in its items (Rutledge and Warden 1999). The I-SEA was developed to capture these contexts in separate constructs; it was designed to meas-ure acceptance of microevolution, macroevolution, and human evolution as three respective dimensions (Nadel-son and Southerland 2012). The GAENE was designed to provide a unidimensional measure of evolution accept-ance which is independent of knowledge of evolution and religious orientation (Smith et al. 2016). Given the high similarity of wording between many of the items on the three instruments and the fact that they share a com-mon Likert measurement scheme, we hypothesized that these instruments may share more similarities than dif-ferences and actually provide similar quantitative infor-mation about evolution acceptance. We found that this is the case. Putting the 57 items from the three instru-ments together to form an instrument-independent scal-ing results in useful unidimensional and two-dimensional parametrizations of evolution acceptance.
Given the two parametrizations, a big-picture question that comes forth immediately is: should evolution accept-ance be treated unidimensionally as it has in the vast majority of quantitative work on evolution acceptance, or should it be treated as a two-dimensional construct which is apparently delineated by the positive or nega-tive orientation of the wording of the items (also found in a recent study by Romine et al. 2017)? Our position is that a unidimensional usage of these items may provide a useful measure for evolution acceptance. Evidence for this includes: (1) the high variance of the first dimension
in the EFA (28.9 items of variance out of 57 total items) in comparison to the other dimensions (Fig. 1), (2) the close-ness of the first eigenvalue from PCA on Rasch residu-als to 2 for a unidimensional construction (2.11 items of variance), and (3) the moderate relationship between acceptance of truth and rejection of incredible ideas (r = 0.73). In fact Metzger et al. (2018) found that much of the apparent two-dimensionality of the MATE found by Romine et al. (2017) disappears in more advanced sci-ence students. However, deciding not to recognize evolu-tion acceptance as a two-dimensional construct may also result in a missed opportunity—CFA and Rasch analysis demonstrate that a unidimensional construction does not capture the entire story regarding how these three instru-ments measure evolution acceptance.
Our analyses collectively (Tables 1, 2, 3) suggest that observing a conceptual distinction between positively- and negatively-worded items is empirically useful, and we argue that recognizing the distinction between accept-ance of truth and rejection of incredible ideas is sup-ported by conceptual work around evolution acceptance
Table 3 Items with factor loadings above 0.2 on the first residual dimension with respect to a unidimensional Rasch model for the collective I-SEA, MATE, and GAENE 2.1 item corpus
Mean squares fit statistics of 1.30 or higher are indicated in italics
a First residual factor
Item Loadinga Infit Outfit Wording
ISEAmicro4 0.34 1.44 1.74 Negative
ISEAmicro7 0.32 1.33 1.30 Negative
ISEAmicro5 0.30 1.11 1.10 Negative
MATEcred17 0.30 1.58 1.79 Negative
MATEcred9 0.29 1.29 1.47 Negative
ISEAmicro1 0.27 1.22 1.39 Negative
ISEAmacro6 0.26 0.93 0.95 Negative
MATEfacts15 0.26 1.28 1.32 Negative
MATEcred7 0.25 1.48 1.46 Negative
ISEAhuman6 0.24 1.15 1.23 Negative
MATEcred19 0.24 1.43 2.01 Negative
MATEcred2 0.24 1.21 1.22 Negative
MATEcred14 0.23 1.22 1.26 Negative
ISEAhuman3 0.20 1.04 1.03 Negative
ISEAmacro2 0.20 1.25 1.72 Negative
ISEAhuman2 0.20 1.08 1.12 Negative
ISEAhuman4 − 0.32 0.95 0.95 Positive
GAENE11 − 0.27 0.92 0.92 Positive
MATEfacts1 − 0.22 0.68 0.62 Positive
ISEAhuman7 − 0.22 0.90 0.95 Positive
MATEfacts3 − 0.22 0.80 0.75 Positive
ISEAmacro8 − 0.21 1.14 1.29 Positive
(Deniz et al. 2008; Ha et al. 2012). For example, Deniz et al. (2008) propose a model in which evolution accept-ance is constructed by an integration of cognitive, affec-tive, and contextual factors. Further, they nest evolution acceptance within the theory of conceptual change (Strike and Posner 1992) in their suggestion that accept-ance of evolution is necessary in order to find new ideas about evolution plausible and fruitful (Deniz et al. 2008). Our findings in this study not only support this asser-tion, but also allow us to expand upon it in proposing that the dimensionality by item valence aligns with spe-cific elements of conceptual change theory. The theory of conceptual change is rooted in the idea that students construct new ideas through agreement based on their existing knowledge, experience, and social interactions (Posner et al. 1982). This implies that different individuals may interpret evolutionary phenomena in different ways based on their prior knowledge, metaphysical beliefs, and sociocultural background (Hewson 1981). It follows that one mechanism for learning involves agreement to abandon previously-held ideas and replace them with scientifically acceptable ideas (Posner et al. 1982). For a learner to agree to do this, he/she must find dissatisfac-tion in a previously-held idea and henceforth find the new idea more intelligible, plausible, and fruitful than the previously-held idea (Posner et al. 1982; Treagust and Duit 2008). Our first sub-construct, acceptance of the truth of evolution, aligns with the intelligibility and plau-sibility conditions of conceptual change, similar to that suggested by Deniz and colleagues. A student’s measure for rejection of incredible ideas about evolution aligns directly with a student’s dissatisfaction with non-scien-tific ideas and in turn the likelihood that he/she will find a scientifically-acceptable idea fruitful. Rejection of incred-ible ideas therefore more directly influences the likeli-hood that instruction will be successful in facilitating conceptual change. Although we did not measure knowl-edge of evolution in this study, previous work (Romine et al. 2017) supports this assertion in its finding that the correlation of acceptance of the credibility of evolution (aligned closely with rejection of incredible ideas in this study) with knowledge of macroevolution was signifi-cantly higher than the correlation between acceptance of facts about evolution (aligned closely with acceptance of truth in this study) with knowledge of macroevolution.
We also find that the two-dimensional parametriza-tion aligns well with the more recent model of Ha et al. (2012), which describes evolution acceptance as mani-festing through both conscious and unconscious neu-rological pathways. Our acceptance of truth dimension aligns most closely with the unconscious pathway which is based upon a student’s intuitive feeling of certainty. For example, evolution is a good explanation for how humans
first emerged on the earth (from the GAENE) solicits an appraisal based on one’s feeling of certainty built from extracurricular experience, and not necessarily analysis of the credibility of an idea based on logic. On the other hand, the rejection of incredible ideas dimension aligns most closely with the student’s conscious, reflective thinking supported by his/her process of understanding and logical reasoning around conceptual ideas underlying evolutionary theory. For example, expressing disagree-ment with the statedisagree-ment, species were created to be per-fectly suited to their environment, so they do not change (from the I-SEA) requires a student to first consider the specific idea and then decide to reject that idea. Although the decision to reject an idea is affective in nature, it is in itself a comparatively logical and reflective process.
In addition to understanding how our current meas-ures of evolution acceptance fit with conceptual work, this study also yields insight into the empirical impli-cations for parametrizing evolution acceptance. Vari-ous parametrizations have been explored. Nadelson and Southerland (2012) utilized a three-dimensional model for evolution acceptance in their construction of the I-SEA, suggesting that the dimensions of evolution acceptance should be delineated by the type of tion: microevolution, microevolution, and human evolu-tion. What this study suggests is that, from a quantitative perspective, topic is a determinant of the difficulty of an item along the same sub-construct (Figs. 3 and 4), but it does not seem to serve as the key delimiter in terms of the unique sub-constructs. In other words, while accept-ance of macroevolution, human evolution, and micro-evolution may be distinct in their difficulty, it may not be necessary to treat them as distinct sub-constructs. Rather, the data show that differences between students’ responses on items across contexts are accounted for by the expected difficulty hierarchy imposed by the Rasch model (Boone 2016), making it unnecessary to define new sub-constructs to account for the different response patterns across contexts.
Previous literature supports the idea that acceptance of evolution varies depending on context (i.e. Scott 2005; Nadelson and Hardy 2015). Figures 3 and 4 suggest that this comprises a progression of acceptance similar in structure to what we have seen in research applying Rasch models to learning progressions (Romine et al.
An additional motivation for constructing the I-SEA by the topics of microevolution, macroevolution, and human evolution is that students who are reluctant to accept that organisms, including humans, evolve on long time scales may nonetheless accept that organisms
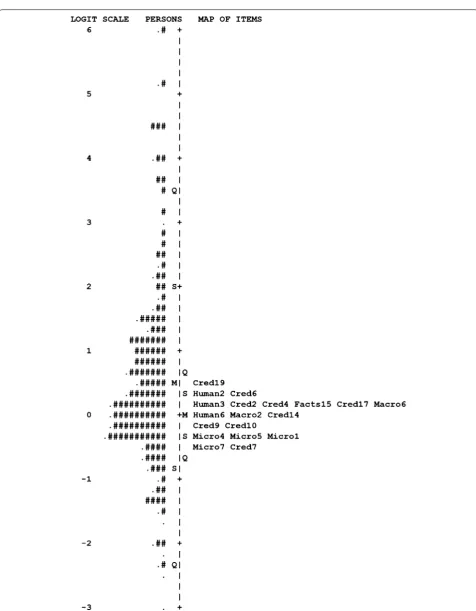
evolve on short, observable time scales. The Wright map for the unidimensional construction (Fig. 2) shows that the items addressing human evolution are indeed the most difficult. However, the items at the bottom of the scale are macroevolution items, and as we go up the
scale, we see a mix of macroevolution and microevo-lution items. Much of this muddiness clears up when we model the positively and negatively worded items as separate sub-constructs (Figs. 3, 4). A two-dimensional parametrization gives the expected result that the items addressing evolution over short times scales are easi-est for students to accept, those addressing evolution over long time scales are more difficult for students to accept, and those addressing human evolution are most difficult for students to accept. We see this as evidence that treating these instruments, and evolution accept-ance in general, two-dimensionally gives a more realis-tic account of how college students think as they decide whether or not to accept evolution.
Previous work with the MATE also supports the idea that evolution acceptance should be treated two-dimen-sionally. Despite the fact that the MATE has mostly been used as a unidimensional instrument, an analysis by Wagler and Wagler (2013) suggests that the MATE behaves multidimensionally, and that it can be difficult to predict which items load on which dimensions as par-ticipants and contexts change. Romine et al. (2017), on the other hand, suggest that the behavior of the MATE is quite predictable in undergraduate students, and put forth a two-dimensional parametrization for the MATE that is similar to that discovered independently in this study. The only item result that was not replicated is Item 5 on the MATE (Cred5). In our previous work, this was the only positively-worded item which loaded more strongly onto the acceptance of credibility than the acceptance of facts dimension. In this study, it loaded onto the acceptance of truth dimension, which is more in line with what we would expect given that it is a posi-tively-worded item.
This multidimensionality of evolution acceptance as measured by the MATE and I-SEA, and lack of basis upon a predefined framework for evolution acceptance, were driving factors for construction of the GAENE, which its authors claim is a generalizable unidimensional measure of evolution acceptance (Smith et al. 2016). Our analysis suggests that the main factor making the GAENE unidi-mensional is that all of its items are positively-worded.
This means that the GAENE measures acceptance of
truth but not rejection of incredible ideas. With respect to its contribution to measurement of evolution acceptance, both Figs. 2 and 3 show that the spread of the difficulty of the items is greater than those of the other instruments, meaning that these items provide information about stu-dents of a greater ability range than the items from the MATE and I-SEA. While this is attractive from a Rasch modeling perspective (Boone 2016), we also observe that some of the more difficult items from the GAENE do not fit well with the Rasch model, meaning that even students
with high levels of acceptance tend to express low levels of acceptance on these items. To follow, we discuss rea-sons for the misfit of these and other items, and what this may tell us about how to improve our measures of evolu-tion acceptance.
Misfitting items and implications for improving current measures
When the items from these three instruments are treated unidimensionally, we observe the pattern that it is the negatively-worded items which tend to misfit with the Rasch model, and also tend to load positively onto the residual factor (Tables 1, 3). Nine of the 19 negatively-worded items exhibit some misfit (a mean squares index over 1.3) with the Rasch model in this case. These results collectively illustrate the multidimensionality of the negatively-worded items under the assumption of a uni-dimensional model for evolution acceptance. It makes sense that the Rasch model would tend to model the positively-worded items more faithfully, and thus iden-tify negatively-worded items as anomalous, since the 38 positively-worded items double the 19 items which are negatively-worded.
This apparent bias disappears when positively- and negatively-worded items are treated as separate dimen-sions as suggested by the EFA, making it straightforward to explore more precisely potential issues with the word-ing of particular items. On the acceptance of truth dimen-sion, three items (GAENE1, GAENE6, and GAENE8) exhibited a mean squares fit index above 1.50, which is indicative that these items may be harmful to the validity of the scale as it is defined by the corpus of 38 items in this construct (Wright et al. 1994). It happens that these items are also of moderate-to-high difficulty. This sug-gests a tendency for higher accepting students to express lower levels of acceptance on these items despite express-ing high levels of acceptance on the other items meas-uring this construct. GAENE8, the most difficult item (Fig. 3), states: nothing in biology makes sense without evolution. From an expert biologist’s perspective, evolu-tion may serve as the centerpiece for understanding biol-ogy, but a college student who accepts evolution may feel that topics like anatomy and physiology, microbiology, and cell biology can be understood adequately without first understanding evolution. The context is not there since evolution is often not covered in college courses addressing these subjects.
GAENE1, everyone should understand evolution,
GAENE6 sits at the top of the Rasch difficulty scale along with GAENE8 (Fig. 3). This item states: I would be will-ing to argue in favor of evolution in a public forum such as a school club, church group, or meeting of public school parents. Fear of public speaking is quite common (Har-ris et al. 2002), and it is straightforward to argue that one can display acceptance of evolution without extraversion. In addition to evolution acceptance this item measures willingness to engage in public discourse; the latter hav-ing little to do with evolution acceptance.
Two items within the rejection of incredible ideas construct misfit with the Rasch model: MATEcred17 and MATEcred19. These items were also of relatively high difficulty, indicating that students who tended to reject the other misconception statements nonethe-less tended to accept these. Students may have accepted MATEcred17, much of the scientific community doubts if evolution occurs, since the term “scientific community” is quite broad. A student who has taken a variety of science classes has likely seen that evolution is not discussed in most of these classes—especially the physical sciences, but even in biology (Padian 2010). It would therefore make sense for students to accept this statement regard-less of their tendency to reject other ideas which are not credible. The misfit of MATEcred19, with few exceptions, organisms came into existence about the same time, is more difficult to explain. We argue that the rejection of incredible ideas construct is comparatively aligned with one’s understanding of evolution (cognition), so the ten-dency for high ability students to accept this idea may be reflective of the persistent misunderstanding of deep time and the evolutionary timeline—one of the most dif-ficult concepts for students to comprehend (Rosengren et al. 2012). Common practice may be to simply eliminate these items from the corpus in future research. However, doing this would carry the consequence of eliminating a potentially important part of the construct. We caution against making assessment decisions based on a single number. Instead the nature of the specific construct of interest should also be considered when deciding which items to use from these three instruments.
Suggestions for using current evolution acceptance instrumentation
A key question that arises from the above discussion is, how should the MATE, I-SEA, and GAENE be used in research? Much of the previous discourse around these instruments has centered on the question: which instru-ment works best? The I-SEA was developed to make our measures of evolution acceptance more fine-grained (Nadelson and Southerland 2012). A key motivation for developing the GAENE was to overcome the episte-mological inadequacies of the MATE and I-SEA (Smith
et al. 2016). Although we do not find anything inher-ently wrong with using a particular instrument, our data indicate that loyalty to a particular instrument is unnecessary. We instead suggest a reframing of the dia-logue toward a discussion of the merits and limitations of particular items instead of the instruments themselves. For example, if an evaluation project calls for a focus on human evolution or macroevolution, then we suggest that relevant items from both the MATE and the I-SEA could be combined into a single scale. On a different pro-ject, a researcher may wish to obtain a measure that is less context dependent and more based on an individual student’s understanding of what constitutes the theory. In this case, the pool of items may be drawn primarily from the GAENE along with the more context-independent items from the I-SEA and MATE. We would, however, recommend that researchers using the GAENE consider removing the items asking students to “…argue in favor of evolution…” unless improving a student’s extraversion is an important part of the evaluation plan.
Limitations of this study and current instrumentation
We would like to conclude by acknowledging some limitations of this study and our current measures of evolution acceptance toward understanding evolution acceptance conceptually. When making conclusions about the dimensionality of current evolution accept-ance measures, it is important to consider the population being measured. The focus of this study was science non-majors at the college level. This population is unique due to the large variation in the types of non-major students in college who take general education science courses. We would expect the two dimensional structure found in this study to be retained in other populations with high internal variation like middle or high school, or the general public. However, if these items were adminis-tered to science majors or science teachers, participants would likely give consistently high ratings on all of the items, and the apparent two-dimensionality observed in this study may become negligible. This pattern has been observed in a recent study (Metzger et al. 2018). At the other end of the spectrum, if these items were adminis-tered to a population which held tenacious anti-evolu-tionary views, the ratings may be consistently low, and the item corpus may also become more unidimensional. We leave exploration of these phenomena to future research. In light of future research, it is useful to keep in mind that we took an a posteori approach, meaning that we factorized the items from these three instruments using variable-centered clustering (Collins and Lanza
introduce a particular bias to validity analyses, and we recognize that conclusions regarding the usefulness of particular items may have been different if we had used these instruments as they had been used previously.
An additional limitation to the conclusions of this study is that while item valence generates measures which are two-dimensional, it is not clear whether or not this variation is useful for helping us measure evolution acceptance. Some researchers suggest that cognitive fatigue may be responsible for the pattern of dimensionality based on item valence (Smith et al.
2016). This hypothesis suggests that there is construct-irrelevant variation in the negatively-worded items which results from their being difficult to interpret. This is an alternative to our interpretation that posi-tively- and negaposi-tively-worded items are measuring two distinct constructs which comprise unique and useful ways to look at evolution acceptance. These compet-ing hypotheses have not been explored empirically in evolution education. Concern with negative wording is not new, and has surfaced in other fields. For example, negative wording in the Job Diagnostic Survey (Hack-man and Oldham 1975) was found to create deviations from unidimensionality (Kulik et al. 1988), leading Schmitt and Stuits (1985) to suggest that a respondent’s education level may play a role in this. This claim was later not supported using a structural equation mod-eling methodology (Cordery and Sevastos 1993). We similarly find the cognitive fatigue hypothesis to be an unlikely explanation for the multidimensionality of cur-rent evolution acceptance items for several reasons. First, although Smith et al. (2016) states: “…disagreeing with a negative item constitutes a double negative” (p. 1312), a majority of the negatively-worded items on the MATE and I-SEA are not written in double negatives. Secondly, there is little reason to believe that a nega-tively-worded item like Species were created to be per-fectly suited to their environment, so they do not change (from the I-SEA) would be more difficult for an under-graduate student to interpret than a positively worded item like I think new species evolved from ancestral spe-cies (from the I-SEA). Just as there are currently no data to support the cognitive fatigue hypothesis, we also do not have data to support our favored hypothesis that these are unique and useful dimensions. Our models show that these dimensions are highly separable psy-chometrically, but we cannot necessarily conclude that this separateness is useful as opposed to a systematic measurement artifact. This said, we find the acceptance of truth and rejection of incredible ideas derived from our data to be intellectually satisfying given their align-ment with the unique elealign-ments of conceptual change theory and the subsequent additional insight it adds to
Deniz et al’s (2008) and Ha et al.’s (2012) frameworks discussed previously.
Upon undertaking this research, we did not know what type of solution to expect, which is why we started with an exploratory factor approach. Would the items be uni-dimensional? Would sub-constructs be delineated by type of evolution as in the I-SEA? Would positive or neg-ative wording play a role? We expected that it might be a combination of these things. The clean two-dimensional factor structure delineated solely by item valence came as a surprise to us. Since this pattern has also come up in previous work on college students taking general educa-tion science courses (Romine et al. 2017), and to a lesser degree in more advanced students (Metzger et al. 2018), we feel it is no coincidence and deserves further explora-tion and discussion.
A more significant limitation of our current evolution acceptance instrumentation comes out of the way the information is solicited; namely, items comprise a stu-dent’s evaluation of specific statements related to evolu-tion, which Scherer (2005) defines as an action of appraisal. While it is interesting to understand how students appraise a statement related to the theory of evolution, we have not yet developed ways of going beyond appraisal toward analysis of students’ emotional experiences, which are criti-cal for understanding the actual feelings students harbor towards evolution and how these relate to the short-term decisions students make around learning evolution. Emo-tion goes beyond cognitive appraisal in that it manifests as bodily symptoms, motivation towards specific actions, and communication of one’s actual behavioral intentions (Scherer 2005), which are related directly to the perceived relevance of a particular object or event to one’s well-being (Frijda 1986). Although a good amount of work has been done towards constructing useful measures of evolution acceptance, students’ emotions about learning in general, and particularly those related to learning the theory of evolution, remain largely unmeasured and ill-understood. Given that a student’s feelings constitute a key component of contemporary theoretical models of evolution accept-ance (Deniz et al. 2008; Ha et al. 2012), measurement of emotion is an important next step in understanding stu-dents’ affect towards evolution.
Authors’ contributions
WR conducted the data analysis and drafted the manuscript. WR and AT conceptualized the study. AT and EW collected data for the study. All authors read and approved the final manuscript.
Author details