Energy efficiency improvement for broiler production using
non-parametric techniques
Sajjad Ebrahimi
1*, Tarahom Mesri Gundoshmian
2, Reza Abdi
1, Mehri Raei Jadidi
3(1.Department of Biosystems Engineering, Faculty of Agriculture, University of Tabriz, Iran;
2. Department of Biosystems Engineering, Faculty of Agriculture, University of Mohaghegh Ardabili, Ardabil, Iran;
3. Department of Agricultural Economics, Faculty of Agriculture, University of Tabriz, Iran)
Abstract: The goal of this study was to evaluate the sustainability and efficiency of broiler production with regard to energy consumption in Ardabil province, Iran. To reach the goal, linear programming model and Data Envelopment Analysis (DEA) were employed. Data were collected from the farmers using a face–to–face questionnaire performed in September– December 2014 period. The DEA application results showed that the average values of technical, pure technical and scale efficiency scores of producers were 0.949, 0.988 and 0.960, respectively. Also, energy saving target ratio for broiler production was calculated as 8.33%, indicating that by following the recommendations resulted from this study, about 12316.85 MJ/(1000 bird) of total input energy could be saved while holding the constant level of broiler production. The results of linear programming model revealed that by using of optimum energy, producers could increase average yield by 17.6%. Also the results indicated that the existing productivity level could be achieved even by reducing the existing energy use level by 13.89%. Diesel fuel, natural gas and electricity energy inputs had the highest potential for saving ener gy in two methods; so, if inefficient producers would pay more attention towards these sources, they would considerably improve their energy productivity.
Keywords: energy efficiency, Data Envelopment Analysis, linear programming, technical efficiency, broiler
Citation: Ebrahimi S., Tarahom M.G., Reza A., and Mehri R.J. 2016. Energy efficiency improvement for broiler production using non-parametric techniques. Agricultural Engineering International: CIGR Journal, 18 (2):121-132.
1 Introduction
1Energy is one of the most important material bases for the economic growth and social development of a country or region. Scientific forecasts and analysis of energy consumption will be of great importance for the planning of energy strategies and policies (Liang et al., 2007). Energy analysis allows the energy cost of existing process operations to be compared with that of new or modified production lines (Jekayinfa Simeon, 2007). Efficient use of energy in agriculture will minimize environmental problems and prevent destruction of natural resources (Erdal et al., 2007).Broiler production was not recognized as an important occupation in the past; it has developed and
Received date: 2015-11-04 Accepted date: 2016-01-31
*Corresponding author: Sajjad Ebrahimi, Department of Biosystems Engineering, Faculty of Agriculture, University of Tabriz, Iran. Tel: (+98) 4113392776. Fax: (+98) 4113356007.
occupied a place of pride among the livestock enterprises due to its rapid monetary turnover. Poultry meat and eggs offer considerable potential for meeting human needs for dietary animal supply (Heidari et al., 2011).
when efficiency of each Decision Making Unit (DMU) is compared to that of an ideal operating unit rather than to the average performance (Zhang et al., 2009).
The excess use of resources and scope to increase the productivity or conserve the energy input without affecting the productivity, thereby enhancing the efficiency of energy use with different energy optimization methods, has been studied by many researchers (Kutala 1993; Refsgaard et al., 1998; Mobtaker et al., 2012;Valipour, 2012;Jadidi et al., 2012b; Valipour, 2015a).
There are several parametric and non-parametric techniques to measure the efficiency in agricultural production systems. Parametric methods assume a particular functional form between inputs and output and estimate the function parameters statistically. In a number of recent researches, the econometric approach has been used to identify the relationship between energy consumption from different inputs and yield values of crop productions (Kulekci, 2010; Mohammadi et al., 2010; Mousavi-Avval et al., 2011a). Currently, the most popular approach employs non-parametric techniques such as Data Envelopment Analysis (DEA) and linear programming model (LP). There have been numerous applications of DEA to measure the efficiency in agricultural production systems (Abay et al., 2004; Nassiri and Singh, 2009; Banaeian et al., 2010; Mobtaker et al., 2012).
Singh et al. (2004) investigated optimization of energy inputs for wheat production in Punjab. In this research, the linear programming based on the concept of one-to-one functions was used. They reported that total energy input in different zones could be saved by 7%– 22%. Jadidi et al. (2012a) used linear programming model to optimize of energy consumption for wheat production. The results revealed that using existing energy inputs, the yield of wheat can be increased by 32%, 25% and 6% in small, medium and large farms, respectively.
Ramírez et al. (2006) used energy and physical production data to develop energy efficiency indicators for the meat industry of four European countries. Heidari et al. (2011) determined the energy consumption per 1000 bird for the broiler production in Yazd province, Iran. The results showed that total energy consumption in broiler production was 186,885.87 MJ/(1000 bird). Also diesel fuel had the biggest share among inputs energy. Iribarren et al. (2011) used LCA+DEA methodology with the aim of performing an eco-efficiency assessment of a high number of dairy farms. The results showed that using this approach about 38% of input consumption levels and 20% of every environmental impact category can be achieved.
Pahlavan et al. (2012) applied DEA approach to Optimize of energy consumption for rose production. The results revealed that about 43.59% of the total input energy could be saved without reducing the rose yield. Ebrahimi et al. (2014) employed the DEA technique to analyze the efficiency of potato producers in Ardabil province, Iran. The results showed that, from the total of 60producers, considered for the analysis, 28% and 40% were found to be technically and pure technically efficient, respectively.
Salehi et al. (2015) used DEA approach to improve the energy efficiency of button mushroom producers and to identify the wasteful uses of energy. In this study the average values of technical, pure technical and scale efficiencies of producers were 0.94, 0.97 and 0.97, respectively. Also the results revealed that 10% of input energy could be saved if the producers follow the results recommended by this study. Mohammadi et al., (2015) assessed rice paddy fields using a combined LCA and DEA methodology to estimate the technical efficiency of each farmer. The results indicated that the direct field emissions had the high potential in reducing the environmental effects for rice paddy system.
energy requirement and wasteful uses of energy from different inputs for broiler production in Ardabil province of Iran. For this propose LP model and DEA technique were used.
2 Materials and methods
2.1 Energy analysis
This study was carried out in 30broiler production farms of the Ardabil province, located in northwest of Iran within 34° 04′ and 39° 42′ north latitude and 47° 02′ and 48° 55′ east longitude. Data were collected from the farmers using a face-to-face questionnaire performed in September-December 2014 period. The simple random sampling method was used to determine the survey volume (Mobtaker et al., 2010).The inputs used in the production of broiler were specified in order to calculate the energy equivalences in the study. Inputs in broiler production were: human labour, machinery, diesel fuel, natural gas, electricity, chicken (chick) and feed. The amount of energy contained in foodstuffs fed to broiler is normally expressed in units of metabolizable energy per unit weight, e.g. kilo Joules per gram (kJ/g). The energy requirement of broiler is expressed in terms of metabolizable energy per day (kJ/day) (Heidari et al., 2011). The output energy sources were broiler and manure.
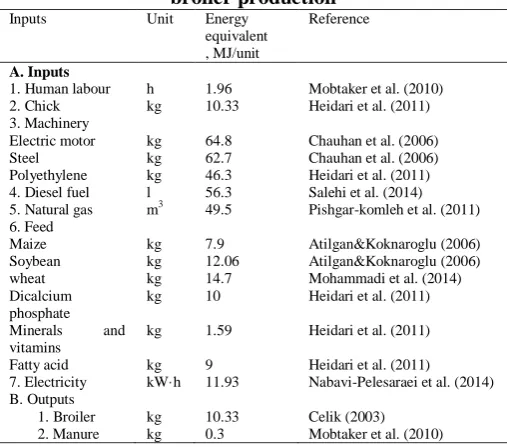
Table 1Energy equivalents of inputs and output in broiler production
Inputs Unit Energy equivalent , MJ/unit
Reference
A. Inputs
1. Human labour h 1.96 Mobtaker et al. (2010) 2. Chick kg 10.33 Heidari et al. (2011) 3. Machinery
Electric motor kg 64.8 Chauhan et al. (2006) Steel kg 62.7 Chauhan et al. (2006) Polyethylene kg 46.3 Heidari et al. (2011) 4. Diesel fuel l 56.3 Salehi et al. (2014) 5. Natural gas m3 49.5 Pishgar-komleh et al. (2011)
6. Feed
Maize kg 7.9 Atilgan&Koknaroglu (2006) Soybean kg 12.06 Atilgan&Koknaroglu (2006) wheat kg 14.7 Mohammadi et al. (2014) Dicalcium
phosphate
kg 10 Heidari et al. (2011) Minerals and
vitamins
kg 1.59 Heidari et al. (2011) Fatty acid kg 9 Heidari et al. (2011) 7. Electricity kW·h 11.93 Nabavi-Pelesaraei et al. (2014) B. Outputs
1. Broiler kg 10.33 Celik (2003) 2. Manure kg 0.3 Mobtaker et al. (2010)
The energy equivalents given in Table 1, were used to calculate the input amounts. Following the calculation of energy input and output values, the energy ratio (energy use efficiency), energy productivity and net energy were determined (Mobtaker et al., 2010; Heidari et al., 2011; Salehi et al., 2014).
(1)
(2)
(3)
2.2 DEA model
The DEA is an analysis method to measure the relative efficiency of a homogeneous number of production units or decision–making units that essentially perform the same tasks. It results in a revealed understanding about each DMU instead of depicting the features of a mythical ‘‘average’’ DMU as in parametric analysis (Chauhan et al., 2006).Given a sample of the DMUs, the purpose of the DEA is to establish the relative efficiency of each DMU as long as they are comparable in the sense that they all consume the same inputs, albeit in different quantities, and produce the same set of outputs, also in different quantities (Galanopoulos et al., 2006).In the DEA literature, there are basically two kinds of DEA models. These are CCR (Charnes, Cooper and Rhodes) and BCC (Banker, Charnes, Cooper) models.
over inputs rather than output levels, and as a recommendation, input conservation for given outputs seems to be more reasonable (Galanopoulos et al., 2006). Therefore in this study the input–oriented slacks-based measure of efficiency CCR model was employed.
2.2.1 Technical efficiency
The basic feature of DEA is that the Technical Efficiency (TE) score of each DMU depends on the performance of the sample of which it is a part (Martínez and Silveira, 2012).The technical efficiency can be expressed generally by the ratio of sum of the weighted outputs to sum of weighted inputs. The value of technical efficiency varies between zero and one where a value of one implies that the DMU is a best performer located on the production frontier and has no reduction potential. Any value of TE lower than one indicates that the DMU uses inputs inefficiently (Mousavi-Avval et al., 2011).Using standard notations, the technical efficiency can be expressed mathematically as the following relationship:
∑∑
(4)
where, ur, is the weight given to output n; yr, is the
amount of output n; vs, is the weight given to input n; xs,
is the amount of input n; r, is number of outputs (r = 1, 2, . . ., n); s, is number of inputs (s = 1, 2, .., m) and j, represents jth of DMUs (j = 1, 2, . . ., k). Equation (1) is a fractional problem, so it can be translated into a linear programming problem which is introduced by Charnes et al. (1978):
∑
(5)
∑ ∑ (6)
∑ (7) Where, θ is the technical efficiency and i represents ith DMU (it will be fixed in Equations (5) and (7) while j increases in Equation (6).The above model is a linear programming model and is popularly known as the CCR DAE model, which assumes that there is no significant relationship between the scale of operations and efficiency (Avkiran, 2001). So, the large producers are just as efficient as small ones in converting inputs to output. 2.2.2 Pure technical efficiency Pure technical efficiency is another model in DEA that is introduced by Banker et al., 1984. This model is called BCC and calculates the technical efficiency of DMUs under variable return to scale conditions. Pure technical efficiency could separate both technical and scale efficiencies. The main advantage of this model is that scale inefficient farms are only compared to efficient farms of a similar size (Bames, 2006).In an input-oriented framework, the BCC model can be expressed by a dual linear programming problem as follows (Banker et al., 1984): (8)
(9)
(10)
(11)
Where SE=1 indicates that the DMU has the same level of technical and pure technical efficiency scores, thus it is operating at the most productive scale size. If a DMU has the full pure technical efficiency score, but a low technical efficiency score (SE < 1), then it is locally efficient but not globally efficient due to its scale size (SarIca and Or, 2007).
2.3 Linear programming model
Linear programming is the most powerful technique that can resolve various issues with regard to the conditions apply. A linear programming model has objective function and constrains. Objective function is a mathematical function that consists of decision variables. This function represents maximize utility or minimize the cost. Constrains consisting of an equation or no equation from decision variables that express the limitations of the model or decision in order to research the model objectives. Constrain include all limitation can be met on each inputs consumption or yield production.
Optimum energy use in agriculture is reflected in two ways, i.e. an increase in productivity with the existing level of energy inputs or conserving energy without affecting the productivity. Linear programming based on the concept of one-to-one functions was used to optimize the energy inputs (assuming no change in area under the crop). Based on this concept, the linear programming problem was formulated as (Singh et al., 2004):
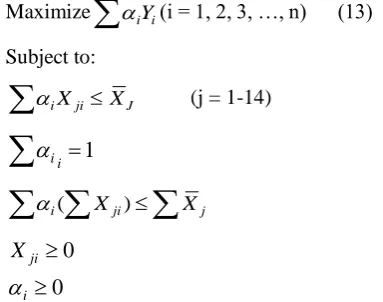
Maximize
iYi(i = 1, 2, 3, …, n) (13)Subject to:
J ji
iX X
(j = 1-14)1
ii
i( Xji) Xj0 0
i ji
X
Where Xj is the weighted mean of the jth energy use (j = 1-14) and
Xji is the total energy use by theith farmer. Farmers who fulfilled the above constraints and contributed to the optimal solution were assigned weightage (
) according to their effectiveness of energy input use. Optimized levels of energy input use to get the existing productivity level of tomato were computed using non-parametric programming by reducing the level of total energy input use (
Xj).3 Results and discussion
3.1 Analysis of input–output energy use in broiler
production
The inputs used in broiler production and their energy equivalents with output energy rates are shown in the Table 2. The results revealed that around 117 h of human labour and 7 kg of machinery power were required to produce 1000 bird in the research area. The majority of human labour was used in the feeding operations. Total energy used in various operations during broiler production was 147819.36MJ/(1000 bird). The average meat production of farms was 2632.59 kg/(1000 bird). Heidari et al. (2011) concluded that the total energy used in various operations during broiler production was to be 186885.87MJ/(1000 bird). The quantity of chicken required in the broiler production was56.54 kg/(1000 bird). Results also showed total energy output was 27837.27 MJ/(1000 bird).
Table 2 Amounts of inputs, output and energy inputs and output for broiler production
Inputs/Outputs Quantity per unit , 1000 bird
Total energy equivalent, MJ/(1000 bird)
A. Inputs
1. Human labour, h 116.97 229.27
2. Chick, kg 56.54 584.02
3. Machinery, kg 6.79 439.83
4. Diesel fuel, l 1135.93 63953.14 5. Natural gas, m3 438.94 21727.40
6. Feed, kg 7986.40 52780.31
7. Electricity, kW·h 679.41 8105.40 The total energy input, MJ 147819.36 B. Outputs
1. Broiler, kg 2632.59 27194.66
2. Manure, kg 2142.03 642.61
Total energy output, MJ 27837.27
bird), 36%). It can also be seen from Figure 1 that the energy input of natural gas has big share of the total energy input (about 15%). The majority of diesel fuel and natural gas was consumed for the heating purpose. High consumption of this inputs resulted from low thermal efficiency of heating systems. Similar results have been reported in studies that the diesel fuel was high energy consumption in agricultural crops production (Omid et al., 2011; Salehi et al., 2014). The majority of feed belongs to wheat. Wheat is one of the most-produced cereals in the world which its cultivation is increased during past half century (Valipour, 2015b; Valipour et al., 2015). Wheat is a major staple food in several regions of the world and efficient use of it is essential. The consumption of human labor, chick and machinery energy were low in broiler production.
The energy use efficiency, energy productivity and net energy gain of broiler production in the Ardabil province are listed in Table 3.The energy use efficiency in the production of broiler was found to be 0.19, indicating the inefficiency use of energy in the broiler production. Heidari et al. (2011) reported the energy ratio for broiler production as 0.15. The energy ratio is often used as an index to examine the energy efficiency in crop production (Kuesters and Lammel, 1999). The average energy productivity of broiler production was 0.02 kg/MJ. This means that 0.02 units output was obtained per unit energy. The net energy of broiler production was negative (– 119982.08 MJ/(1000 bird)). Therefore, it can be concluded that in broiler production, energy is being lost. Similar results obtain for different crops production (Banaeian et al., 2011; Heidari et al., 2011; Salehi et al., 2014).
Also the distribution of inputs used in the production of broiler according to the direct, indirect, renewable and non-renewable energy groups, are given in Table 3. The total consumed energy input could be classified as direct energy (63.60%), and indirect energy(36.40%) or renewable energy (36.26%) and non-renewable energy (63.74%).
It is seen that the ratios of renewable and non-renewable energy are fairly different from each other (about 36% and 64%). This indicates that broiler production depends mainly on non-renewable energy (machinery, diesel fuel, natural gas and electricity) in the studied area. Therefore, it is clear that non-renewable
energy consumption was higher than that of renewable in broiler production, which is in agreement with the literatures for different crops production (Heidari et al., 2011; Mobtaker et al., 2012;Nabavi-Pelesaraei et al., 2014).
Table 3 Some energy parameters in broiler production
Items Unit Quantity Energy use efficiency – 0.19 Energy productivity kg/MJ 0.018 Net energy MJ/(1000bird) –119982.08 Direct energya MJ/(1000bird) 94015.20 (63.60%)
Indirect energyb MJ/(1000bird) 53804.15 (36.40%) Renewable energyc MJ/(1000bird) 53593.59 (36.26%) Non-renewable energyd MJ/(1000bird) 94225.76 (63.74%) a
Includes human labor, diesel fuel, natural gas, electricity.
b
Includes chick, machinery, feed.
c
Includes human labor, chick, feed.
d
Includes machinery, diesel fuel, natural gas, electricity.
3.2 Efficiency estimation of broiler production
farmers in DEA
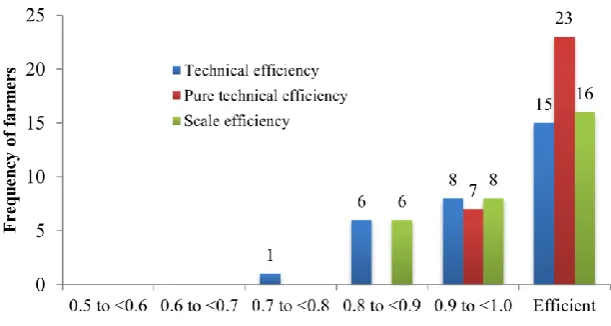
The results of BCC and CCR DEA models are illustrated in Figure 2. The results revealed that many of the farms in the sample are operating at near or full efficiency for all the model specifications, so that from the total of 30 farmers considered for the analysis, 23 farmers (76.7%) had the pure technical efficiency score of one. Moreover, from the pure technically efficient
farmers 15 farmers (50.0%) had the technical efficiency score of one. From efficient farmers 15 were the fully efficient farmers in both the technical and pure technical efficiency scores, indicating that they were globally efficient and operated at the most productive scale size; so, they do not have any potential improvement on energy use. These results are similar to the results of Mohammadi et al. (2011) and Mobtaker et al. (2012).
The summarized statistics for the three estimated measures of efficiency based on the results of the models (5) and (8) and Equation (12) are presented in Table 4.The results revealed that many of the farms in the sample are operating at near or full efficiency for all the model specifications, so that from the total of 30 farmers
considered for the analysis, 23 farmers (76.7%) had the pure technical efficiency score of one. Moreover, from the pure technically efficient farmers 15 farmers (50.0%) had the technical efficiency score of one. The average values of technical, pure technical and scale efficiency scores were 0.949, 0.988 and 0.960, respectively. As can be seen, the difference between best and worst units was calculated high for both of method. These results
indicated the energy use pattern in studied area was different. The technical efficiency varied from 0.777 to one which had the highest standard deviation (0.068) between other efficiency indices, indicating that all producers were not fully aware of the right production techniques. Salehi et al. (2011) applied DEA technique to determine the efficiencies of button mushroom production farms in Iran. They reported that the technical, pure technical and scale efficiency scores were 0.94, 0.97 and 0.97 respectively.
3.3 Optimum energy requirement and saving energy
Table 5 shows the optimum energy requirement and saving energy of various inputs for broiler production using BCC model. The results revealed that the total optimum energy requirement for broiler production was 135502.50 MJ/(1000 bird). The percentage of energy saving in total optimum energy was calculated as 8.33%, indicating that by following the recommendations
Table 4 Average technical, pure and scale efficiency of broiler farmers
Particular Average SD Min Max
Technical efficiency (-) 0.949 0.068 0.777 1 Pure technical efficiency (-) 0.988 0.025 0.915 1 Scale efficiency (-) 0.960 0.054 0.849 1
resulted from this study, on average, about 12316.85 MJ/(1000 bird)of total input energy could be saved while holding the constant output level of broiler production. In the broiler production, a farmer has more control over inputs rather than output levels. Therefore, this amount of energy could be saved, while holding the constant output level of output level. The electricity had the highest percentage of energy saving (15.25%), followed by natural gas (14.03%) and diesel fuel (11.26%). Natural gas and diesel fuel use mainly for heating purpose. The high percent saving of diesel fuel energy resulted from the low thermal efficiency of heating systems. In order to reduction of diesel fuel consumption, it is strongly suggested that new heating system with high thermal efficiency are to be used and walls are to be insulated. This results in minimized greenhouse gas (GHG) emissions and environmental impacts.
Table 5 Optimum energy requirement and saving energy for broiler production (based on the CCR
model)
Input
Optimum energy requirement, MJ/(1000 bird)
Saving energy, MJ/(1000 bird) ESTR
*, %
1. Human labour 219.97 9.29 4.05
2. Chick 567.24 16.78 2.87
3. Machinery 429.96 9.87 2.24
4. Diesel fuel 56754.62 7198.52 11.26 5. Natural gas 18680.02 3047.38 14.03
6. Feed 51981.69 798.62 1.51
7. Electricity 6869.01 1236.39 15.25 Total energy 135502.50 12316.85 8.33
* energy saving target ratio: The total reducing amount of input that could be saved
without decreasing output
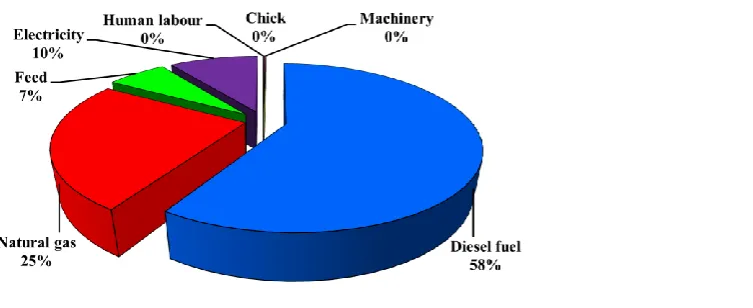
In Figure 3 the shares of the various sources from total input energy saving are presented. Results revealed that the highest contribution to the total saving energy was 58.44% for diesel fuel followed by natural gas (24.74%) and electricity (10.04%) energy inputs, respectively. Moreover the shares of human labor, machinery, and chick energy inputs were relatively low, indicating that they have been used in the right proportions by almost all the farmers.
Ebrahimi et al. (2014) reported that on an average, 14.43% of the total input energy for potato production in Iran could be saved. In another study, the total energy saving was calculated about 88.07 MJ/m for button mushroom production (Salehi et al., 2015).
The improvements of energy indices for broiler production are presented in Table 6. Energy use efficiency for target use of energy was calculated as 0.21, showing an improvement of 9.09%. Also, energy productivity and net energy were determined as 0.019 kg/MJ and -107665.23MJ/(1000 bird) in target use of energy. Furthermore, Table 6 showed the direct,
indirect, renewable and non-renewable energy. It is evident that by optimization of energy input, the shares of indirect and renewable energy with respect to total energy input increased. The reduction of diesel fuel, natural gas and electricity consumption for target units was the main reason for high difference in direct energy consumption. Also, the energy optimization can reduce non-renewable energy consumption by these inputs reduction, significantly.
mushroom production. Also, Ebrahimi et al. (2014) to determine energy use efficiency for potato production 1.08 and 1.26, in present and target use of energy, respectively.
Table 6 Improvement of energy indices for broiler production in DEA
Items Unit Optimum Quantity
Difference ,% Energy use
efficiency
– 0.21 9.09
Energy productivity kg/MJ 0.019 9.09 Net energy MJ/(1000 bird) -107665.23 10.27 Direct energy MJ/(1000 bird) 82523.62
(60.90%)
-12.22
Indirect energy MJ/(1000 bird) 52978.89 (39.10%)
-1.53
Renewable energy MJ/(1000 bird) 52768.90 (38.94%)
-1.54
Non-renewable energy
MJ/(1000 bird) 82733.61 (61.06%)
-12.20
3.4 Efficiency estimation of broiler production in LP
model
The results of solving linear programming model for optimization of energy input were given in Table 7. The results showed that the maximum attainable output at optimal use of the existing resources was 840.78 kg/(1000 bird) higher than the actual observed yield. The use of optimum energy revealed that there exists greater scope to increase the productivity; as the producers could increase average yield by 17.6%. Also the results revealed that the producers used higher energy than the optimum. This indicated that the existing productivity level could be achieved even by reducing the existing energy use level by 13.89%. It can save the energy consumption by optimum use of diesel fuel, natural gas and electricity by 19.12%, 18.15% and 21.34%, respectively. In other words, by optimum use of inputs, about 217 L/(1000 bird) of diesel fuel could be saved.
Table 7 Optimum requirement and saving energy for broiler production (based on the LP model)
Inputs and output Optimum requirement
Saving energy,
MJ/(1000 bird) ESTR, % Output, kg/(1000
bird) 5615.40 - 17.6
Inputs, MJ/(1000 bird)
1. Human labour 213.08 16.19 -7.06
2. Chick 550.91 33.11 -5.67
3. Machinery 411.90 27.93 -6.35
4. Diesel fuel 51725.30 12227.84 -19.12 5. Natural gas 17783.88 3943.52 -18.15
6. Feed 50220.46 2559.85 -4.85
7. Electricity 6375.71 1729.69 -21.34 Total input energy 127281.2 20538.16 -13.89
The improvements of energy indices for broiler production using LP model are presented in Table 8. The results revealed that energy use efficiency by increasing of 15.79% can be improved to the value of 0.22. Also, energy productivity and net energy were found to be 0.044 kg/MJ and -99443.93MJ/(1000 bird), respectively. Net energy is negative, therefore, it can be concluded that in broiler production, energy is being lost. Also the distribution of total optimum energy input as direct and indirect or renewable and non-renewable energy forms are shown in Table 8. As it can be seen, the total energy input could be classified into direct and indirect forms by 56.73% and 38.15%, also into renewable and non-renewable energy forms by 38.01% and 56.88%, respectively.
Table 8 Improvement of energy indices for broiler production in LP model
Items Unit Optimum Quantity
Difference, % Energy use
efficiency
– 0.22
15.79 Energy productivity kg MJ−1 0.044 144.44 Net energy MJ (1000 bird) −1 -99443.93 17.12 Direct energy MJ (1000 bird) −1 76097.97
(59.79%) -19.0578 Indirect energy MJ (1000 bird) −1 51183.27
(40.21%) -4.87115 Renewable energy MJ (1000 bird) −1 50984.45
(40.06%) -4.86838 Non-renewable
energy
MJ (1000 bird) −1 76296.79
(59.94%) -19.0277
4 Conclusions
The aim of this study was to apply DEA and linear programming methodology to optimization of energy use pattern of broiler production farms in Ardabil Province, Iran. Based on the results of the investigations, the following conclusions were drawn:
2. Total energy used in various operations during broiler production was 147819.36 MJ/(1000 bird) in present conditions and 135502.50 MJ/(1000 bird) in target conditions of DEA and 127281.2MJ/(1000 bird)in target conditions of LP model.
3. From the total of 30 farmers considered for the analysis, 76.7% and 50% were found to be technically and pure technically efficient.
4. Energy saving target ratio for broiler production was calculated as 8.33% and 13.89% in DEA and LP model, respectively.
5. Diesel fuel, natural gas and electricity energy inputs had the highest potential for saving energy in two methods; so, if inefficient producers would pay more attention towards these sources, they would considerably improve their energy productivity.
References
Abay, C., B. Miran, and C. Gunden. 2004. An analysis of input use efficiency in tobacco production with respect to sustainability: the case study of Turkey. Journal of Sustainable Agriculture, 24(3): 123-143.
Atilgan, A., and H. Koknaroglu. 2006. Cultural energy analysis on broilers reared in different capacity poultry houses. Italian Journal of Animal Science, 5(4): 393–400.
Avkiran, N. K. 2001. Investigating technical and scale efficiencies of Australian Universities through Data Envelopment Analysis. Socio-Economic Planning Sciences, 35(1): 57–80. Bames, A. 2006.Does multi-functionality affect technical
efficiency? A non-parametric analysis of the Scottish dairy industry. Journal of Environmental Management, 80(4): 287–94.
Banaeian, N., M. Zangeneh, and M. Omid. 2010. Energy use efficiency for walnut producers using data envelopment analysis (DEA). Australian Journal of Crop Science, 4(5): 359–362.
Banaeian, N., M.Omid, and H.Ahmadi. 2011. Energy and economic analysis of green strawberry production in Tehran province of Iran. Energy Conversion and management, 52(2): 1020–1025.
Banker, R. D., A. Charnes, and W.W. Cooper. 1984. Some models for estimating technical and scale inefficiencies in data envelopment analysis. Management Science, 30(9): 1078– 1092.
Celik, L.O. 2003. Effects of dietary supplemental L-carnitine and ascorbic acid on performance, carcass composition and plasma L-carnitine concentration of broiler chicks reared under different temperature. Archives of Animal Nutrition, 27–38.
Charnes, A., W.W. Cooper, and E. Rhodes. 1978. Measuring the efficiency of decision making units. European Journal of Operational Research, 2(6): 429–444.
Chauhan, N.S., P.K.J. Mohapatra, and K.P. Pandey. 2006. Improving energy productivity in paddy production through benchmarking-An application of data envelopment analysis.
Energy Conversion Management, 47(9–10): 1063–1085. Chauhan, N.S., P.K.J. Mohapatra, and K.P. Pandey. 2006.
Improving energy productivity in paddy production through benchmarking–an application of data envelopment analysis.Energy Conversion and Management, 47(7–8): 1063–1085.
Cooper, L.M., L.M. Seiford, and K.Tone. 2006. Introduction to data envelopment analysis and its uses. New York: Springer. Ebrahimi, R., and M. Salehi. 2015. Improving energy use
efficiency and CO2 emissions analysis of button mushroom
production in Iran: A data envelopment analysis approach.
Journal of Cleaner Production. 103(1): 112–119.
Ebrahimi, S., Y.Ajabshirchi, R. Abdi, and H.G. Mobtaker. 2014. Analysis of energy efficiency of mechanized cultivation in potato production using data envelopment analysis approach.
Isesco Journal of Science and Technology, 10(17): 61–68. Erdal, G., K.Esengun, H. Erdal, and O. Gunduz. 2007. Energy
use and economical analysis of sugar beet production in Tokat province of Turkey. Energy, 32(4): 35–41.
Galanopoulos, K., S. Aggelopoulos, I. Kamenidou, and K. Mattas. 2006. Assessing the effects of managerial and production practices on the efficiency of commercial pig farming.
Agricultural Systems, 88(2–3): 125–141.
Heidari, M.D., M. Omid, and A. Akram. 2011. Energy efficiency and econometric analysis of broiler production farms. Energy, 36(11): 6536–6541.
Iribarren, D., A. Hospido, M.T. Moreira, and G. Feijoo. 2011. Benchmarking environmental and operational parameters through eco-efficiency criteria for dairy farms. Science of the Total Environment, 409(10): 1786–1798.
Jadidi, M.R., M. Homayounifar, M.S. Sabuni, and A. Mohammadi. 2012a. Energy analysis and optimization of inputs for wheat production in Marand region. Indian Journal of Agricultural Sciences, 82(2): 21–24.
Jadidi, M.R., M.S. Sabuni, M. Homayounifar, and A. Mohammadi. 2012b. Assessment of energy use pattern for tomato production in Iran: A case study from the Marand region.
Jekayinfa Simeon, O. 2007. Energetic analysis of poultry processing operations 3.Leonardo Journal of Sciences, 6(10): 77–92.
Kuesters, J., and J. Lammel. 1999. Investigations of the energy efficiency of the production of winter wheat and sugar beet in Europe. European Journal of Agronomy, 11(1): 35–43. Kulekci, M. 2010. Technical efficiency analysis for oilseed
sunflower farms: a case study in Erzurum, Turkey. Journal of the Science of Food and Agriculture, 90(9): 1508–1512. Kutala, S. S. 1993. Application of frontier technology to wheat
crop grown on reclaimed soils. Indian Journal of Agricultural Economics, 48(2): 226–36.
Liang, Q.–M., Y. Fan, and Y-M. Wei. 2007. Multi–regional input-output model for regional energy requirements and CO2 emissions in China. Energy Policy, 35(3): 1685–1700.
Martínez, P., and S. Silveira. 2012. Analysis of energy use and CO2
emission in service industries: evidence from Sweden.
Renewable and Sustainable Energy Reviews, 16(7): 5285– 5294.
Mobtaker, H.G., A. Akram, A. Keyhani, and A. Mohammadi. 2012. Optimization of energy required for alfalfa production using data envelopment analysis approach. Energy for Sustainable Development, 16(2): 242–248.
Mobtaker, H.G., A. Akram, and A. Keyhani. 2012. Energy use and sensitivity analysis of energy inputs for alfalfa production in Iran. Energy for sustainable development, 16(1): 84–89. Mobtaker, H.G., A. Keyhani, A. Mohammadi, S. Rafiee, and
A.Akram.2010. Sensitivity analysis of energy inputs for barley production in Hamedan Province of Iran. Agriculture, Ecosystems and Environment, 137(3): 367–372.
Mohammadi, A., S.H. Rafiee, S.S. Mohtasebi, S.H. Mousavi– Avval, and H. Rafiee. 2011. Energy efficiency improvement and input cost saving in kiwifruit production using Data Envelopment Analysis approach. Renewable Energy, 36(9): 2573–2579.
Mohammadi, A., Sh. Rafiee, A. Jafari, A. Keyhani, T. Dalgaard, M.T. Knudsen, T.L.T. Nguyen, R. Borek, J.E.Hermansen.2015. Joint Life Cycle Assessment and Data Envelopment Analysis for the benchmarking of environmental impacts in rice paddy production. Journal of Cleaner Production, 106(1): 521–532 .
Mohammadi, A., Sh. Rafiee, A. Jafari, A. Keyhani, S.H. Mousavi-Avval, and S. Nonhebel. 2014. Energy use efficiency and greenhouse gas emissions of farming systems in north Iran. Renewable and Sustainable Energy Reviews, 30(3): 724–733.
Mohammadi, A., S. Rafiee, S.S. Mohtasebi, and H. Rafiee. 2010. Energy inputs-yield relationship and cost analysis of kiwifruit production in Iran. Renewable Energy, 35(5): 1071-1075.
Mousavi-Avval, S.H., Sh. Rafiee, and A.Mohammadi. 2011. Optimization of energy consumption and input costs for apple production in Iran using data envelopment analysis.
Energy, 16(1): 909–916.
Mousavi-Avval, S.H., S. Rafiee, A. Jafari, and A. Mohammadi. 2011a. Optimization of energy consumption for soybean production using Data Envelopment Analysis (DEA) approach. Applied Energy, 88(11): 3755–3772.
Nabavi-Pelesaraei, A., R. Abdi, Sh. Rafiee, and H.G. Mobtaker. 2014. Optimization of energy required and greenhouse gas emissions analysis for orange producers using data envelopment analysis approach. Journal of Cleaner Production, 65(1): 311–317.
Nassiri, S.M., and S. Singh. 2009. Study on energy use efficiency for paddy crop using data envelopment analysis (DEA) technique. Applied Energy, 86(7–8): 1320-5.
Omid, M., F.Ghojabeige, H.Ahmadi, and M. Delshad. 2011. Energy use pattern and benchmarking of selected greenhouses in Iran using data envelopment analysis. Energy Conversion and Management, 52(1):153–62.
Pahlavan, R., M. Omid, Sh. Rafiee, and S.H. Mousavi-Avval. 2012. Optimization of energy consumption for rose production in Iran. Energy for sustainable development, 16(2): 236–241. Pishgar-Komleh, S.H., P. Sefeedpari, and S. Rafiee. 2011. Energy
and economic analysis of rice production under different farm levels in Guilan province of Iran. Energy, 36(10): 5824–5831.
Ramírez, C.A., M. Patel, and K. Blok. 2006. How much energy to process one pound of meat? A comparison of energy use and specific energy consumption in the meat industry of four European countries. Energy, 31(12): 2047–2063.
Refsgaard, K., N. Halberg, and E.S. Kristensen.1998. Energy utilization in crop and dairy production in organic and conventional livestock production systems. Agricultural Systems, 57(4): 599–630.
Salehi, M., R. Ebrahimi, A. Maleki, and H.G. Mobtaker. 2014. An assessment of energy modeling and input costs for greenhouse button mushroom production in Iran. Journal of Cleaner Production, 64(1): 377–383.
Sanghi, A., and R. Mendelsohn.2008. The impacts of global warming on farmers in Brazil and India. Global Environmental Change, 18(3): 655–665.
SarIca, K., and I.Or. 2007. Efficiency assessment of Turkish power plants using data envelopment analysis. Energy, 32(8): 1484–1499.
Valipour, M. 2012. Hydro-Module determination for vanaei villagein Eslam Abad Gharb, Iran. ARPN Journal of Agricultural and Biological Science, 2(1): 968-976.
Valipour, M. 2015a. A comprehensive study on irrigation management in Asia and Oceania. Archives of Agronomy and Soil Science, 61(7): 1247-1271.
Valipour, M. 2015b. What is the tendency to cultivate plants for designing cropping intensity in irrigated area? Advances in Water Science and Technology, 2(1): 1-12.
Valipour, M., M. Ziatabar-Ahmadi, M. Raeini-Sarjaz, M.A. Gholami-Sefidkouhi, A. Shahnazari, R. Fazlola, and A. Darzi-Naftchal. 2015. Agricultural water management in the
world during past half century. Archives of Agronomy and Soil Science, 61(7): 657-678.
Zhang, X., G. H.Huang, Q. Lin, and H. Yu. 2009. Petroleum-contaminated ground water remediation systems design: a data envelopment analysis based approach. Expert Systems with Applications, 36(3): 5666-5672.
Zhou, P., B.W. Ang, and K.L.Poh.2008. A survey of data envelopment analysis in energy an environmental studies.