Precautionary analysis of sprouting potato eyes using hyperspectral
imaging technology
Yingwang Gao
1,
Qiwei Li
1,
Xiuqin Rao
1,2*,
Yibin Ying
1,2,3(1. College of Biosystems Engineering and Food Science, Zhejiang University, Hangzhou 310058, China; 2. Key Laboratory of Equipment and Informatization in Environment Controlled Agriculture, Ministry of Agriculture, Hangzhou 310058, China;
3. Faculty of Agricultural and Food Science, Zhejiang A & F University, Hangzhou 311300, China)
Abstract: Sprouted potatoes are not allowed for healthy diet. A good knowledge of the sprouting stage of potatoes can help manage the storage conditions and guide market distribution, thus enabling the quality assurance of potatoes on table. This article presented an intelligent method for precautionary analysis of potato eyes based on hyperspectral imaging technique. Potential potato eyes were classified into two categories according to the time gap to the sprouting date, i.e. by-sprouting and pre-sprouting potato eyes, representing eyes about to sprout and eyes that will take a while to sprout. Features used for classification were extracted by two methods, including successive projections algorithm (SPA) and a newly-developed sine fit algorithm (SFA). Then classifiers of fisher discriminant analysis (FDA) and least square support vector machine (LSSVM) were utilized for classification of potential sprouting potato eyes. Results showed that FDA was more effective than LSSVM in classifying pre-sprouting and by-sprouting potato eyes, and SFA performed well in FDA classifier with the recognition accuracy of 95.3% for prediction set. It is concluded that hyperspectral imaging has the potential for predicting the sprouting stages of potato eyes.
Keywords: potato tuber, potato eyes, sprouting stage, hyperspectral imaging, sine fit algorithm(SFA), quality and safety, prediction
DOI: 10.25165/j.ijabe.20181102.2748
Citation: Gao Y W, Li Q W, Rao X Q, Ying Y B. Precautionary analysis of sprouting potato eyes using hyperspectral imaging technology. Int J Agric & Biol Eng, 2018; 11(2): 153–157.
1 Introduction
Potatoes (Solanum tuberosum) rank as the fifth highest
produced commodity used for human consumption[1]. Potatoes
grow better only in moderate climates, making the continuous supply of fresh goods impossible all the year round. Thus it is necessary to conduct long-term storage of the tubers after harvest. While tubers may sprout beneath potato eyes after dormancy period during the storage under favorable genetic and environmental
conditions[2]. The sprouted tubers can affect potato quality
adversely and bring about food safety problems. Sprouting is one of the factors contributing to the quality loss leading to remobilisation of storage compounds, mainly starch and proteins and shrinkage due to loss of water[3,4]. In addition, sprouts, along with periderm, present the highest concentrations of glycoalkaloids among all parts of a potato[5]. The presence of glycoalkaloids in potato tubers constitutes a serious problem in food safety since glycoalkaloids are toxic[6]. Therefore, sprouted potatoes should be pre-warned and kept away from our daily diet, which necessitates
Received date: 2016-07-30 Accepted date: 2017-11-23
Biographies: Yingwang Gao, PhD candidate, research interests: nondestructive detection of food quality by machine vision, Email: [email protected]; Qiwei Li, Master, research interests: potato quality detection using hyperspectral imaging, Email: [email protected]; Yibin Ying, PhD, Professor, research interests: sensing technology and equipment for quality safety of agro-products, Email: [email protected].
*Corresponding author: Xiuqin Rao, PhD, Professor, research interests: image-based quality sensing technology for agro-products. College of Biosystems Engineering and Food Science, Zhejiang University, 866 Yuhangtang Road, Westlake District, Hangzhou 310058, China. Tel: +86-571-88982170, Email: [email protected].
the prediction and classification of different sprouting stages of potato eyes.
Some researches were carried out to detect sprouted potatoes[7,8]. Jeong et al.[7] took sprout capacity (generally expressed as the sprout weight of uniform tubers after a standard sprouting procedure) as the indicator to determine the physiological age of potato tubers, and investigated the potential of near infra-red spectroscopy (NIRS) for predicting the sprout capacity. Results showed that NIRS method is a powerful tool for the predictive assessment of the sprouting capacity of potato tubers. Yu et al.[9] proposed a method to detect sprouts from the perspective of the image characteristics of sprouted potato based on Euclidean distance. An identification rate of 94% was obtained. Combining spectrum technology and imaging technology together, Jin et al.[10] collected the hyperspectral imaging data (390-1040 nm) of sprouted and normal potatoes, and analyzed in terms of both spectroscopy and image. Selected features were introduced into classification models, and an accuracy rate of 97.3% was obtained. As far as we know, very few published materials on prediction of sprouting stage on potato eyes were available, though sprouts recognition results were quite satisfactory.
Fusing imagery and spectroscopy together, hyperspectral imaging has demonstrated its potentialuse in various areas related
to potatoes, such as sugar content evaluation[11], defect
and validation, respectively. Weight measurement for potatoes could be improved if combining morphological features and spectral responses. Sprouting of potatoes goes through a series of biochemical changes, along with superficial textural transformations, which can be characterized by hyperspectral imaging technology.
Potatoes under improper sprouting stage are not suitable for market circulation. The aim of this study was to predict and thus classify potato eyes during different sprouting stages. Considering the inherent advantages possessed by hyperspectral imaging technology, the precautionary analysis of sprouting stages manifested by potato eyes were carried out through analyzing hyperspectral images in this study.
2 Materials and methods
2.1 Sample preparation
Potato tubers of the cultivar ‘Favorite’ were purchased from local whole-sale vegetable market in Hangzhou, China. According to grades and specifications of potatoes in China (NY/T 1066-2006), 150 potatoes with the mass of (63-276) g without defects, sprouts and greening defects were selected. A manual climatic box (RXZ-380A, Jiangnan Instrument, Ningbo, China) was used to simulate the ideal conditions for sprouting (20°C, 90%
RH) in dark environment[16]. Potatoes were placed into the box
for fifty days after washing before observation and data collection. Finally, 118 eyes on 150 sample potatoes successfully sprouted. During the experiment, d0 was labeled as the sprouting date, previous i day (s) before sprouting was referred to as di (i=1…n) (shown in Figure 1). Here, i means the time to be taken to sprout. Specifically, among all observed 118 sprouted eyes, 59 potato eyes were observed to sprout after four days, 95 potato eyes were to sprout after three days, 110 potato eyes were to sprout after two days, while 117 potato eyes were about to sprout the next day. It is worth noting that the number of sprouting eyes on one day contains the number of sprouting eyes prior to this day. The composition of the dataset should be counted retrospectively from the point of sprouting date. Potato eyes were treated as independent samples each day before sprouting date during data analysis.
Note: di (i=0,1,2,3,4) corresponds to the previous i day (s) before sprouting. Figure 1 Number of potato eyes in different sprouting stages
According to Guo et al.[17], potato eyes with different expected
sprouting dates di can be divided into two classes based on the
market circulation of vegetables. Those that will not sprout
within three days (i>3) were considered proper for market
distribution, referred to as pre-sprouting eyes; whereas by-sprouting eyes consisted of the potato eyes that will sprout within three days (0<i≤3). Thus, the number of pre-sprouting eyes and by-sprouting eyes were 59 (d4) and 322 (d3+d2+d1),
respectively. The allocation of potato eyes for training set and prediction set in classification models were shown in Table 1.
Table 1 Training set and prediction set in classification models
Potato eyes Training sets Prediction sets
Pre-sprouting eyes (Class I) 40 19
By-sprouting eyes (Class II) 214 108
2.2 Data collection
A customized visible and near-infrared hyperspectral imaging system was applied (shown in Figure 2). The system consists of a translation stage and a lifting stage to move samples, a camera lens (V23-f/2.4 030603, Specim Ltd., Oulu, Finland), an imaging spectrometer (Imspector V10E-QE, Spectral Imaging Ltd., Oulu, Finland), a digital charge-coupled device (CCD) camera (C8484-05G, Hamamatsu Photonics, Hamamatsu, Japan), a computer, illumination units of two 150 W halogen lamps (P/N 9130, Illumination Technologies, Inc., Elbridge, NY, USA) and a dark case to diminish external interference. The line scanning imaging spectrometer had a spectral range of 400-1000 nm, with a spectral resolution of approximately 0.58 nm. The size of the acquired images is 1344×700 pixels with a resolution of 9.25 pixels/mm. The intensity of illumination, the speed of the translation stage, the exposure time of the camera, and the object distance were all set appropriately to obtain high-quality spectral images. In this study, the object distance was set as 420 mm, the speed of the stage was fixed at 3.76 mm/s, and the exposure time was set as 6ms.
1. Translation stage 2. Lifting stage 3. Samples 4. Lens 5. Imaging spectrometer 6. CCD camera 7. Computer 8. Light source 9. Dark case
Figure 2 Hyperspectral imaging system for potatoes
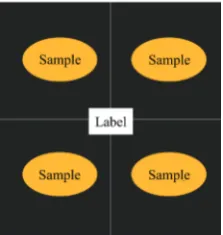
To make sure the positions of all samples are fixed, samples were conglutinated to the black paperboard using plastic adhesive. Four potatoes were fixed onto one paperboard to increase capturing efficiency, with paperboards labeled from 1 to 38 (shown in Figure 3). Samples were put into the manual climatic box for storage after image collection.
2.3 Data preprocessing
Spectral calibration was performed for correction of dark current and light source effects using the following formula:
0
I D
I
W D
− =
− (1) where, I is the relative reflectance intensity of each wavelength; I0 is the original reflectance intensity; D is the intensity of dark current, which is obtained by covering the lens with its cap; while
W stands for the reflectance intensity of standard white panel
(Spectralon, Labsphere Inc., North Sutton, NH, USA). All images were captured and calibrated by Spectracube 2.75b (Spectral Imaging Ltd., Oulu, Finland).
A wavelength range of 600-750 nm was chosen for further analysis, considering the low signal to noise ratio near both ends. Averaged spectra were calculated on the hand-selected ROI (region of interest) of 9×9 pixels (representing potato eye), which was carried out on ENVI 4.6 (Research Systems, Inc., Boulder, CO, USA). Reflectance spectra were normalized within spectral curves to eliminate the influence of illumination intensity. Before optimal wavelengths selection, the spectra were preprocessed by Savitzky-Golay smoothing filter to enhance signal to noise ratio and eliminate the random noise.
2.4 Feature extraction and classification
Extracted full spectra may lead to multicollinearity and poor model performance, therefore, successive projections algorithm (SPA) was first used for wavelength selection in this study. It can minimize the collinearity among variables with simple operation[18]. The discriminant model was developed using the selected wavelengths and the root-mean-square error (RMSE) was calculated. The RMSE serves to aggregate the magnitudes of the errors in predictions for various times into a single measure of predictive power. The calculation of RMSE is given in Equation (2). Then, the parameters were modified until the minimal and steady RMSE was acquired. The final selected wavelengths were chosen for further analysis.
2
1
1 N ( )
i i i
RMSE p O
N =
=
∑
−
(2)
where, pi is the predicted data; Oi is the observed data and N is the number of observations.
A newly-developed sine fit algorithm (SFA) was also applied to fit reflectance spectra, and then optimal fitting parameters were extracted as characteristic features. The principle of this method is based on the fitting procedure between reflectance spectra and a combination of sine functions with various amplitudes, frequencies and phases. The essence is to establish the functional relationship between reflectance and wavelengths. Since different spectral curves represent varied functions, the coefficients in these functions can be extracted to characterize corresponding spectral curves. The combined sine function used in this study was shown as follows:
1
( ) in i sin( i i)
f x =
∑
=r⋅ s x t⋅ +(3) where, ri, si and ti are fitting parameters that can be calculated using
nlinfit function in Matlab R2014a (MathWorks, Inc., Natick, MA, USA). These parameters were selected as the features for
sprouting precautionary analysis. The parameter n is also
determined by RMSE, which can be used for fitting degree evaluation.
Finally, the selected features were introduced into classifiers of fisher discriminant analysis (FDA) and least square support vector
machine (LSSVM) for prediction and classification analysis of sprouting potato eyes. FDA is a linear dimensionality reduction technique in terms of maximizing the separation among different classes, while minimizing the differences within classes. LSSVM
was first proposed by Suykens and Vandewalle[19], which is a
modified version of SVM. As a nonlinear function and a more compacted supported kernel, radial basis function (RBF) could handle the nonlinear relationships between the feature indicators and target attributes well, can give a good performance under general smoothness assumptions, and is able to reduce the computational complexity of the training procedure[19]. Therefore, RBF was used as the kernel function in this study. Corresponding operations were carried out on Matlab R2014a and SPSS Statistics 20.0 (IBM Corp., USA).
3 Results and discussion
3.1 Hyperspectral reflectance spectra analysis
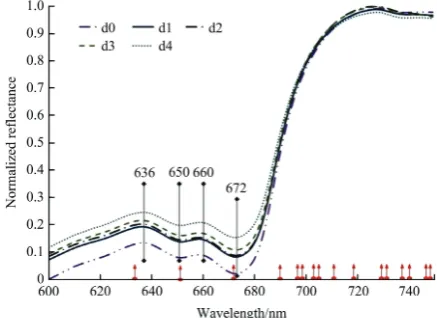
The mean relative reflectance spectra (600-750 nm) of the potato eyes of each potential day before sprouting were shown in Figure 4. All spectra showed similar tendencies, especially within the wavelength range of 690-750 nm, with spectra almost overlapping together. Some visible differences appeared on red spectral bands, covering wavelengths from 600 nm to 690 nm. The reflectance of spectra declined with the approaching of sprouting date (from d4 to d0), with a much lower reflectance on d0. The potential reason may be that sprouts contain red pigments, which accumulate underneath potato eyes with the arrival of sprouting date. The accumulation of red pigments results in the increasing absorption of photons. In addition, all spectra exhibited maximum/minimum values at around 636 nm, 650 nm, 660 nm and 672 nm. The absorption characteristic at 672 nm is attributed to chlorophyll a.
Figure 4 Comparison of the mean relative reflectance spectra of sprouting potato eyes (red arrows indicate selected wavelengths)
3.2 Optimal features selection
SPA was adopted to select optimal characteristic wavelengths. Discriminant model was developed using the optimal characteristic wavelengths and the corresponding RMSE was calculated. The variance of RMSE with respect to the number of selected wavelengths was shown in Figure 5. According to Equation (2), point A was computed as the minimum value and tended to reach a steady state thereafter. Thus, 18 wavelengths were finally appointed for statistical analysis (shown in Figure 4). Specific selected wavelengths were presented in Table 2.
Fitting degree of SFA algorithm was evaluated by RMSE, in
can be seen in Figure 6, the parameter n can be selected as five, indicating that spectral curves can be best fitted using functions in Equation (3) when n=5. Consequently, the fitting parameters ri, si
and ti (i=1,2,3,4,5) were introduced as the characteristic features into classification models. A total of 15 features were used for one spectral curve.
Figure 5 Variance of RMSE with respect to the number of
variables included in the model
Figure 6 Relationship between parameter n and RMSE
Table 2 Selected wavelengths by SPA algorithm
Index 1 25 27 41 58 71 75 79 85
Wavelength/nm 600.1 630.15 632.66 650.27 671.71 688.16 693.23 698.3 705.91
Index 88 90 96 104 107 110 112 118 120
Wavelength/nm 709.72 712.26 719.88 730.06 733.88 737.7 740.25 747.9 749.17
3.3 Classification of sprouting potato eyes
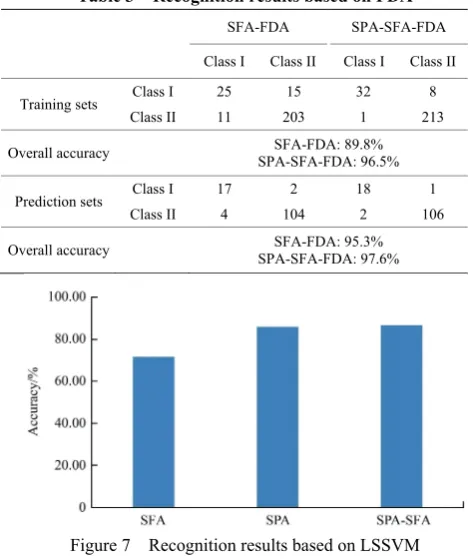
In this study, fitting parameters calculated by SFA, along with the combination with selected wavelengths by SPA were introduced as the indicators into FDA. The recognition results were shown in Table 3. Regularization parameter and RBF kernel parameter are two important parameters determined by two-dimensional nonlinear unconstrained optimization method and
interaction validation of training. L-fold was set as 10 in
tunelssvm function in establishing LSSVM model. The prediction results were shown in Figure 7.
Table 3 Recognition results based on FDA
SFA-FDA SPA-SFA-FDA Class I Class II Class I Class II
Training sets Class I 25 15 32 8
Class II 11 203 1 213
Overall accuracy SPA-SFA-FDA: 96.5% SFA-FDA: 89.8%
Prediction sets Class I 17 2 18 1
Class II 4 104 2 106
Overall accuracy SFA-FDA: 95.3% SPA-SFA-FDA: 97.6%
Figure 7 Recognition results based on LSSVM
The classification accuracy was relatively low as to training sets when taking only fitting parameters into FDA, especially for
pre-sprouting (Class I) potato eyes (37.5% were misclassified as Class II). Whereas, the prediction performance was acceptable, though it may be resulted from proper allocation of training and prediction sets. Generally speaking, fitting parameters calculated by SFA seemed not very effective in classifying Class I and Class II potato eyes. Encouragingly, the addition of selected wavelengths into the classifier of FDA can apparently improve classification accuracies in regard to both training sets and prediction sets. The improvement was even more evident as to Class I, with 17.5% reduction of classification errors into Class II. This implies that utilizing SFA independently cannot classify potato eyes of two classes in a robust way. Characteristic wavelengths selected by SFA play a very important part when conducting prediction of sprouting stages.
Compared with FDA, the performance of the classifier of LSSVM was not good enough, with the highest classification accuracy of 86.52% when taking both SPA and SFA into account. It is noticed that selected wavelengths still outperformed fitting parameters, which once again denoted the importance of characteristic wavelengths. Results indicate that LSSVM is not appropriate in predicting sprouting stages of potato eyes.
represent generality. SPA is just one among plenty of feature selection methods[20], leaving the effectiveness of other selected wavelengths questionable. Similarly, more classifiers shall be introduced into the model to test the effectivity and universality.
4 Conclusions
The sprouting stage of potato eyes determines potato marketability, and precautionary analysis of sprouting can assure potato quality and safety. In this study, hyperspectral imaging was used to predict and classify the sprouting potato eyes. Firstly, potato eyes were divided into two classes according to their expected sprouting dates based on their market circulation. Hyperspectral data were collected and optimized for characteristic features, including optimal wavelengths selected by SPA and fitting parameters obtained by a newly-developed method SFA. Finally, these features were introduced into FDA and LSSVM classifiers to conduct classifications. Results showed that the reflectance spectra declined with the approaching of sprouting date. SFA was more suitable in FDA classifier in regard to predicting spouting stages. SPA-SFA-FDA performed the best among all classifiers, with the overall classification accuracy of 96.5% and 97.6% for training sets and prediction sets, respectively. Given the classification performance and computation complexity, SFA-FDA was preferred to be used in precautionary analysis of sprouting potato eyes in different stages based on hyperspectral imaging. It is worth noting that the study object was potential lateral sprouts on potatoes, future research should focus on potential apical sprouts prediction because apical sprouts dominate firstly after dormancy.
Acknowledgements
The authors acknowledge that this work was financially supported by the National Key Research and Development Plan of China (2016YFD0701603).
[References]
[1] Rady A M, Guyer D E. Rapid and/or nondestructive quality evaluation methods for potatoes: A review. Computers & Electronics in Agriculture, 2015; 117: 31–48.
[2] Farré E M, Bachmann A, Willmitzer L, Trethewey R N. Acceleration of potato tuber sprouting by the expression of a bacterial pyrophosphatase. Nature Biotechnology, 2001; 19: 268–272.
[3] Coleman W K. Dormancy release in potato tubers: A review. American Potato Journal, 1987; 64: 57–68.
[4] Sonnewald U. Control of potato tuber sprouting. Trends in Plant Science, 2001; 6(8): 333–335.
[5] Ha M, Kwak J H, Kim Y, Zee O P. Direct analysis for the distribution of toxic glycoalkaloids in potato tuber tissue using matrix-assisted laser desorption/ionization mass spectrometric imaging. Food Chemistry, 2012; 133: 1155–1162.
[6] Friedman M. Potato glycoalkaloids and metabolites: Roles in the plant and in the diet. Journal of Agricultural & Food Chemistry, 2006; 54: 8655–8681.
[7] Huang T, Li X Y, Jin R, Ku J, Xu S M, Xu M L, et al. Multi-target recognition of internal and external defects of potato by semi-transmission hyperspectral imaging and manifold learning algorithm. Spectroscopy and Spectral Analysis, 2015; 35(4): 992–996.
[8] Jeong J C, Ok H C, Hur O S, Kim C G. Prediction of sprouting capacity using near-infrared spectroscopy in potato tubers. American Journal of Potato Research, 2008; 85: 309–314.
[9] Yu Z H, Hao H L, Zhang B C. Research on sprouted potato non-destructive detection based on euclidean distance algorithm. Journal of Agricultural Mechanization Research, 2015; 11: 174–177. (in Chinese) [10] Jin R, Li X Y, Yan Y Y, Xu M L, Ku J, Xu S M, et al. Detection method
of multi-target recognition of potato based on fusion of hyperspectral imaging and spectral information. Transactions of the CSAE, 2015; 31(16): 258–263. (in Chinese)
[11] Rady A, Guyer D, Lu R. Evaluation of sugar content of potatoes using hyperspectral imaging. Food & Bioprocess Technology, 2015; 8: 995–1010. [12] Dacal-Nieto A, Formella A, Carrión P, Vazquez-Fernandez E,
Fernández-Delgado M. Common scab detection on potatoes using an infrared hyperspectral imaging system. International Conference on Image Analysis and Processing ICIAP 2011: LNCS, vol. 6979, Springer Berlin Heidelberg, 2011; pp.303–312.
[13] Gao H L, Li X Y, Xu S M, Tao H L, Li X J, Sun J F. Comparative study of transmission and reflection hyperspectral imaging technology for potato damage detection. Macromolecular Symposia, 2013; 330: 150–165. [14] Al-Mallahi A, Kataoka T, Okamoto H. Discrimination between potato
tubers and clods by detecting the significant wavebands. Biosystems Engineering, 2008; 100: 329–337.
[15] Qiao J, Wang N, Ngadi M O, Singh S, Baljinder. Water content and weight estimation for potatoes using hyperspectral imaging. ASABE Annual Meeting 2005, Tampa, FL, July 17-20, 2005.
[16] Reust W, Winiger F A, Hebeisen T, Dutoit J P. Assessment of the physiological vigour of new potato cultivars in Switzerland. Potato Research, 2001; 44: 11–17.
[17] Guo H, Cai J M, Wang D G. Analysis of tempo-spatial patterns of beijing external vegetable supply and its effects under massive logistical system. Economic Geography, 2012; 32: 96–101.
[18] Araújo M C U, Saldanha T C B, Galvão R K H, Yoneyama T, Chame H C, Visani V. The successive projections algorithm for variable selection in spectroscopic multicomponent analysis. Chemometrics & Intelligent Laboratory Systems, 2001; 57: 65–73.
[19] Suykens J A K, Vandewalle J. Least squares support vector machine classifiers. Neural Processing Letters, 1999; 9: 293–300.