Implementation of a dualistic model for scale up of a tunnel
drying of cassava chips
Ajala, A. S.
*, Ngoddy, P. O., Olajide, J. O.
(Department of Food Science and Engineering, Ladoke Akintola University of Technology, PMB 4000, Ogbomoso, Oyo State. Nigeria)
Abstract: Tunnel dryer is a combination of two or more cabinet dryers arranged in a serial order in a tunnel. It has been applied
in drying of both food and non-food origin, but its scale up process has hitherto been based on the experimentation and experience without comprehensive scientific background which often leads to the poor performance of those dryers. In this study, theoretical modeling for tunnel drying which could effectively predict the dryer’s performance was developed. The modeling process involved the segmentation of drying parameters into an equipment and material models. Equipment model entails the parameters supplied by the dryer such as air temperature, velocity, humidity profiles and heat transfer to the samples being dried (cassava chips). Material model embraces properties of cassava chips such as drying kinetics and drying equilibrium moisture conditions of the sample. The results of the scale up values are 4860 kg/cycle, 600 kW, 111 kW, 6.075 m3, 150oC and 12 for dryer batch capacity, heater’s wattage, fan’s wattage, dryer’s volume, allowable temperature and
number of trucks respectively. The study identified and itemized critical model parameters necessary for effective scale-up of tunnel drying. More so, the effectiveness of the dualistic model for tunnel drying of cassava chips has been demonstrated and methods are outlined for using the model to scale up from bench scale test through pilot plant testing to full scale dryer operation. Incorrect application of these parameters would impede successful scale-up of this dryer.
Keywords: modeling, drying rate, truck distance, bed length, tunnel dryer, scale up
Citation: Ajala, A. S., P. O. Ngoddy, and J. O. Olajide. 2019. Implementation of a dualistic model for scale up of a tunnel
drying of cassava chips. Agricultural Engineering International: CIGR Journal, 21(3): 150–158.
1 Introduction
A tunnel dryer is a combination of two or more cabinet dryers in a serial arrangement inside a tunnel. It has advantages of drying a large volume of raw material at a time. It is economical because it consumes less power when compared to the power each cabinet dryer would have used if they are operated independently. Recently, the application of tunnel drying to food processing is yet at a primitive level in many countries due to the inadequate knowledge about it, though it was the same dryer employed to dry food in large quantities for the allied army during World War II. Few researches have been done to dry temperate fruits; thus, its application to
Received date: 2017-09-11 Accepted date: 2019-03-14
* Corresponding author: Ajala Adeladun Stephen, Department
of Food Science and Engineering, Ladoke Akintola University of Technology, P.M.B. 4000, Ogbomoso, Nigeria. Email: ajlad2000@ yahoo.com.
dry tropical roots and tubers is limited. Hence, there is need to explore the versatility of this dryer and scale it up for industrial application especially in the drying of cassava chips for which Nigeria is the highest producer worldwide. According to Onwuka (2003), scale-up implies the detailed study and translating of data from laboratory and pilot equipment (dryer in this case) to full-scale industrial process. The starting point in scale-up is a situation in which good processing conditions have been established at the pilot dryer. The task then becomes to get similar results at higher production rates in the scaled-up dryer. The procedure kept some important processing parameters constant at a time and adjusted other parameters (Marco et al., 2010). Laboratory scale experimentation entails low scale production in terms of quantity of dried material processed.
always without detailed study of scientific phenomena governing it. Nowadays, it is necessary that study of most dryers and drying processes are usually carried out in the laboratory before it is eventually scaled-up to industrial or commercial level.
Various researchers have explored the tunnel dryer
for food and non-food applications. Chou et al. (1997)
presented a model for simulating the drying of
hygroscopic-porous food (potato was the sample). Velić
et al. (2007) studied the drying kinetics of granny smith
apple pieces with different pretreatments at temperatures
of 50oC-80oC at a velocity of 2.8 m s-1 parallel to the
samples. Piyush et al. (2016) worked on the design, fabrication and performance analysis of a tunnel dryer. None of these researchers explored the scale up aspect. In the past, Larry et al. (2008) studied the scale-up of layer dryers using a unified approach. Also, Bahu (2007) studied fluidized bed dryer scale-up and Kemp (1992) studied the scale up of pneumatic conveying dryers. None of these researchers dealt directly with tunnel dryers but their approach and methods are commendable and useful in the scale up process. Therefore, it is the intention of this paper to explore basic principles for evaluating heat and mass transfer phenomena in tunnel dryers that can be harnessed for scale-up and industrial application deriving from fundamental theoretical and mathematical conceptions.
2 Materials and methods
2.1 Materials
Mature cassava roots (Manihot esculenta Crantz)
TME 7 variety that were free from defects were used
obtained from the Ladoke Akintola University of Technology Teaching and Research Farm Ogbomoso, Nigeria. The moisture content of the roots determined using AOAC (2005) method was 75% (wb).
2.2 Methods
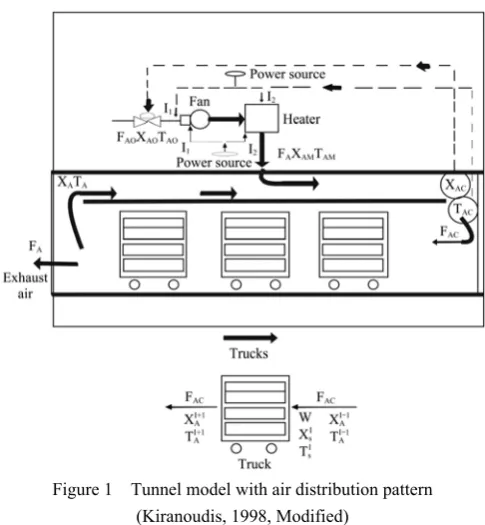
2.2.1 Mathematical modeling of the drying process A schematic diagram of air distribution patterns of a tunnel dryer is as shown in Figure 1. The mathematical model was based on the configuration of the dryer. The prototype dryer has a number of trucks, each of which is equipped with six tiers of trays that behave differently at different points in the dryer. The cassava chips were
trayed and placed uniformly in the dryer. Hot air is blown over the trayed chips using centrifugal fans. Each truck enters the drying chamber at the inlet-end and advanced at a predetermined time intervals along the tunnel length of the dryer in a direction parallel to that of the drying air for the co-current operational drying mode. When the chips in the first truck reach the desired moisture content, it is removed from the dryer.
Figure 1 Tunnel model with air distribution pattern (Kiranoudis, 1998, Modified)
The second truck is then advanced towards the exit when a new truck is introduced into the dryer at the inlet-end. The drying air is partially recycled with a proportion of it exhausted at the exhaust ports and made up with fresh air intake at the air-intake port. The air is heated by an electric heater of 3 kW capacities.
2.2.2 Formulation of tunnel dryer model
The approach developed by Bahu (2007) and Papadakis et al. (1994) for scaling-up of drying processes was modified and adapted. These investigators applied the concept of ‘Separation Process Service (SPS) Model’ which identified and categorized modeling of tunnel drying into two major parts namely; the equipment and material models. The procedures involved are outlined as follows.
(i) Equipment model: this determines factors, which are specific to the kind of drying equipment used, included
• Air velocity and humidity patterns in the dryer;
• Heat transfer to the material being dried.
The mathematical model for tunnel drying involves simultaneous heat and mass transfer analyses between cassava chips and heated drying air flowing in the tunnel. In modeling the drying process, a first order kinetics is assumed for drying the cassava chips in phases which embrace heat and mass transfer balances.
When the first truck is loaded into the dryer, the mass balance for air passing through the truck is given by the relationship in Equation (1) as equally reported by Caceres-Huambo and Menegalli (2009) which suggests that moisture evaporating from the cassava chips within the truck is conveyed to the gas phase such that:
( ) 0
AC A dX
F X W
dt
+ = (1)
This equation holds for every truck entering the dryer. The material transport (that is, the truck movement) through the tunnel length of the dryer is governed by Equation (2) with these boundary conditions in Equations (3) & (4):
*
dz u dt= (2)
boundary conditions
max i
A A
T ≤T (3)
i i
e
X ≥X (4)
To ensure uniform drying within the dryer, it is necessary that the temperature difference between successive trucks in the dryer is not excessively steep. Equation (5) defines the limit of temperature gradient allowable:
i N Δ max
A A A
T −T ≤ T (5)
Thermal load requirement
3 * 0.9
f
E = IVt (6)
Eh = IVt (7)
where, I is the current (Ampere); V is the voltage (Volt);
t is time (s).
(ii) The material model: this includes factors specific to the material being dried, which include:
• Drying kinetic of the material; and
• Drying equilibrium moisture content (EMC) at
steady state (temperature and humidity).
The moisture removed over drying period is governed by the Equation (8):
( )
i i
m e
dX
K X X
dt = − (8)
The Kim used in Equation (6) is a function of drying
time and chip moisture content as given by Page (1949) in Equation (9):
0
1
log( i e)
i m
e
X X
K
t X X
− =
− (9)
To determine Xe, four isotherm equations were used
and experimental data were fitted into those equations to determine the goodness of fit.
1
1( / (1 ))c
e w w
X =k a −a (10)
2 2
2* b * d
e w w
X =a a +c a (11)
3
3 3 3
( )( / (1 ))c
e w w
X = a +b t a −a (12)
4 4 4
4 4 4 4
(1 )(1 )
w e
w w w
a b c a X
c a c a b c a
=
− − + (13)
(iii) The new model
Combinations of the equipment and material models form the overall new models (Equations (1)-(13)). At this stage, the prototype dryer is divided into a number of unit
lengths (dz) as shown in Equation (2), and a marching
calculation is done along the tunnel length of the dryer starting at the inlet-end or (wet-end) to the outlet-end or (dry-end) of the dryer where the desired moisture content
is achieved. Each dz has a corresponding drying time dt.
2.2.3 Scale-up procedure from bench scale and pilot plant
The procedure for scaling up of the tunnel dryer evolved from the methods of Bahu (2007) which have been proved to be successful in industrial application. The processes are as follows.
(i) Establishing a laboratory tunnel dryer:
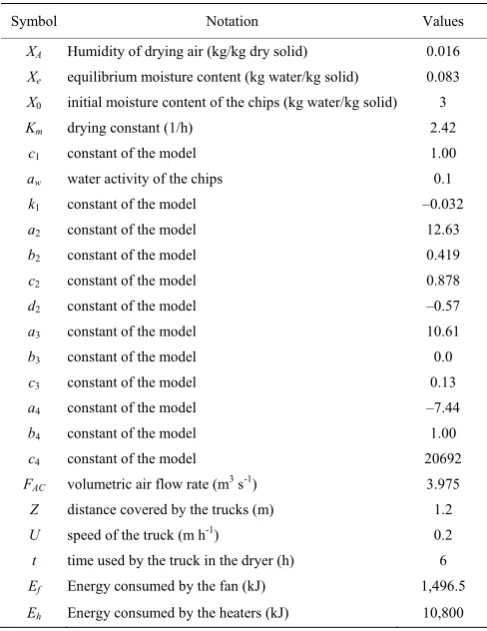
In this case, a prototype tunnel dryer with three trucks was set up with adequate instrumentation to monitor temperature, humidity and air velocity. The values used for the scale-up process are as shown in Table 1.
(ii) Determination of drying time:
Table 1 Process data for the tunnel dryer scale-up
Symbol Notation Values
XA Humidity of drying air (kg/kg dry solid) 0.016
Xe equilibrium moisture content (kg water/kg solid) 0.083
X0 initial moisture content of the chips (kg water/kg solid) 3
Km drying constant (1/h) 2.42
c1 constant of the model 1.00
aw water activity of the chips 0.1
k1 constant of the model –0.032
a2 constant of the model 12.63
b2 constant of the model 0.419
c2 constant of the model 0.878
d2 constant of the model –0.57
a3 constant of the model 10.61
b3 constant of the model 0.0
c3 constant of the model 0.13
a4 constant of the model –7.44
b4 constant of the model 1.00
c4 constant of the model 20692
FAC volumetric air flow rate (m3 s-1) 3.975
Z distance covered by the trucks (m) 1.2
U speed of the truck (m h-1) 0.2
t time used by the truck in the dryer (h) 6
Ef Energy consumed by the fan (kJ) 1,496.5
Eh Energy consumed by the heaters (kJ) 10,800
From the drying rate curves, the outlet average moisture content of the chips as a function of drying time was calculated.
(iii) Pilot plant experimentation:
Although Papadakis et al. (1994) holds a contrary view on this, it would be seem advisable in this uncharted case to perform pilot plant test. According to Papadakis et al. (1994), the pilot plant only serve to determine the material transport characteristics through the length of the dryer since the drying behavior of the material has been earlier established. The bench-scale (or prototype study) consisted of three trucks. Having determined the drying patterns for the material with three trucks, the experiments were next extended to six-truck-dryer which served as a pilot test to compare the drying rate along the increased length of the dryer to determine whether it replicated that of the bench scale tests involving only three trucks. Thereafter, the experiments were extended to a nine-truck-dryer which served as a second pilot test to re-verify and confirm drying rate patterns along the further extended dryer length. Step-wise decreased in moisture content was simulated and the corresponding differential length “dz” was obtained since the length ‘z’ was a function of time. Finally, a summation of
cumulative differential lengths gave the total length of the dryer. Data collected in this process were used as input parameters to simulate the industrial drying process in a tunnel dryer.
3 Results of scale-up model for tunnel drying
of cassava chips
The scale up data of the tunnel dryer for cassava chips are discussed with reference to two particular parameters in mind, namely: drying rate as the trucks advanced from the wet-end to dry-end and the distance covered by the truck in the dryer. Proper evaluation of these results are closely related when the predicted values are compared to the experimental values
3.1 Comparison of the drying rate between
experimental and simulated values
Table 2 shows the change in drying rate (dx/dt) of the
experimental and simulated data. Considering the 3-truck
dryer, the experimental (denoted as expt) values of dx/dt
changed from highest value of 1.52 to 0.07 kg h-1 within
4 hrs while the simulated (denoted as sim) values of dx/dt
changed from 1.52 to 0.09 kg h-1 within 4 h. Evaluation
of correlation between the experimental and simulated values using statistical tools shows that the value of
coefficient of determination (R2) is as high as 0.977, and
the values of chi square (χ2), mean bias error (MBE) and
root mean square error (RMSE) are 0.0084, 0.0014 and
0.0374 respectively. The values of T calculated (Tcal) and
T critical (Tcri) are –1.783 and 2.132 respectively. These
statistical criteria have demonstrated that there was close relationship between experimental and simulated values.
Also, the experimental values of dx/dt for six truck-dryer
varied from 1.08 to 0.01 kg h-1 whereas the simulated
values varied from 1.083 to 0.095 kg h-1. The values of R2,
χ2,MBE, RMSE, Tcal and Tcriare 0.924, 0.0172, 0.0064,
0.0804, –3.579 and 2.365 respectively. The model is adjudged to be reliable as demonstrated by the high value
of R2 and the T test showed that Tcal was less than Tcri.
More so, the experimental values of dx/dt for nine-truck
dryer started with 0.8 kg h-1 and ended with 0.104 kg h-1
whereas, the simulated values started with 0.8 kg h-1 and
ended with 0.08 kg h-1. The goodness of fit of the
values of R2, χ2,MBE, RMSE, T
cal and Tcri are 0.977,
0.0139, 0.0069, 0.0835, –4.329 and 2.228 respectively.
Considering the high value of R2 and lower values of χ2,
MBE and RMSE, it could be concluded that the model
was reliable (Ajala et al.,2012a).
It was observed from Table 2 that changes in drying
rate (dx/dt) of these 3 dryers varied from each other.
From the table, the dx/dt was highest in 3-truck dryer
with initial experimental value of 1.52 kg h-1 followed by
6-truck dryer with experimental value of 1.083 kg h-1.
The least value was observed in 9-truck dryer with
experimental value of 0.8 kg h-1 in 9-truck-dryer. It is
obvious that the change in drying rate was highest in 3-truck dryer; that is, the change in drying rate was faster in 3-truck-dryer than others. The reason seems that the higher the number of the trucks inside the drying chamber, the less the drying air medium reached the trucks especially those trucks that were far from the heat source as a result of air pressure drop across each truck. This is similar to the findings of other authors such as Fellows (2000), and Sing and Heldman (2009).
Table 2 Scale up results for change in drying rate (dx/dt) for three, six and nine-truck dryers
Three-truck-dryer Six-truck-dryer Nine-truck-dryer Time
(hr) Expt dx/dt
(kg h-1) Sim (kg hdx-1/dt) Expt (kg hdx-1/) dt Sim (kg hdx-1/dt) Expt (kg hdx-1/) dt Sim (kg hdx-1/dt)
1 1.52 1.52 1.08 1.083 0.8 0.8 2 0.54 0.72 0.54 0.655 0.64 0.72 3 0.14 0.32 0.16 0.427 0.56 0.64 4 0.07 0.09 0.14 0.399 0.48 0.56 5 0.00 0.00 0.068 0.271 0.44 0.48 6 0.02 0.143 0.364 0.40
7 0.01 0.095 0.12 0.32
8 0 0.00 0.104 0.24
9 0.00 0.16
10 0.00 0.08
11 0.00 0.00
Statistical values:
Tcal=–1.78, Tcrit=2.132,
R2=0.977, χ2=0.0084,
MBE=0.0014, RMSE=0.0374
Statistical values:
Tcal =–3.579, Tcrit=
2.1635, R2=0.924, χ2=
0.0172, MBE=0.0064, RMSE=0.0804
Statistical values:
Tcal=–4.329, Tcrit=
2.228, R2=0.977, χ2=
0.0139, MBE=0.0069, RMSE=0.0835
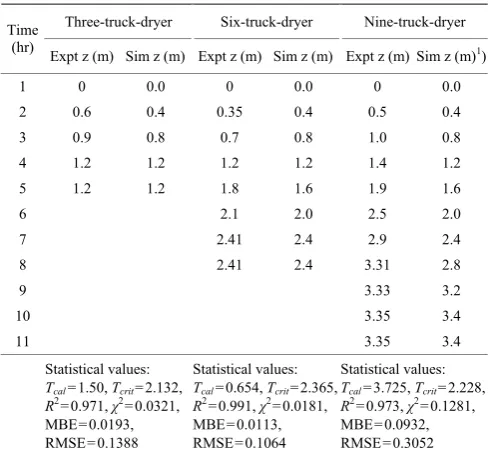
3.2 Comparison of truck distance between
experimental and simulated values
Results of experimental and simulated progressive distances covered by the trucks are as presented in Table
3for dryers with three, six and nine trucks, respectively.
The trucks with fresh chips moved from the inlet -end to attain a total experimental value of 1.2 meters along the
bed length after which dried chips were off-loaded in 4 h with 3-truck dryer. The same value was observed in the simulated value. The goodness of fit of the simulated to the experimental values is demonstrated by the values of
statistical criteria in the table. The values of Tcal, Tcri, R2,
χ2, MBE and RMSE were 1.5, 2.132, 0.971, 0.0321,
0.0193 and 0.1388, respectively. Also, the trucks covered the distance of 2.41 m in 7 h in the experiment data when 6-truck dryer was used, however, 2.4 m was observed for the simulated data. The proof of the goodness of fit of simulated to experimental is demonstrated from the values of statistical criteria generated and is as follows:
Tcal, Tcri, R2, χ2,MBE and RMSE with these values 0.654,
2.365, 0.991, 0.0181, 0.0113 and 0.1064 respectively. Table 3 further shows the data generated from the 9-truck-dryer. The experimental and simulated values of the distance covered by the truck in dryer shows that the experimental distance covered by the truck was 3.35 m in 10 h whereas 3.4 m was observed in the simulated value. The values of statistical criteria to show the goodness of
fits are as follows Tcal, Tcri, R2, χ2,MBE and RMSE with
the corresponding values of 3.725, 2.228, 0.973, 0.1281, 0.0932 and 0.3052 respectively. A model is confirmed to
be reliable when the value of R2 is high. The values of χ2,
MBE and RMSE were low and the values of Tcri were
greater than Tcal (Ajala et al., 2012b).
Table 3 Scale up results for distance covered (z) for three, six and nine-truck dryers
Three-truck-dryer Six-truck-dryer Nine-truck-dryer Time
(hr)
Expt z (m) Sim z (m) Expt z (m) Sim z (m) Expt z (m) Sim z (m)1)
1 0 0.0 0 0.0 0 0.0
2 0.6 0.4 0.35 0.4 0.5 0.4
3 0.9 0.8 0.7 0.8 1.0 0.8
4 1.2 1.2 1.2 1.2 1.4 1.2
5 1.2 1.2 1.8 1.6 1.9 1.6
6 2.1 2.0 2.5 2.0
7 2.41 2.4 2.9 2.4
8 2.41 2.4 3.31 2.8
9 3.33 3.2
10 3.35 3.4
11 3.35 3.4
Statistical values:
Tcal=1.50, Tcrit=2.132,
R2=0.971, χ2=0.0321,
MBE=0.0193, RMSE=0.1388
Statistical values:
Tcal=0.654, Tcrit=2.365,
R2=0.991, χ2=0.0181,
MBE=0.0113, RMSE=0.1064
Statistical values:
Tcal=3.725, Tcrit=2.228,
R2=0.973, χ2=0.1281,
MBE=0.0932, RMSE=0.3052
source, the more residence time it took in the drying
chamber. This also account for the low values for dx/dt in
9-truck dryer compared to other dryers. This is because, as the trucks moved away from the heat source, the temperature profile reduced in such that, the farther the truck move away from the heat source, the less the drying rate. This shows that in co-current mode of drying,
change in drying rate (dx/dt) and the distance from the
heating source (z) are inversely related. This has been
earlier observed by Fellow (2000), and Sing and Heldman (2009).
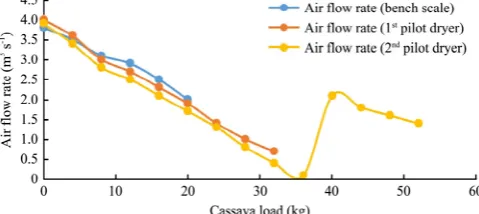
3.3 Effect of airflow rate in the scale up process
The effect of air flow rate to dry the cassava chips in the scale up process is as shown in Figure 2. In the 3-truck tunnel dryer (bench scale), the maximum fresh cassava chips allowable was 16.2 kg and the air flow decreased as the mass of cassava chips increased in the truck. Notwithstanding, the cassava chips got dried successfully despite to the reduction in air flow from
3.8 m s-1 to 2.0 m s-1 across the 2.4 m length of the dryer.
The same trend was observed in the 6-truck dryer (1st
pilot dryer), the maximum fresh cassava chip that was
dried was 32.4 kg with initial air flow rate of 3.9 m s-1.
But the air flow continued to drop across each truck to
the extent that it reduced to 0.7 m s-1 in the 6th truck.
Nevertheless, there was a successful drying of the chips in all the trucks at the exit of the tunnel. The 9-truck
dryer (2nd pilot dryer) had a capacity of 48.6 kg fresh
cassava chips. The drying air flow rate before entering
the drying chamber was 3.8 m s-1 and it continued to
drop across the tunnel length until it reached a point where drying process was none existing as a result of a
complete drop in air flow. Since the drying air was the
only medium in which the chips were being dried, its inability to flow through the length of tunnel as a result of pressure drop resulted in saturated humidity in the chamber and hence; no drying took place further. Since the drying air was the only medium, the chips were being dried, its complete none flow as a result of air pressure drop resulted in saturated humidity in the chamber and hence; no drying took place further. To avert this, another 0.375 kW centrifugal fan capacity was installed at the middle of the dryer to boost air flow rate to accomplish the drying process of the chips.
Figure 2 Effect of air flow rate on cassava chip load
The pattern of loads being dried was directly proportional to the useful drying air available. It was observed that these tunnel dryers required strong air velocity to overcome pressure drop across the trucks in the dryer. The longer the tunnel, the vigourer the drying air must be; otherwise, it would not reach the end of the tunnel and drying would not be effective. Ajala et al. (2013) observed that the velocity at which the hot air moved across the food surface affected the rate of moisture removal because of its enhanced effect on the external mass transfer rate.
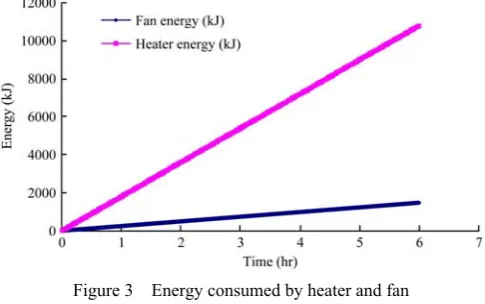
3.3 Energy consumed in the scale-up process
Figure 3 shows the distribution of energy consumed by the fan and the heater. The figure shows vividly that after six hours, the fan had consumed 1,496.5 kJ whereas the heater had consumed 10,800 kJ representing a 721% excess over the fan. This was the experience with bench
scale (3-truck-dryer) and 1st pilot (6-truck-dryer).
However, the case was different when the 2nd pilot dryer
(9-truck-dryer) was employed. The drying rate pattern was drastically reduced and drying rate at the less hot end was practically none existent because air temperature and velocity were marginal. Therefore, to correct this anomaly, a supplementary 3 kW heater was placed in the middle of the test dryer with adjustable distance
specifically between the 5th and 6th trucks. Thereafter, an
effective drying rate pattern was established. Otherwise, to scale up the process would have been impossible because the drying rate pattern would have been drastically different with drying rate pattern in both
3-truck and 6-truck dryers, respectively. It is commonly
unbound water evaporation that is involved but also for capillary bound water removal, heating of the wet material as its temperature changes in the course of drying, local superheating of the vapour and overheating of already dried top layers of the chips. In view of this, Kudrat and Ratii (2006) suggested that energy utilization was multifaceted involving a function of material properties (such as size, shape, and moisture binding, initial and final moisture contents), dryer design (configuration, type and mode of heating) and drying process variables (temperature, air velocity and humidity). The energy of the dryer is recorded as an average value over drying time intervals because the system was operated as a batch process. Since time is a major factor, materials which dried in less time consumed less energy. From all these observations, it can be concluded that products of lower heat sensitivity would dry at higher temperatures with lower energy cost. On the contrary, products of high temperature sensitivity should be dried at lower temperatures to maximize quality. In these cases, a trade-off must be made between quality and the aggregate cost of energy.
Figure 3 Energy consumed by heater and fan
3.4 Air humidity pattern in the tunnel dryer
The pattern of relative humidity along the bed length of the tunnel dryer is as shown in Figure 4. In this graph, humidity decreased as the truck advanced from hot end to the less hot end. This is because as the fresh load advanced towards the less hot end, the rate of moisture removal was lower because of significant low temperature and minimally reduced relative humidity. Hence, air humidity decreased. This was because as the drying material in the trucks moved away from the hot end to a less hot end, moisture was lost from the product and therefore the surrounding air humidity was less
saturated. Decrease in air humidity at the less hot end made the drying possible along the length of the dryer otherwise the chips could have picked up moisture from the air and consequently negating the drying. The same
reason would explain the humidity pattern in the 1st pilot
and 2nd pilot dryer. Air humidity affected drying because
the higher the drying air humidity, the slower drying proceeded and therefore a longer time was required for drying. This same observation was reported from other researcher such as Caceres-Huambo and Menegalli (2009). Another function of air relative humidity is that an increase in the relative humidity of air would decrease the water vapour pressure gradient between the food surface and its surrounding air thereby reducing the rate of external mass transfer. In contrast, a decrease in the relative humidity of the drying air would increase the gradient between the food surface and its surrounding air and hence to enhance the rate of drying (Ajala et al., 2013).
Figure 4 Humidity pattern in the scale up process
3.5 Reasons for deviation from basic scale-up
procedure
There are a number of reasons why steps must be taken to ensure that differences between the performance of a pilot and full-scale operations are addressed. According to Bahu (2007), any scale up produces some uncertainties because of the behavior differences between the available test materials. Another important reason is the observed fluctuation of change in drying rate along
thebed length of the dryer which could have been caused
by heat loss across the tunnel wall. Therefore, there should be adequate prevention of heat loss through proper insulation design of the drying chamber.
3.6 Specification of pilot and proposed industrial
dryer
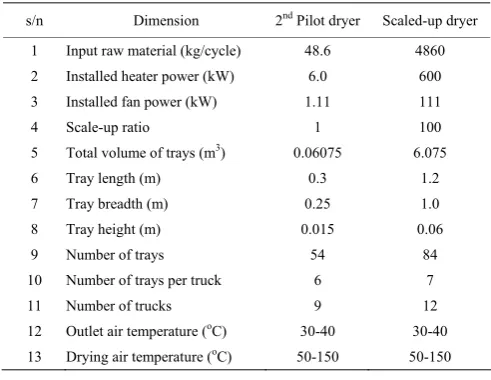
their trucks found that there was a close relationship between experimental and simulated value. Then, the 9-truck dryer values were used for the scale up to industrial dryer. The scale up process of the proposed dryer is as shown in Table 4. The scale-up process was brought about by increasing the capacity and other features of the 9-truck dryer in a ratio 1 to 100 to give the features of the industrial dryer. This is according to the recommendations of Bahu (2007) in which scale-up was based on a ratio of 1:100.
Table 4 Specifications of the pilot and new dryer
s/n Dimension 2nd Pilot dryer Scaled-up dryer
1 Input raw material (kg/cycle) 48.6 4860 2 Installed heater power (kW) 6.0 600 3 Installed fan power (kW) 1.11 111
4 Scale-up ratio 1 100
5 Total volume of trays (m3) 0.06075 6.075
6 Tray length (m) 0.3 1.2 7 Tray breadth (m) 0.25 1.0 8 Tray height (m) 0.015 0.06 9 Number of trays 54 84 10 Number of trays per truck 6 7 11 Number of trucks 9 12
12 Outlet air temperature (oC) 30-40 30-40
13 Drying air temperature (oC) 50-150 50-150
4 Conclusions
From this study, critical model parameters for the scale up of cassava tunnel drying were identified with
reference to the drying rate pattern (dx/dt) and the
distance covered (z) by the trucks in the tunnel length. The effective drying ability experienced in the bench
dryer was replicated in both 1st and 2nd pilot dryers; hence,
the scale up process was successful. Also, the reliability of the dualistic model were proved using statistical
criteria such as R2, and the result showed that the models
were reliable as the values of the R2 was greater than 90%
between experimental and simulated data in all cases. It was also concluded that adequate insulation, precise time movement, steady air flow rate, low humidity and un-fluctuating temperature profile along the length of the dryer were the keys to an effective scale up strategy of a dryer.
References
Ajala, A. S., F. A. Ajala, and T. Y. Tunde-Akintunde. 2012a. Study on drying kinetics of fermented corn grains. Food Science and
Quality Management, 5: 10–18.
Ajala, A. S., P. O. Ngoddy, and J. O. Olajide. 2012b. Statistical modelling and simulation of drying cassava chips in tunnel dryer. International Journal of Emerging Trend in Engineering and Development, 7(2): 585–593.
Ajala, A. S., P. O. Ngoddy, and J. O. Olajide. 2013. Study of drying parameters in tunnel drying. International Journal of Advanced Scientific and Technical Research, 3(2): 264–271. AOAC. 2005. Official Methods of Analysis. 16th ed. Richmond
Virginia: Association of Official Chemists International. Bahu, R. E. 2007. Fluidised bed dryer scale-up. Drying Technology,
12(1-2): 329–339.
Cáceres-Huambo, B. N.,and F. C. Menegalli. 2009. Simulation and optimization of semi-continuous industrial tunnel dryers for fruits. Drying Technology, 27(3): 428–436.
Chou, S. K., M. N. A. Hawlader, and K. J. Chua. 1997. On the drying of food product in a tunnel dryer. Drying Technology, 15(3-4): 857–880.
Fellows, J. P. 2000. Food Processing Technology, Principle and Practice. 2nd ed. Cambridge England: Woodhead Publishing Limited.
Kemp, I. C. 1992. Scale-up of pneumatic conveying dryers. Drying Technology, 12: 1–2.
Kiranoudis, C. T. 1998. Design of batch grape dryer. Drying Technology, 16(7 and 8): 1695–1718.
Kudra, T., and C. Ratti. 2006. Foam-mat drying: energy and cost analyses. Canadian Biosystems Engineering Journal /Le génie des biosystèmes au Canada, 48: 327–332.
Larry R. G., E. B. Wayne, P. H. John, K. Ian, M.A. Kemp, L. Tim, S. Christian and L.F. Smith. 2008. Psychrometry, evaporative cooling, and solids drying. In Perry's Chemical Engineers' Handbook, 8th ed, ch. 12, 50–53. New York: McGraw Hill. Marco, G., V. João, and G. Filipe. 2010. Scale-up methodology for
pharmaceutical spray drying. Chimica oggi/Chemistry Today, 28 (4): 18–23.
Onwuka, N. D. 2003. Essential of Food and Related Processes Engineering. The Academic Publisher Nigeria Ltd. Enugu, Nigeria.
Page, G. 1949. Factors influencing the maximum rates of drying shelled corn in layer. West Lafayette, USA: Department of Agricultural Engineering.
Papadakis, S. E., T. A. G. Langrish, I. C. Kemp, and R. E. Bahu. 1994. Scale-up of cascading rotary dryers. Drying Technology, 12(1-2): 259–277.
Piyush, S. T., S. S. Deshmukh, and J. Pratik. 2016. Design, fabrication and performance analysis of solar tunnel dryer using various absorber materials. International Advanced Research Journal in Science, Engineering and Technology, 3(6):190–196.
Incorporated.
Velić, D., M. Bilić, S. Tomas, M. Planinić, A. Bucić-Kojić, and K.
Aladić. 2007. Study of the drying kinetics of “granny smith” apple in tray drier. Agricultural Conspectus Science, 72(4): 323–328.
Nomenclature
FAC Flow rate of drying air stream (m3 s-1)
FAO Flow rate of fresh air stream (m3 s-1)
i m
K Drying constant (1/h)
TA Temperature of inlet air stream (oC)
max A
T Maximum air temperature allowable before degradation sets in (oC)
i A
T Temperature of the air (oC)
TAO Temperature of fresh air stream (oC)
t Drying time (hours)
u Velocity of the truck in the tunnel
Wi Truck load (kg db)
Xi Local moisture content of the cassava chips in truck i at time t (kg/kg db)
i A
X Relative humidity of air stream in truck i (%)
XAC Relative humidity of drying air stream (%)
XAO Relative humidity of fresh air stream (%)
Xe Equilibrium moisture content of the chips (kg/kg db)
( )
i s
X tr Material moisture content at the transition time (kg/kgdb)
( )
i s
X t Targeted material moisture content (kg/kgdb)