Predicting Short-term Market Returns and Volatility Using Index of
Consumer Sentiment
Rama Krishna Yelamanchili1 1
Associate Professor of Finance, Department of Accounting & Finance, ICFAI Business School, ICFAI University, Hyderabad, Telangana, India
Correspondence: Rama Krishna Yelamanchili, Associate Professor of Finance, Department of Accounting & Finance, ICFAI Business School, ICFAI University, Hyderabad, Telangana, India. E-mail: [email protected], [email protected]
Received: May 15, 2019 Accepted: June 9, 2019 Online Published: July 2, 2019
doi:10.5430/afr.v8n3p72 URL: https://doi.org/10.5430/afr.v8n3p72
Abstract
This study examines the short-term predictive ability of Index of Consumer Sentiment (ICS) about Indian stock market returns. Monthly values of ICS, six broad market indices, and nine sectorial indices are collected. The paper finds significant contemporaneous co-movement between S&PBSE500 and other indices. There is no contemporaneous co-movement between ICS and 15 indices. With one lag, ICS Granger cause two sectorial indices and four broad market indices. The one period ahead predictive regression model finds that sentiment has some predictive power of small cap, mid cap and BSE500 index returns. The effect is negative and statistically significant. The predictive regression result indicates that following month of high consumer sentiment, small cap, midcap, and BSE500 index returns decline and vice-versa. However, there is no association between ICS and large cap index and sentiment has no predictive ability of large cap index. The result of variance model indicate that ARCH term and GARCH term are insignificant indicating that the market has no long memory and new shocks will not persist to many future periods. The paper finds no volatility clustering and volatility persistence except in case of small cap index. This paper finds presence of noise trade and investors over-reaction in small cap stocks. EGARCH result supports for the presence of leverage effect, and confirms negative impact of consumer sentiment on small cap stocks.
Keywords: efficient market hypothesis, prospect theory, investor sentiment, herd behavior, collectivism
1. Introduction
Traditional finance theory depends on assumptions that investors act rationally, markets are fully efficient and prices hold random walk behavior. According to Efficient Market Hypothesis (EMH), stock prices reflect all available information and it is not possible to earn abnormal gains. Abnormal gains may only possible from taking high risk. The theory proposes that investors are rational and no individual investor has power to affect the stock prices. Moreover, EMH assumes that transaction costs are minimal (Fama, 1970). Empirically there is indication of continued price abnormalities in the stock markets. Previous literature attempt to relate these price anomalies to the presence of investors' under-reaction and over-reaction (Barberis, Shleifer, & Vishny, 1998; Daniel, Hirshleifer, & Subrahmanyam, 1998). Few researchers also attempt to link price anomalies to noise trade theory and find that some investors do indeed trade on noise instead of fundamentals (Black, 1986; De Long, Shleifer, Summers, & Waldmann, 1990).
In contrast to conventional finance theory, behavioral finance approach believes that investors are not rational, they should be considered as normal. Investors take decisions not only based on risk, return and utility maximization; they take decisions based on satisfaction that is shaped by cognitive and emotional biases (Pompian, 2012). According to behavioral finance, stock markets are not fully efficient.
According to Baker and Wurgler (2007), consumer sentiment represents a belief about future cash flows and risk, which is not justified by economic and financial information. Brown and Cliff (2004) considered that “sentiment represents the expectations of market participants relative to a norm: a bullish (bearish) outlook means investors expect returns to be above (below) average, whatever “average" may be”. Brown and Cliff (2005) highlight that investor sentiment is driven by a persistent uninformed demand shocks.
Shleifer (2000) defines investor sentiment as heuristic behavior in which investment decisions depends on belief or rules of thumb rather than Bayesian rationality. Some researchers refer to investor sentiment as the inclination to trade on noise rather than information (Baker, Wurgler, & Yuan, 2012). The proposition of noise trading by Black (1986) introduced a number of behavioral factors that are subsequently developed by other researchers (Campbell & Kyle, 1993; De Long, Shleifer, Summers, & Waldmann 1991).
According to Shleifer and Summers (1990), noise traders tend to be on average more aggressive than arbitrageurs are either because they are overly optimistic or overconfident. Thus, they take on a higher level of risk. If the risk-taking is rewarded by the market, noise traders can earn high returns, thereby acquiring even more confidence, continuing to trade thusly. When noise traders earn high returns, other investors tend to imitate them, ignoring the fact that the gains obtained involved a higher level of risk and have essentially been the result of luck. This imitation brings to the market more application of money in strategies based on noise.
Other researchers refer noise trade to investors’ excessive pessimism (bearish) or optimism (bullish) towards the stock market’s current and future price (Brown & Cliff, 2004; Shefrin, 2008). Olsen (1998) suggested that investors who make decisions under time pressure tend to dip in inevitable emotions that tend into more volatile stock price movements. The asymmetric treatment of gains versus losses is a central concept in the “prospect theory” of asset pricing (Kahneman & Tversky 1979). Kahneman and Tversky (1979) developed the Prospect Theory, which claims that people are loss averse, i.e. losses are felt much more intensely than gains. Second, people judge good and bad things in relative to their current situation. Third, as diminishing marginal utility for gains, each successive unit of loss hurts less painfully than the previous one.
Measuring the effect of consumer sentiment on stock market returns has been an encouraging research interest, perhaps partly due to historical events and empirical puzzles that seem to defy the traditional finance theory of market efficiency. While a number of studies find that consumer sentiment predicts stock market returns in developed countries, there is limited research in emerging economies, especially in India.
According to Chui, Titman, and Wei (2010) a collectivist culture is a driver of investors’ tendency to herding, which in the capital market can lead to the possibility of noise traders’ errors being correlated. Schmeling (2009) examined the extent to which sentiment influenced market returns in countries with different cultures. He find that countries that had high levels of collectivism showed a strong effect of sentiment on stock returns, concluding that countries with a cultural tendency for herding were subject to a strong sentiment-return relationship. According to Hofstede (2001), India has high level of collectivism. This idea is another motivating factor for this paper.
Sentiment measures can be divided into two groups: explicit measures, when the sentiment indicator is derived directly from investor surveys and implicit measures, when the indicator is obtained from indirect proxies. This paper considers explicit consumer sentiment measure i.e., the index of consumer sentiment (ICS) jointly produced by BSE-CMIE-University of Michigan. There are abundance of empirical studies that have noted significant relationships between ICS and stock market returns in developed markets (Chen, 2011; Fisher & Statman, 2003; Ho & Hung, 2012; Hsu, Lin, & Wu, 2011; Jansen & Nahuis, 2003). ICS has been used in research works of Bergman and Roychowdhury (2008), Lemmon and Portniaguina (2006), and Schmeling (2009). Findings of these studies thus provide a strong base for the adoption of the ICS as a proxy of investor sentiment in the context of this study.
2. Literature Review
Factors influencing stock returns and prediction of stock returns have always been an interesting subject of modern security analysis. It is posited that there may be some relation between investors’ expectations and stock market movements. There have been several studies, examining the relation between consumer confidence and market movements. These studies principally focused on consumer confidence index and stock market returns.
Shiller (2005) explains a simple and intuitive feedback model of stock price movements. If prices start to rise, the success of some investors attracts public attention that fuels enthusiasm for the market. New (and often less sophisticated) investors enter the market and help bid up prices. Upward price motion begets expectations of further upward motion to the point where “irrational exuberance” may cause prices to exceed levels that can be justified by fundamentals. However, if prices begin to drop, pessimism can take hold, causing some investors to exit the market. Downward price motion begets expectations of further downward motion, and so on, until a bottom is eventually reached. In his recent work, Shiller (2017) argues that investors’ optimistic or pessimistic beliefs about the stock market are similar to fads that can spread throughout the popular culture like an infectious disease.
Otoo (1999) find strong positive relationship between Michigan University’s consumer confidence index and stock prices and reports that stock returns influence consumer sentiment. An increase in stock prices boosts consumer sentiment. Jensen and Nahuis (2003) find positive correlation between consumer confidence and stock market movements in short-run and reports that stock returns Granger-cause consumer confidence at very short period, but not vice versa. Baker and Verma (2007) indicate that investor sentiment has a positive effect on stock returns but has a negative effect on market volatility for both individual and institutional investors. Baker and Wurgler (2007) find that younger, smaller, more volatile, unprofitable, and non-dividend paying stocks are most sensitive to investor sentiment. Bremmer (2008) reports that there is no long-run relationship between University of Michigan’s measure of consumer confidence and different stock indices, and in short run, stock prices Granger-cause consumer confidence, but not vice versa. Verma and Soydemir (2009) find that individual and institutional investor sentiments are driven by both rational and irrational factors. Lux (2011) finds a feedback relationship between the stock returns and sentiment. Zhu (2012) shows a strong correlation between sentiment index and Shanghai stock market index. Changsheng and Yongfeng (2012) show that investor sentiment has incremental power to explain return co-movement indicating that when investors are bullish the stock return is high and it is low when the investors are bearish. Li (2014) shows that the sentiment index has a good predictive power of Chinese stock market return.
In contrast to above mentioned research findings, Schmeling (2009) find that sentiment negatively forecasts aggregate stock market returns on average. Similarly, Shen, Yu, and Zhao (2017) find that higher levels of investor sentiment tend to predict lower excess returns when comparing high-risk stock portfolios to low-risk portfolios. Lemmon and Portniaguina (2006) find that higher levels of sentiment forecast lower future returns on value stocks but not growth stocks. They posit that investors seemed to overestimate small stocks relative to large stocks during periods of high confidence and vice versa. Fisher and Statman (2003) find that there is a negative and statistically significant relationship between the sentiment level of individual investors and returns in the following month on high capitalization stocks. Brown and Cliff (2005) find that in the stock market there is a statistically significant negative coefficient estimate for β. Therefore, periods of higher investor optimism tend to be followed by significantly lower returns for the aggregate market (Baker & Wurgler, 2006; Lemmon & Portniaguina, 2006).
With regard to time horizon, Fischer and Statman (2003) find that measures of sentiment alone have little predictive power over short horizons. However, Brown and Cliff (2005) report that the market is overvalued during periods of optimism and find that higher levels of sentiment forecast negative returns over longer horizons.
Chui, Titman, and Wei (2008) try to explain the relationship between consumer sentiment and stock returns from culture perspective. Chui, Titman, and Wei (2008) propose that cultural differences might play a role for the relative strength of behavioral biases between countries. They argue that stock markets in collectivistic countries are more heavily influenced by investor sentiment whereas stock markets in individualistic countries should be less affected by behavioral biases.
To sum up the literature, we can conclude that first, different indicators are used as proxy to represent consumer and/or investor sentiments. Second, the effect of sentiment on stock prices is limited, or only for certain type of stocks and for a short period of time the causality exists. Third, generally, instead of from sentiment to stock prices, the direction of causality is from stock returns towards sentiments.
3. Objective
While a number of studies find that consumer sentiment predicts stock market returns in developed countries, there is limited research in emerging economies, especially in India. Moreover, no much research is conducted in the context of collectivist country, considering multiple indices, short period horizon, and modeling volatility with sentiment indicator. This study investigates the contemporaneous co-movements between ICS and market indices, causality between ICS and market indices, and examines whether investor sentiment predicts one period ahead (time horizon) aggregate stock market and sectorial indices returns (multiple indices) in India (collectivist country) by modeling volatility with ICS (sentiment indication). This paper tests the hypotheses that there will be significant contemporaneous co-movements between broad market index and sectorial indices. Similarly, there will be contemporaneous co-movements between ICS and stock indices. Next, there will be causality from ICS to market indices. Finally, this paper tests the hypothesis of short-term predictive ability of ICS of different stock indices. By validating these hypotheses this paper will contribute empirical evidence to the existing theories of market behavior.
4. Data and Empirical Results
This paper focuses on the Indian stock market and investigates the link between consumer sentiment and stock market returns using monthly data from 2016M01 to 2019M01. The Bombay Stock Exchange (BSE), The Centre for Monitoring Indian Economy (CMIE) and University of Michigan are jointly producing Index of Consumer Sentiment (ICS) in India since 2016M01. In this study, I used the ICS as proxy for consumer sentiment and gathered data from its inception in India. Many studies in developed countries use the ICS as a proxy for investor sentiment and show that it can predict stock returns (Brown & Cliff, 2005; Fisher & Statman, 2003; Lee, Jiang, & Indro, 2002; Lemmon & Portniaguina, 2006; Ho & Hung, 2009). For the same period, indices values are collected for 15 market indices of which six are broad market indices and nine are sectorial indices from the BSE. As the data is limited to three-year time-period and number of observations is small, all necessary steps are taken to validate the data. Data availability is one of the limitations of this study. This happened because of producing ICS in India started in year 2016. This limitation is an opportunity to study the ICS in its nascent stage in collectivistic country like India. This also gave me another opportunity i.e. worldwide ICS produced by University of Michigan is considered as one of the meticulous surveys to measure consumer sentiment, this study examines how far ICS measures Indian investors’ sentiment and does it have any predictive ability of Indian stock markets.
4.1 Unit Root Tests
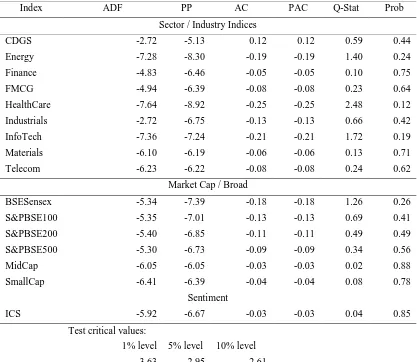
To avoid regression with spurious results, each series is tested for a unit root. Before that, I calculated log returns of all variables using equation 1. For all series considered in this study, unit root tests are conducted to investigate whether these series are stationary or not. Results of the Phillips-Perron (PP) test, Augmented Dickey Fuller (ADF) test, along with Auto Correlation (AC) and Partial Auto Correlation (PAC) are reported in table 1. The results of PP and ADF tests indicate that all the variables are stationary at 1% level of significance, and the null hypothesis of a zero root is rejected.
Table 1. Unit root test results
Index ADF PP AC PAC Q-Stat Prob
Sector / Industry Indices
CDGS -2.72 -5.13 0.12 0.12 0.59 0.44
Energy -7.28 -8.30 -0.19 -0.19 1.40 0.24
Finance -4.83 -6.46 -0.05 -0.05 0.10 0.75
FMCG -4.94 -6.39 -0.08 -0.08 0.23 0.64
HealthCare -7.64 -8.92 -0.25 -0.25 2.48 0.12
Industrials -2.72 -6.75 -0.13 -0.13 0.66 0.42
InfoTech -7.36 -7.24 -0.21 -0.21 1.72 0.19
Materials -6.10 -6.19 -0.06 -0.06 0.13 0.71
Telecom -6.23 -6.22 -0.08 -0.08 0.24 0.62
Market Cap / Broad
BSESensex -5.34 -7.39 -0.18 -0.18 1.26 0.26
S&PBSE100 -5.35 -7.01 -0.13 -0.13 0.69 0.41
S&PBSE200 -5.40 -6.85 -0.11 -0.11 0.49 0.49
S&PBSE500 -5.30 -6.73 -0.09 -0.09 0.34 0.56
MidCap -6.05 -6.05 -0.03 -0.03 0.02 0.88
SmallCap -6.41 -6.39 -0.04 -0.04 0.08 0.78
Sentiment
ICS -5.92 -6.67 -0.03 -0.03 0.04 0.85
Test critical values:
1% level 5% level 10% level
-3.63 -2.95 -2.61
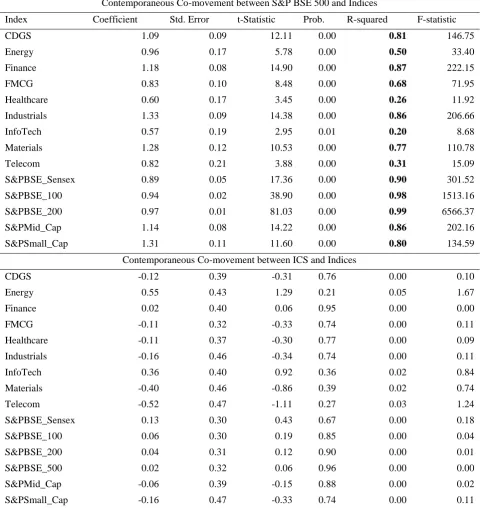
4.2 Contemporaneous Co-Movement Tests
Table 2. Contemporaneous co-movements (BSE500, ICS)
Contemporaneous Co-movement between S&P BSE 500 and Indices
Index Coefficient Std. Error t-Statistic Prob. R-squared F-statistic
CDGS 1.09 0.09 12.11 0.00 0.81 146.75
Energy 0.96 0.17 5.78 0.00 0.50 33.40
Finance 1.18 0.08 14.90 0.00 0.87 222.15
FMCG 0.83 0.10 8.48 0.00 0.68 71.95
Healthcare 0.60 0.17 3.45 0.00 0.26 11.92
Industrials 1.33 0.09 14.38 0.00 0.86 206.66
InfoTech 0.57 0.19 2.95 0.01 0.20 8.68
Materials 1.28 0.12 10.53 0.00 0.77 110.78
Telecom 0.82 0.21 3.88 0.00 0.31 15.09
S&PBSE_Sensex 0.89 0.05 17.36 0.00 0.90 301.52
S&PBSE_100 0.94 0.02 38.90 0.00 0.98 1513.16
S&PBSE_200 0.97 0.01 81.03 0.00 0.99 6566.37
S&PMid_Cap 1.14 0.08 14.22 0.00 0.86 202.16
S&PSmall_Cap 1.31 0.11 11.60 0.00 0.80 134.59
Contemporaneous Co-movement between ICS and Indices
CDGS -0.12 0.39 -0.31 0.76 0.00 0.10
Energy 0.55 0.43 1.29 0.21 0.05 1.67
Finance 0.02 0.40 0.06 0.95 0.00 0.00
FMCG -0.11 0.32 -0.33 0.74 0.00 0.11
Healthcare -0.11 0.37 -0.30 0.77 0.00 0.09
Industrials -0.16 0.46 -0.34 0.74 0.00 0.11
InfoTech 0.36 0.40 0.92 0.36 0.02 0.84
Materials -0.40 0.46 -0.86 0.39 0.02 0.74
Telecom -0.52 0.47 -1.11 0.27 0.03 1.24
S&PBSE_Sensex 0.13 0.30 0.43 0.67 0.00 0.18
S&PBSE_100 0.06 0.30 0.19 0.85 0.00 0.04
S&PBSE_200 0.04 0.31 0.12 0.90 0.00 0.01
S&PBSE_500 0.02 0.32 0.06 0.96 0.00 0.00
S&PMid_Cap -0.06 0.39 -0.15 0.88 0.00 0.02
S&PSmall_Cap -0.16 0.47 -0.33 0.74 0.00 0.11
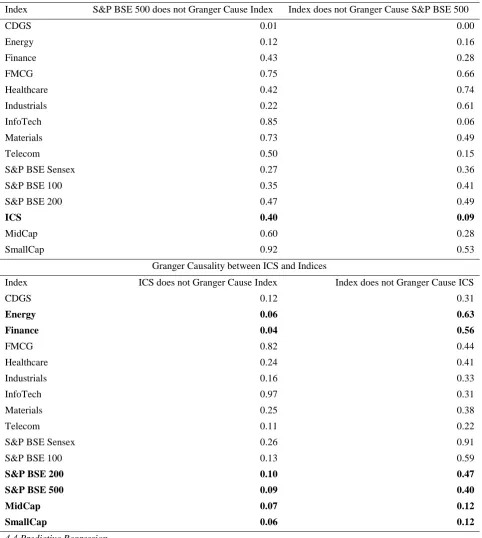
4.3 Granger Causality Tests
Table 3. Granger Causality (S&PBSE500, ICS)
Granger Causality between S&P BSE 500 and Indices
Index S&P BSE 500 does not Granger Cause Index Index does not Granger Cause S&P BSE 500
CDGS 0.01 0.00
Energy 0.12 0.16
Finance 0.43 0.28
FMCG 0.75 0.66
Healthcare 0.42 0.74
Industrials 0.22 0.61
InfoTech 0.85 0.06
Materials 0.73 0.49
Telecom 0.50 0.15
S&P BSE Sensex 0.27 0.36
S&P BSE 100 0.35 0.41
S&P BSE 200 0.47 0.49
ICS 0.40 0.09
MidCap 0.60 0.28
SmallCap 0.92 0.53
Granger Causality between ICS and Indices
Index ICS does not Granger Cause Index Index does not Granger Cause ICS
CDGS 0.12 0.31
Energy 0.06 0.63
Finance 0.04 0.56
FMCG 0.82 0.44
Healthcare 0.24 0.41
Industrials 0.16 0.33
InfoTech 0.97 0.31
Materials 0.25 0.38
Telecom 0.11 0.22
S&P BSE Sensex 0.26 0.91
S&P BSE 100 0.13 0.59
S&P BSE 200 0.10 0.47
S&P BSE 500 0.09 0.40
MidCap 0.07 0.12
SmallCap 0.06 0.12
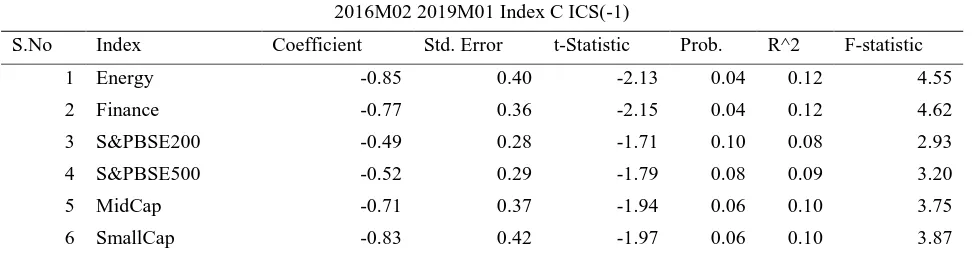
4.4 Predictive Regression
rt+1 = β0 + β. Sent t+ €t (2) where rt+1 is the return of the aggregate stock market portfolio at time t+1 and sentiment is a proxy for (one lag) consumer sentiment (ICS).
The prediction regression results are reported in table 4. I do not perform long horizon predictability regression because the series are stationary and the empirical reliability of such results has been called into question by Boudoukh, Richardon, and Whitelaw (2008), and Bauer and Hamilton (2017). The short horizon regression results show that sentiment has some predictive power for market returns. The estimated coefficients are negative and statistically significant at 10% level. The R2s of the regressions ranged between 0.08 and 0.12, signifying that a small portion of returns can only be explained by index of consumer sentiment. My results are in line few with previous studies (Schmeling, 2009; Fisher and Statman, 2000) which report negative relationship between lagged consumer sentiment and stock market movements. In other words following month of high consumer sentiment, market returns decline. In this case, an increase of one point in the sentiment level is associated, on average, with a 0.7% decrease in market returns in the following month.
The estimation results of regressions of the nine sectorial indices show that consumer sentiment only has negative and statistically significant impact in case of Energy sector and Finance sector at the 5% level (p = 0.04) for forecast horizon of one month. In these two sectors, the capacity for sentiment to anticipate future returns is 0.12. These results indicate that these sectors may be more susceptible to the effects of consumer sentiment. Following month of high consumer sentiment returns in these sectors decline. In other sectors, consumer sentiment appears to have no predictive power on returns.
Table 4. Predictive regression (ICS vs. Indices)
2016M02 2019M01 Index C ICS(-1)
S.No Index Coefficient Std. Error t-Statistic Prob. R^2 F-statistic
1 Energy -0.85 0.40 -2.13 0.04 0.12 4.55
2 Finance -0.77 0.36 -2.15 0.04 0.12 4.62
3 S&PBSE200 -0.49 0.28 -1.71 0.10 0.08 2.93
4 S&PBSE500 -0.52 0.29 -1.79 0.08 0.09 3.20
5 MidCap -0.71 0.37 -1.94 0.06 0.10 3.75
6 SmallCap -0.83 0.42 -1.97 0.06 0.10 3.87
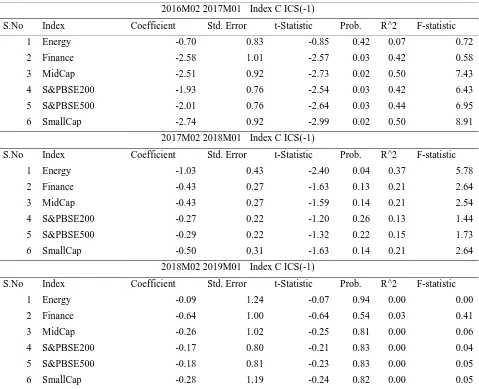
4.5 Predictive Regression (Sub-Period)
Table 5. Sub-Period Predictive Regression
2016M02 2017M01 Index C ICS(-1)
S.No Index Coefficient Std. Error t-Statistic Prob. R^2 F-statistic
1 Energy -0.70 0.83 -0.85 0.42 0.07 0.72
2 Finance -2.58 1.01 -2.57 0.03 0.42 0.58
3 MidCap -2.51 0.92 -2.73 0.02 0.50 7.43
4 S&PBSE200 -1.93 0.76 -2.54 0.03 0.42 6.43
5 S&PBSE500 -2.01 0.76 -2.64 0.03 0.44 6.95
6 SmallCap -2.74 0.92 -2.99 0.02 0.50 8.91
2017M02 2018M01 Index C ICS(-1)
S.No Index Coefficient Std. Error t-Statistic Prob. R^2 F-statistic
1 Energy -1.03 0.43 -2.40 0.04 0.37 5.78
2 Finance -0.43 0.27 -1.63 0.13 0.21 2.64
3 MidCap -0.43 0.27 -1.59 0.14 0.21 2.54
4 S&PBSE200 -0.27 0.22 -1.20 0.26 0.13 1.44
5 S&PBSE500 -0.29 0.22 -1.32 0.22 0.15 1.73
6 SmallCap -0.50 0.31 -1.63 0.14 0.21 2.64
2018M02 2019M01 Index C ICS(-1)
S.No Index Coefficient Std. Error t-Statistic Prob. R^2 F-statistic
1 Energy -0.09 1.24 -0.07 0.94 0.00 0.00
2 Finance -0.64 1.00 -0.64 0.54 0.03 0.41
3 MidCap -0.26 1.02 -0.25 0.81 0.00 0.06
4 S&PBSE200 -0.17 0.80 -0.21 0.83 0.00 0.04
5 S&PBSE500 -0.18 0.81 -0.23 0.83 0.00 0.05
6 SmallCap -0.28 1.19 -0.24 0.82 0.00 0.05
4.6 Volatility Modeling
To model series volatility clustering, long memory, and volatility leverage I used GARCH(1,1), and EGARCH(1,1) models. While measuring volatility I used both mean model and variance model. Results indicate that ARCH term and GARCH term is insignificant, which mean that the market has no long memory and new shocks or surprises will not persist too many future periods. When I run mean model and variance model together, I find significant negative effect of consumer sentiment present only on Smallcap Index at 1% level. For the remaining four indices the p > 0.05, which mean the models are insignificant at 5% level. Result indicates presence of noise trade and investors over reaction in small cap stocks. EGARCH (1, 1) result supports for the presence of leverage effect, and confirms that there is a negative impact of consumer sentiment on small cap stocks. It seems investors overestimate small cap stocks relative to large stocks during periods of high confidence and vice versa.
Table 6. Expected Return & Volatility Models GARCH (1, 1)
Energy Index
Mean = C(1) + C(2)*ICS(-1) + GARCH = C(3) + C(4)*RESID(-1)^2 + C(5)*GARCH(-1)
Mean Equation
Variable Coefficient Std. Error z-Statistic Prob.
C 2.32 0.97 2.40 0.02
ICS(-1) -0.99 0.49 -2.04 0.04
C 18.18 23.92 0.76 0.45
RESID(-1)^2 -0.13 0.21 -0.61 0.54
GARCH(-1) 0.46 0.91 0.51 0.61
R^2 0.11 SE Regress 5.36
Finance Index
Mean = C(1) + C(2)*ICS(-1) + GARCH = C(3) + C(4)*RESID(-1)^2 + C(5)*GARCH(-1)
Mean Equation
Variable Coefficient Std. Error z-Statistic Prob.
C 0.86 0.70 1.24 0.22
ICS(-1) -0.73 0.23 -3.13 0.00
Variance Equation
C 9.51 9.83 0.97 0.33
RESID(-1)^2 -0.13 0.04 -3.29 0.00
GARCH(-1) 0.59 0.55 1.07 0.28
R^2 0.09 SE Regress 4.87
MidCap Index
Mean = C(1) + C(2)*ICS(-1) + GARCH = C(3) + C(4)*RESID(-1)^2 + C(5)*GARCH(-1)
Mean Equation
Variable Coefficient Std. Error z-Statistic Prob.
C 0.06 0.86 0.07 0.94
ICS(-1) -0.67 0.39 -1.70 0.09
Variance Equation
C 10.43 17.65 0.59 0.55
RESID(-1)^2 -0.16 0.11 -1.38 0.17
GARCH(-1) 0.65 0.81 0.80 0.43
R^2 0.05 SE Regress 5.00
SmallCap Index
Mean = C(1) + C(2)*ICS(-1) + GARCH = C(3) + C(4)*RESID(-1)^2 + C(5)*GARCH(-1)
Mean Equation
Variable Coefficient Std. Error z-Statistic Prob.
C -0.24 0.99 -0.24 0.81
ICS(-1) -0.84 0.08 -10.46 0.00
Variance Equation
C 14.11 17.03 0.83 0.41
RESID(-1)^2 -0.13 0.15 -0.85 0.39
GARCH(-1) 0.60 0.67 0.90 0.37
S&P BSE 200 Index
Mean = C(1) + C(2)*ICS(-1) + GARCH = C(3) + C(4)*RESID(-1)^2 + C(5)*GARCH(-1)
Mean Equation
Variable Coefficient Std. Error z-Statistic Prob.
C 1.19 0.72 1.65 0.10
ICS(-1) -0.47 0.30 -1.55 0.12
Variance Equation
C 6.95 15.88 0.44 0.66
RESID(-1)^2 0.06 0.29 0.19 0.85
GARCH(-1) 0.39 1.30 0.30 0.77
R^2 0.08 SE Regress 3.77
S&P BSE 500 Index
Mean = C(1) + C(2)*ICS(-1) + GARCH = C(3) + C(4)*RESID(-1)^2 + C(5)*GARCH(-1)
Mean Equation
Variable Coefficient Std. Error z-Statistic Prob.
C 1.14 0.74 1.54 0.12
ICS(-1) -0.48 0.31 -1.56 0.12
Variance Equation
C 6.79 18.28 0.37 0.71
RESID(-1)^2 0.02 0.27 0.06 0.95
GARCH(-1) 0.47 1.42 0.33 0.74
R^2 0.09 SE Regress 3.86
5. Findings
The study finds significant contemporaneous co-movement between broad market indicator (S&PBSE500) and other indices considered in this study. At the same time, the paper does not find any contemporaneous co-movement between sentiment indicator (ICS) and indices. Next, the paper find that ICS granger causes six of 15 indexes, these causalities are negative and statistically significant. Among the six indices sectorial indices (Energy, and Finance) has significant coefficient of determination values confirming the negative causality. Further, the sub-period predictive analysis results reveal that the negative causality and strength of association are not consistent over the three sub-periods. Findings of the volatility analysis disclose no long memory, volatility persistence, and volatility clustering in all indices except small cap index. In case of small cap index the study, find volatility persistence and clustering. This finding is supported and confirmed through EGARCH analysis and indicates that there is presence of noise trade, investor optimism, pessimism, and over reaction in small cap stocks. Finally, the study also observed leverage effect in small cap index. Findings of this study are mixed. Primarily it supports the argument of Fisher and Statman (2003) that consumer sentiment alone have little predictive power and to some extent this paper reports similar results reported by Schmeling (2009) that sentiment negatively forecasts aggregate stock market returns. Importantly, the results of this study contradict the argument of investor sentiment positively affect stock markets as reported by Changsheng and Yongfeng (2012), Lux (2011), and Zhu (2012).
6. Discussion
to consumer sentiment. This may be because small cap stocks are excessively held by individual investors, who are more prone to the influence of sentiment. It also appears that propensity of individual investors to trade more on noise than on information. Volatility leverage in small cap index can be attributed to prospect theory. According to this theory, investors are loss averse and aggressively over react to bad news than to good news. Prospect theory argues that bad news has greater effect on volatility than good news of the same magnitude. This paper finds no contemporaneous co-movement between ICS and market indices. ICS sample comprises of household spread across India, however, how many of these household really invest in stocks is a question. In developed countries, individual investors invest in stocks judiciously, but in a developing country like India, investment in stocks by individual investors or households from rural and urban areas is limited. This raises a question for study further.
7. Conclusion
Based on the results of the study I conclude that ICS has no predictive power of short-horizon market movements. Indian stock market has no long memory and volatility clustering, which makes the prediction difficult. Investors need to be vigilant in trading smallcap stocks. In smallcap stocks, there is extreme trading during positive sentiment time. This indicates that more and more small investors without any fundamental knowledge or information about stocks, simply invest on noise. Initial returns may be high, but after some aggressive trading investors realize that stock prices are too high and will start selling to book profits. This creates panic among small investors and they rush to get rid of the small stocks. Resulting to leverage effect. Bad news spread faster and stock prices plunge hasty. Results of this paper lead to further research in the context of small cap stocks. This paper finds that consumer sentiment has negative short horizon predictive power of ICS of small cap index, but small cap index is different from small size stocks. Future research should be conducted on understanding the impact of ICS on small-size stocks.
References
Baker, M.P., Wurgler, J. & Yuan, Y. (2012). Global, local, and contagious investor sentiment. Journal of Financial
Economics, 104(2), 272–287. https://doi.org/10.1016/j.jfineco.2011.11.002
Baker, Malcolm, & Jeffrey Wurgler. (2006). Investor Sentiment and the Cross-Section of Stock Returns. Journal of
Finance,61, 1645-1680. https://doi.org/10.1111/j.1540-6261.2006.00885.x
Baker, Malcolm, & Jeffrey Wurgler. (2007). Investor Sentiment in the Stock Market. Journal of Economic
Perspectives, 21, 129-151. https://doi.org/10.1257/jep.21.2.129
Barberis, N., Shleifer, A. & Vishny, R. (1998). A model of investor sentiment. Journal of Financial Economics, 9, 307-343. https://doi.org/10.1016/S0304-405X(98)00027-0
Bauer, Michael D., & James D. Hamilton. (2017). Do Macro Variables Help Forecast Interest Rates? FRBSF
Economic Letter, 2016-20.
Bergman, N., & S. Roychowdhury. (2008). Investor sentiment and corporate disclosure. Journal of Accounting
Research, 46, 1057-1083. https://doi.org/10.1111/j.1475-679X.2008.00305.x
Black, F. (1986). Noise. The Journal of Finance, 41(3), 529–544.
https://doi.org/10.1111/j.1540-6261.1986.tb04513.x
Boudoukh Jacob, Matthew Richardson, & Robert F. Whitelaw. (2008). The Myth of Long-Horizon Predictability.
Review of Financial Studies, 21(4), 1577-1605. https://doi.org/10.1093/rfs/hhl042
Bremmer, Dale. (2008). Consumer Confidence and Stock Prices. 72nd Annual Meeting of the Midwest Economics
Association Hyatt Regency, Chicago, Illinois
Brown, G.W. & Cliff, M.T. (2004). Investor sentiment and the near-term stock market. Journal of Empirical Finance, 11(1), 1–27. https://doi.org/10.1016/j.jempfin.2002.12.001
Brown, G.W. & Cliff, M.T. (2005). Investor sentiment and asset valuation. Journal of Business, 78(2), 405–440. https://doi.org/10.1086/427633
Campbell, J.Y. & Kyle, A.S. (1993). Smart money, noise trading and price behavior. The Review of Economic
Studies, 60(1), 1–34. https://doi.org/10.2307/2297810
Changsheng Hu, Yongfeng Wang. (2013). Noise trading and stock returns: evidence from China. China Finance
Review International, 3(3), 301-315. https://doi.org/10.1108/CFRI-02-2012-0017
https://doi.org/10.1016/j.jempfin.2010.12.004
Chuang, W-J., Ouyang, L-Y. & Lo, W-C. (2010). The impact of investor sentiment on excess returns: a Taiwan market cases. International Journal of Information and Management Sciences, 21, 13–28.
Chui, A. C., Titman, S., Wei, K. J. (2010). Individualism and momentum around the world. Journal of Finance, 65(1), 361–392. https://doi.org/10.1111/j.1540-6261.2009.01532.x
Chui, Andy C.W., Sheridan Titman, & K.C. John Wei. (2008). Individualism and Momentum around the World.
AFA 2006 Boston Meetings Paper. https://doi.org/10.2139/ssrn.685767
Daniel, K., Hirshleifer, D., Subrahmanyam, A. (1998). A theory of overconfidence, self-attribution, and security market under- and over-reactions. Journal of Finance, 53. https://doi.org/10.2139/ssrn.2017
De Long, J.B., Shleifer, A., Summers, L.H. & Waldmann, R.J. (1990). Noise trader risk in financial markets. Journal
of Political Economy, 98(4). https://doi.org/10.1086/261703
De Long, J.B., Shleifer, A., Summers, L.H. & Waldmann, R.J. (1991). The survival of noise traders in financial markets. The Journal of Business, 64(1), 1–19. https://doi.org/10.1086/296523
Fama, E. F. (1970). Efficient capital markets: A review of theory and empirical work. Journal of Finance, 25(2), 383–417. https://doi.org/10.2307/2325486
Fisher, K.L. & Statman, M. (2003). Consumer confidence and stock returns. Journal of Portfolio Management, 30(1), 115. https://doi.org/10.3905/jpm.2003.319925
Ho, C., Hung, C. H. (2009). Investor sentiment as conditioning information in asset pricing. Journal of Banking &
Finance, 33(5), 892–903. https://doi.org/10.1016/j.jbankfin.2008.10.004
Ho, J.C. & Hung, C-H. (2012). Predicting stock market returns and volatility with investor sentiment: evidence from eight developed countries. Journal of Accounting and Finance, 12(4), 49–66. https://doi.org/10.2139/ssrn.2279339
Hofstede, G. (2001). Culture’s consequences: Comparing values, behaviors, institutions, and organizations across nations (2nd ed.). Beverly Hills, CA: SAGE.
Hsu, C-C., Lin, H-Y. & Wu, J-Y. (2011). Consumer confidence and stock markets: the panel causality evidence.
International Journal of Economics and Finance, 3(6), 91–99. https://doi.org/10.5539/ijef.v3n6p91
Huang, C., Yang, X., Yang, X. & Sheng, H. (2014). An empirical study of the effect of investor sentiment on returns of different industries. Mathematical Problems in Engineering. https://doi.org/10.1155/2014/545723
Jansen, W.J. & Nahuis, N.J. (2003). The stock market and consumer confidence: European evidence. Economics
Letters, 79(1), 89–98. https://doi.org/10.1016/S0165-1765(02)00292-6
Kahneman, D. & Tversky, A. (1979). Prospect Theory: An Analysis of Decision under Risk. Econometrica, 47(2), 263–292. https://doi.org/10.2307/1914185
Lee, W.Y., Jiang, C.X. & Indro, D.C. (2002). Stock market volatility, excess returns, and the role of investor
sentiment. Journal of Banking and Finance, 26(12), 2277–2299.
https://doi.org/10.1016/S0378-4266(01)00202-3
Lemmon, Michael, & Evgenia Portniaguina. (2006). Consumer Confidence and Asset Prices: Some Empirical Evidence. Review of Financial Studies, 19, 1499-1529. https://doi.org/10.1093/rfs/hhj038
Li, B.H. (2014). Does investor sentiment predict stock returns? The evidence from Chinese stock market. Journal
of System Science Complex, 27, 130–143. https://doi.org/10.1007/s11424-013-3291-y
Lux, T. (2011). Sentiment dynamics and stock returns: the case of the German stock market. Empirical Economics, 41, 663–679. https://doi.org/10.1007/s00181-010-0397-0
Naik, Pramod & Padhi, Puja. (2016). Investor Sentiment, Stock Market Returns and Volatility: Evidence from National Stock Exchange India. International Journal of Management Practice 9(3), 213-237. https://doi.org/10.1504/IJMP.2016.077816
Olsen, R.A. (1998). Behavioral finance and its implications for stock-price volatility. Financial Analysts Journal, 54(2), 10–18. https://doi.org/10.2469/faj.v54.n2.2161
Otoo, M. Ward. (1999). Consumer Sentiment and the Stock Market. Board of Governors of the Federal Reserve
Perez-Liston, D., Huerta, D. (2012). Does investor sentiment affect Mexican stock market returns and volatility?
Global Journal of Finance and Economics, 9(2), 121–132.
Pompian, M. M. (2006). Behavioral Finance and Wealth Management: How to Build Optimal Portfolios That
Account for Investor Biases. Hoboken: John Wiley & Sons.
Schmeling, M. (2009). Investor sentiment and stock returns: some international evidence. Journal of Empirical
Finance, 16(3), 394–408. https://doi.org/10.1016/j.jempfin.2009.01.002
Shefrin, H. (2008). Risk and return in behavioral SDF-based asset. Journal of Investment Management, 6(3), 1–18.
Shen, Junyan & Yu, Jianfeng & Zhao, Shen. (2017). Investor sentiment and economic forces, Journal of Monetary
Economics, 86(C), 1-21. https://doi.org/10.1016/j.jmoneco.2017.01.001
Shiller, Robert J. (2005). Irrational Exuberance, 2nd edition. Princeton, NJ: Princeton University Press.
Shiller, Robert J. (2017). Narrative Economics. American Economic Review, 107(4), 967–1,004. https://doi.org/10.1257/aer.107.4.967
Shleifer and Summers. (1990). The noise trader approach to finance. Journal of Economic perspectives, 419-33. https://doi.org/10.1257/jep.4.2.19
Shleifer A. (2000). Inefficient Markets: An Introduction to Behavioral Finance. Oxford University Press, New York. https://doi.org/10.1093/0198292279.001.0001
Verma, R. & Soydemir, G. (2009). The impact of individual and institutional investor sentiment on the market price of risk. The Quarterly Review of Economics and Finance, 49, 1129–1145. https://doi.org/10.1016/j.qref.2008.11.001
Verma, R. & Verma, P. (2007). Noise trading and stock market volatility. Journal of Multinational Financial
Management, 17(3), 231–243. https://doi.org/10.1016/j.mulfin.2006.10.003
Wang, Y-H., Keswani, A. & Taylor, S.J. (2006). The relationships between sentiment, returns and volatility.
International Journal of Forecasting, 22, 109–123. https://doi.org/10.1016/j.ijforecast.2005.04.019