RESEARCH
Quality assessment and interference
detection in targeted mass spectrometry data
using machine learning
Shadi Toghi Eshghi
*, Paul Auger and W. Rodney Mathews
Abstract
Advances in the field of targeted proteomics and mass spectrometry have significantly improved assay sensitivity and multiplexing capacity. The high-throughput nature of targeted proteomics experiments has increased the rate of data production, which requires development of novel analytical tools to keep up with data processing demand. Currently, development and validation of targeted mass spectrometry assays require manual inspection of chromatographic peaks from large datasets to ensure quality, a process that is time consuming, prone to inter- and intra-operator vari-ability and limits the efficiency of data interpretation from targeted proteomics analyses. To address this challenge, we have developed TargetedMSQC, an R package that facilitates quality control and verification of chromatographic peaks from targeted proteomics datasets. This tool calculates metrics to quantify several quality aspects of a chroma-tographic peak, e.g. symmetry, jaggedness and modality, co-elution and shape similarity of monitored transitions in a peak group, as well as the consistency of transitions’ ratios between endogenous analytes and isotopically labeled internal standards and consistency of retention time across multiple runs. The algorithm takes advantage of super-vised machine learning to identify peaks with interference or poor chromatography based on a set of peaks that have been annotated by an expert analyst. Using TargetedMSQC to analyze targeted proteomics data reduces the time spent on manual inspection of peaks and improves both speed and accuracy of interference detection. Additionally, by allowing the analysts to customize the tool for application on different datasets, TargetedMSQC gives the users the flexibility to define the acceptable quality for specific datasets. Furthermore, automated and quantitative assess-ment of peak quality offers a more objective and systematic framework for high throughput analysis of targeted mass spectrometry assay datasets and is a step towards more robust and faster assay implementation.
Keywords: Targeted proteomics, Quantitative, Mass spectrometry, Bioinformatics, Automated analysis, Interference detection, Quality control, Machine learning
© The Author(s) 2018. This article is distributed under the terms of the Creative Commons Attribution 4.0 International License (http://creat iveco mmons .org/licen ses/by/4.0/), which permits unrestricted use, distribution, and reproduction in any medium, provided you give appropriate credit to the original author(s) and the source, provide a link to the Creative Commons license, and indicate if changes were made. The Creative Commons Public Domain Dedication waiver (http://creat iveco mmons .org/ publi cdoma in/zero/1.0/) applies to the data made available in this article, unless otherwise stated.
Background
Targeted proteomics using mass spectrometry (MS) is a powerful technology for quantitation of candidate bio-markers for clinical research and development [1, 2]. Tar-geted MS methods such as multiple reaction monitoring (MRM) [1, 3–5] and parallel reaction monitoring (PRM) [6, 7] enable multiplexing of tens or hundreds of target proteins to report absolute quantitative levels of puta-tive biomarkers using stable-isotope labeled standards
(SILs) [8, 9], eliminating the need for costly and lengthy antibody development [1]. Targeted MS has found appeal in all phases of biomarker development from discovery to validation [10–13]. In the biomarker discovery phase, it is essential to consider the pathology of the disease or the mechanism of action of the therapeutic under inves-tigation to create a list of candidates for a targeted panel. Unlike what is customary in shotgun proteomics, limiting the candidate biomarkers to proteins that are biologically relevant at early stages of biomarker discovery increases confidence in the utility of biomarkers that are shown to be of value in a targeted MS workflow. This selectivity in targets also reduces the chance of false positive markers
Open Access
*Correspondence: [email protected]
due to multiple hypotheses testing, a common caveat in shotgun proteomics [14]. Moreover, the increased speci-ficity achieved by the targeted approach combined with its inherent sensitivity provides a promising tool for bio-marker validation. All of these advantages have increased the utility of mass spectrometry-based assays in clinical research beyond the more well-established applications of pharmacokinetics [15, 16] and toxicology [17].
With the incorporation of mass spectrometry-based targeted proteomics experiments into larger scale studies and as the throughput of instruments improves, the need for objective, reproducible and scalable solutions for data analysis has grown in parallel. Analysis of targeted prot-eomics data often starts with manual inspection of indi-vidual peaks to ensure acceptable data quality [12, 18]. This quality assessment step, performed independently from system suitability monitoring which tracks the per-formance of the instrument [19], focuses on uncover-ing interference or matrix effects for individual peptides and transitions (Fig. 1a). Several factors are taken into account for assessment of peak quality including consist-ency of retention time for each target peptide, acceptable chromatography as reflected by peak shape, consistency of transition ratios across samples as well as reasonably robust quantitation as demonstrated by the variability of peak areas and peak area ratios [12, 20–22]. In cases of interference or suboptimal peak picking, the analyst may adjust the boundaries of the peaks to remove interference and improve the specificity of the measurements. If the adjustment of the boundaries is insufficient to effectively remove interference, the analyst may remove the pep-tide from list of reported quantities. Manual assessment of peaks is time-consuming, requires extensive training
of the analysts, and is subject to inter and intra-operator variability. Furthermore, decentralized quality assess-ment and data analysis could further complicate the transferability and reproducibility of targeted MS assays. Therefore, establishing an analytical framework for qual-ity assessment of chromatographic peaks in a standard-ized manner may mitigate issues with large-scale mass spectrometry-based studies in the longer term.
The quality assessment process for targeted MS assays can be broken down into several components and con-sists of quality control (QC) at instrument, run, peptide and transition levels. Some of the currently available soft-ware tools have implemented measures to simplify this process. Several commercial and open source software and computational tools have been made available to the community for development of targeted MS assays and analysis of the results. Vendor agnostic software tools such as Skyline [18] and vendor-specific software tools such as MultiQuant provide a toolset, interactive user interference and a suite of visualizations for the opera-tor or analyst to create methods, integrate peak bound-aries, and perform quantitative analysis of the results. Longitudinal system suitability monitoring tools such as MSstatsQC [23] and AutoQC [24], which integrate with Skyline through Panorama, enable monitoring of the instrument performance over time and thereby facilitate earlier intervention for troubleshooting at the instru-ment level. Statistical tools such as MSstats [25] uses overall variations in the intensity of analytes across mul-tiple runs for quality assessment at individual run level to identify issues with injection or sample quality. Addi-tionally, Skyline takes advantage of multivariate statisti-cal tools such as mProphet [21] to optimize peak picking
a b
and integration and minimize the required manual peak adjustment. mProphet is a comprehensive automated platform for verification of targeted MS data; however it requires acquisition of decoy transitions, which is not always practical in a high-throughput workflow. Tools such as AuDIT [26] aim to identify interference in tran-sitions and therefore simplify quality assessment of tar-geted proteomics data, although due to small number of transitions, this method has limited statistical power. Combined, these tools have drastically simplified the development of targeted MS assays and subsequent anal-ysis of results. However, the burden of selecting peptides and transitions for a targeted panel and quality assess-ment of the peaks mainly fall on the shoulder of the analyst.
Herein, we present TargetedMSQC, a computational tool to facilitate high-throughput data analysis for tar-geted mass spectrometry. This tool has been developed with the main objective of automating quality assess-ment of chromatographic peaks to identify poor chro-matography or interference (Fig. 1b). TargetedMSQC takes advantage of well-established peak quality meas-ures such as retention time consistency and full-width at half-max (FWHM) as well as newly introduced metrics such as peak jaggedness, peak modality and isotope ratio consistency. TargetedMSQC utilizes these variables and multivariate statistical methods for the identification and demarcation of peaks with interference or suboptimal chromatography. Using TargetedMSQC, the user first provides a small subset of the dataset as a training set, where chromatographic peaks are manually inspected and the ones with poor quality are flagged. TargetedM-SQC uses machine learning to build a predictive model that links the peak quality measures with the quality status reported in the training dataset. Finally, the tool applies this model on the remaining peaks to predict and report the peak quality for the whole dataset. Here, the application of TargetedMSQC is demonstrated on a tar-geted proteomic MRM assay developed to study longitu-dinal dynamics of cerebrospinal fluid (CSF) biomarkers of Alzheimer’s diseases (AD) [27]. By enabling automated flagging of low quality peaks, TargetedMSQC elimi-nates or lessens the burden of manual inspection of all peaks for boundary correction or removal from the list of reported quantities, improving the throughput of the analytical pipeline. It also provides a standardized frame-work to objectively and quantitatively evaluate qual-ity across transitions, peptides and samples providing a means for mass spectrometry and contract laboratories to monitor the performance of their proteomics assays. This capability could be particularly valuable in large scale, multi-center or cohort studies where standardiza-tion of data quality control could not only expedite the
analysis, and simplify optimization of resources, but also improve the analytical reproducibility, traceability and continuity across multiple laboratories and studies.
Methods
Materials and reagents
CSF samples were purchased from PrecisionMed, Inc. (San Diego, CA). All donors provided informed con-sent for use of these studies with institutional review board approval for human collection protocols. Detailed description of sample collection protocols are pub-lished previously [27]. All reagents were purchased from Sigma (St. Louis, MO), unless stated otherwise. Stable-isotope-labeled AQUA™ peptides were purchased from Cell Signaling Technologies, (Danvers, MA) for method development and to generate calibration curves.
Sample preparation and mass spectrometry analysis
CSF biomarkers of AD
This study was conducted by Wildsmith et al. [27] and the dataset was kindly provided by the authors for the evalua-tion of TargetedMSQC. Sample preparaevalua-tion and targeted MS analysis of CSF tryptic digests are described in detail in the original publication [27]. Briefly, samples were concentrated to 30 μL using a 3 kDa Amicon centrifugal concentrator (Millipore, Billerica, MA), denatured in 40% trifluoroethanol (TFE) prepared in 100 mM triethylam-monium bicarbonate (TEABC) for 1 h at 37 °C. Following denaturation, samples were reduced with 5 mM dithi-othreitol (DTT) for 30 min at room temperature (RT) and then alkylated with 20 mM iodoacetamide (IAM) for 30 min at RT in the dark. This reaction was quenched with an additional 5 mM DTT for 15 min at RT. Samples were diluted to 10% TFE with 100 mM TEABC followed by digestion with trypsin at a ratio of 1:25 for 18 h at 37 °C. The digestion was stopped by addition of formic acid. The final volume of all digests was measured. An ali-quot of the total digest (48 μL) was spiked with 2 μL of a mixture of stable-isotope-labeled AQUA™ peptides prior to LC-MS/MS analysis. Heavy AQUA™ peptides to be spiked into samples were diluted and pooled before use to concentrations that were within tenfold of endogenous protein levels and ranged from 2 to 100 fmol/μL depend-ing on analyte. For method development and generation of calibration curves, light AQUA™ peptides were spiked into the solution of tryptically digested BSA and heavy AQUA™ peptides at varying concentrations.
prior to separation on a BEH130 C18 (100 μm × 100 mm, 1.7 μm) (Waters) at a flow rate of 1 μL/min over 60 min. The gradient formation went from 2% buffer B to 30% buffer B in 40 min followed by 30–98% buffer B in 10 min. A 98% solution of buffer B was used to wash the column for 5 min prior to reequilibration at 2% buffer B for 5 min. Peptides were detected by a QTRAP® 5500 (AB SCIEX, Framingham, MA) equipped with an Advance Captivespray™ source (Michrom Bioresources, Inc. Auburn, CA). Scheduled MRM methods were pre-pared using Skyline v1.3 and imported into Analyst 1.5.2 (ABSCIEX). The QTRAP® 5500 was operated in positive ion mode using the scheduled MRM.
Engineering QC features for peak quality assessment
Thirty-two features were calculated or engineered to quantify various attributes pertaining to peak quality, including peak area and transition ratio, full-width at half-max (FWHM), symmetry, peak similarity, modality, co-elution and retention time. A complete list of these features and their definitions is provided in Additional file 1: Table S1. The features were calculated using cus-tom R scripts implemented as part of the TargetedMSQC package. The scripts accept chromatograms and peak boundaries, exported from Skyline, as input and gener-ate a comma separgener-ated value file (features.csv) with the calculated features. Depending on the nature of the QC feature, it may be calculated at one or more levels. For example, jaggedness is reported at transition, isotope and peak group levels, while max intensity is only reported at transition level. Features at transition level are reported for peptide, fragment ions and isotope label trios. Fea-tures at peak group level are reported for individual pep-tides. Features at transition pair level are reported for peptide and fragment ion pairs. Features at isotope level are reported for peptide and isotope label pairs. It should be noted that the model predicts the peak quality for each endogenous and spiked-in standard transition as a pair. Therefore, the QC features that correspond to a spe-cific label type, i.e. features at transition and isotope level, should be calculated and provided to the model for both endogenous and spiked-in standards, which brings the total number of features to 52.
Creating the training datasets
The training dataset is a set of peaks with manually anno-tated quality status, which is used as a guide to build a predictive peak quality model. A subset of the runs in each dataset is randomly selected for manual annotation and the monitored transitions for quantification of all of the peptides on the MRM panel are annotated in this subset of runs to create a training dataset. This ensures that all of the peptides and transitions in the panel are
reasonably represented in the training set. The required number of runs for training is determined empirically. Cross validation and resampling are used to estimate the model performance and its confidence interval for an increasing number of runs in the training set until our desired model performance is achieved. Learning curves are plotted to help determine the size of the train-ing dataset to either achieve minimum acceptable model performance or observe a plateau in the curve. In this study, each training set contains a panel of 36 peptides and 144 unique peptide transitions, measured in multiple samples. The runs were imported into Skyline daily and the chromatograms were exported as a.tsv file. The peak boundaries were saved as a.csv file through the export and report option in Skyline. Inputs to TargetedMSQC are exported from Skyline; therefore this tool is inde-pendent of MS vendor file formats. The training set was created by merging chromatograms and peak bounda-ries using TargetedMSQC. Additionally, transitions with missing isotope pairs and peaks with missing boundaries were removed. The transition peaks, characterized by run, peptide and fragment ion, were manually inspected by an analyst and annotated by ‘ok’ or ‘flag’ labels. The following qualities were used during manual inspec-tion to flag low quality peaks: bimodal peaks, peaks suf-fering from poor chromatography as indicated by sharp and jagged edges, severe tailing, or high background, peaks exhibiting signs of interference e.g. by introducing inconsistence transition ratios between multiple runs or endogenous and standard isotopes, and finally peaks with low standard isotope signal intensities. The annotated dataset was reviewed by two mass spectrometry analysts. The agreement between analysts ranged from 80 to 95% depending on overall quality of the data and complexity of the QC process. Before training the model, the ana-lysts reviewed the data to reach agreement on the contro-versial peaks.
Building the predictive quality assessment model
used for training. Repeated tenfold cross validation (3 repeats) was applied to the remainder of the training set to minimize over-fitting. Parameter tuning was employed to optimize the model. The model offering the highest accuracy was used for subsequent analysis.
Peak quality assessment of targeted MS datasets using the predictive model
Once the model with the highest performance was selected for each dataset, it was applied to the complete dataset. QC features were calculated for every peak in the dataset and the model was applied to these features using the built-in functionalities in TargetedMSQC to flag transition peaks with poor quality. The results of this assessment were reported in data tables as well as a.pdf report that summarizes the output at sample and peptide levels. Additional visualizations were generated by Tar-getedMSQC and included in the report to help identify transitions that show interference or poor chromatogra-phy across multiple samples.
Developing the TargetedMSQC R package
This analysis has taken advantage of several scripts to clean up the Skyline chromatograms and peak bounda-ries, calculate the engineered QC features, create tem-plates for the training dataset, merging the training dataset with QC features and train and apply the peak quality model. All these scripts and examples on how to use them are included in the TargetedMSQC tool, an open source R package. This package is freely available on GitHub (https ://githu b.com/shadi eshgh i/Targe tedMS QC).
Results
Engineered QC features quantify the quality of chromatographic peaks
Poor chromatography and interference compromise the quality of a peak. The factors most affected by this com-promise are peak shape, symmetry, jaggedness, FWHM, retention time shift, and the consistency of the ratios of peptide transitions. TargetedMSQC calculates quality features that have been engineered to capture changes in peak quality. A total of thirty-two features have been developed to describe the peak quality. These features can be categorized into nine main groups of jagged-ness, peak similarity, symmetry, FWHM, modality, shift, intensity, area ratio and retention time. Additional file 1: Table S1 lists these QC features and their definitions in detail.
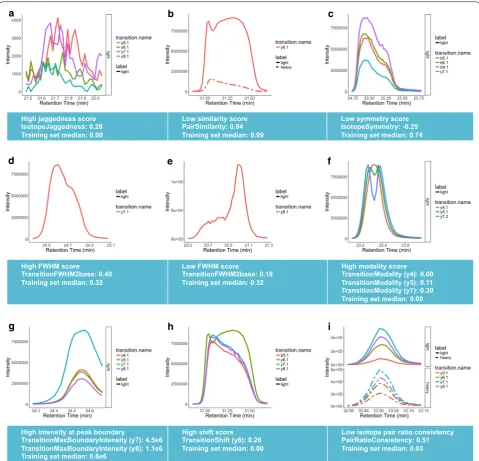
Figure 2 depicts several representative examples of chromatographic peaks and their corresponding QC fea-tures. For instance, jaggedness is defined as the fraction of time points across a peak where the signal changes
direction, excluding the peak apex and therefore, returns a value of 0.0 for a smooth peak, whereas jaggedness scores closer to 1.0 indicate a noisy peak (Fig. 2a). Simi-larity score between two peaks is determined by the Pearson correlation coefficient between the peak intensi-ties, which yields a value of 1.0 for highly similar peaks that mirror the shapes of one another and lower values for pairs with differences in peak shapes (Fig. 2b). Sym-metry score for a peak quantifies how symmetric a peak is along its time midpoint and yields values close to 1.0 for perfectly symmetric and lower scores for asymmetric peaks (Fig. 2c). FWHM and FWHM to peak base width ratio are well-known quality metrics for chromatographic peaks that can deviate from a normal range due to inter-ference resulting in peak shoulders or poor chromatog-raphy (Fig. 2d, e). Modality score is defined as the largest dip in the peak, normalized by peak height. For example, the three transitions represented in Fig. 2f show varying levels of bimodal behavior with modality scores ranging from 0.0 for the smooth y4 transition to 0.3 for the highly bimodal y7 transition. Peaks with high intensities at the peak boundary may be subject to interference and there-fore the peak intensity at the boundary was introduced as a QC feature in this schema (Fig. 2g). Additionally, all the fragment ions that belong to the same peptide must co-elute. Therefore, observing a shift in the elution of one transition flags the peak for manual reanalysis. This shift in elution is quantified by shift score as shown in Fig. 2h. Finally, an important attribute of peak groups in a mass spectrometry experiment is consistency of relative ratios of transitions not only between endogenous and standard isotopes, but also across samples. Pair ratio consistency is one of the metrics that quantifies this feature and is able to identify transitions where this ratio deviates from expected values as shown for y3 transition in Fig. 2i.
An ensemble of these QC features enables a quanti-tative way to evaluate peak quality. For instance, a peak that may suffer from nothing more than tailing will result in low symmetry scores while showing close to perfect scores for all the other features, whereas interference in a peak may manifest in poor similarity, modality, shift and isotope ratio consistency scores. TargetedMSQC uses supervised learning based on a set of manually annotated peaks with similar features to train a model that is capa-ble of predicting peak qualities in new samples, which is particularly useful for performing QC on large datasets.
Peak quality assessment of CSF biomarkers in artificial matrix
as an artificial CSF matrix. This experiment was used for optimization of the CSF biomarker panel. Samples were analyzed by an MRM panel of 144 unique peptide transitions to quantify 36 peptides using stable-isotope labeled internal standards.
Training dataset
Four runs were used to generate the training set con-taining a total of 288 peak groups (144 endogenous and
144 spiked-in internal standards) and 576 transition pairs. A minimum accuracy of 90% was agreed upon as acceptable performance in this study. The learning curve for this dataset (Additional file 1: Figure S1) shows that at least 400 transition pairs are required to achieve this performance. Of the 576 peaks in the training set, 199 were flagged by an analyst for quality issues pertaining to interference, poor chromatography or low signal. Charac-teristics such as bimodality, jagged edges, severe tailing, High jaggedness score
IsotopeJaggedness: 0.28 Training set median: 0.00
Low similarity score PairSimilarity: 0.84 Training set median: 0.99
Low symmetry score IsotopeSymmetry: -0.25 Training set median: 0.74
High intensity at peak boundary
TransitionMaxBoundaryIntensity (y7): 4.5e6 TransitionMaxBoundaryIntensity (y8): 1.1e6 Training set median: 0.6e6
High shift score TransitionShift (y6): 0.26 Training set median: 0.00
Low isotope pair ratio consistency PairRatioConsistency: 0.51 Training set median: 0.03 High FWHM score
TransitionFWHM2base: 0.40 Training set median: 0.32
Low FWHM score TransitionFWHM2base: 0.18 Training set median: 0.32
High modality score TransitionModality (y4): 0.00 TransitionModality (y5): 0.11 TransitionModality (y7): 0.30 Training set median: 0.00
a b c
d e f
g h i
variability in transition ratios and low spiked-in standard signal were used by the analyst to identify and flag low quality peaks. The remaining 377 peaks were considered of acceptable quality.
The training dataset consists of a list of peaks identified by run, peptide sequence, precursor charge, fragment ion, product charge and quality status, which has been determined manually by an analyst. Peak quality met-rics were calculated for the training set; violin plots for the distribution of each metric are shown in Additional file 1: Figure S2. The training set was used as a guide to build a predictive model that can identify low quality peaks based on an ensemble of QC features such as peak symmetry, similarity, modality, jaggedness, co-elution and FWHM. Distribution of features for this dataset (Additional file 1: Figure S2) provides a quick glance at the overall quality of peaks in this set as judged by the analyst. As shown in Additional file 1: Figure S2, major-ity of the features exhibit a pattern in relationship to the quality status determined through manual inspection. For example, flagged peaks tend to have higher scores for features such as modality, shift, isotope pair ratio con-sistency, coefficient of variation and intensity at the peak boundary and lower scores for features such as symme-try, similarity, and correlation between peak area ratios of endogenous and standard isotopes. However, there is a not a single feature that can effectively discriminate between high and low quality peaks, further emphasizing the importance of utilizing multiple features and multi-variate statistical methods to identify peaks with poor quality. The training dataset in this study contains peaks on a diverse quality spectrum. Therefore, by including a diverse set of peaks in the training dataset the capability of the predictive model to identify a wider range of qual-ity issues is enhanced.
Predictive peak quality model development
After calculating the QC features for the peaks in the training dataset, several supervised learning methods were examined to construct a peak quality predictive model: Regularized logistic regression, regularized ran-dom forest (RRF), K-nearest neighbor (KNN) and sup-port vector machine (SVM) with linear and polynomial kernels. When applicable, regularization was used to simplify the model and reduce the risk of overfitting. The models were built based on 80% of the data ran-domly sampled from the training set and their perfor-mances were further verified by testing the models on the remaining 20% of the data, named validation subset. The performances of the models were estimated by compar-ing the predicted peak qualities for each model with the observed qualities as determined by the analyst.
The performances of these models are summarized in Additional file 1: Table S2 and Figure S3. Among the five investigated methods, regularized random forest achieved the highest performance with an accuracy of 94.5% to distinguish flagged from high quality peaks in the training subset, and sensitivity and specificity rates of 97.4% and 98.7% on the validation subset, respectively. The negligible difference between model classification accuracy on the training and validation subsets suggests minimal overfitting. The performance of the other four models was reasonable as well, ranging from accuracies of 89.8% for linear SVM to 93.4% for the KNN models; however most of them showed low sensitivity for detec-tion of poor quality peaks in the validadetec-tion subset. In general, considering that training of an RRF model is computationally expensive, it takes longer to build an RRF model compared to the other methods employed in this study. For example, training the RRF model, includ-ing cross validation and parameter tuninclud-ing, took ~ 40 min on a single processor. In comparison, training of the KNN model with the same cross validation method and similarly sized parameter tuning set was six times faster. Therefore, alternative methods may still be worthwhile to explore for different applications or datasets. Addi-tional file 1: Figure S4 shows the relative importance of the QC features in determining the quality outcome for a peak in the RRF predictive model. As shown in this fig-ure, compared to jaggedness, shift and modality metrics, features that quantify peak intensity, isotope ratio con-sistency, peak similarity and FWHM seem to play a more crucial part in determining the outcome of the predictive peak quality model. One explanation could be that this particular dataset has very few jagged or bimodal peaks and therefore, metrics such as jaggedness and modality do not play a defining role in distinguishing high and low quality peaks.
Peak quality assessment of longitudinal CSF biomarkers of AD dataset
To further evaluate the practicality and performance of the proposed quality assessment framework, TargetedM-SQC was applied to a dataset from a longitudinal study of candidate progression biomarkers of Alzheimer’s disease in procured CSF samples of AD patients. Samples were analyzed by the same MRM panel in the previous exam-ple, quantifying 36 peptides using stable-isotope labeled internal standards.
Training dataset
The original dataset included 70 runs of a panel of 36 peptides in procured CSF samples from patients with Alzheimer’s disease. Eight runs were selected at ran-dom to be annotated for the training dataset. Poor quality peaks including, jagged peaks, peaks with high background or interference were flagged in the training dataset. This resulted in a set of 1128 transition pairs, with 615 ‘ok’ and 513 ‘flagged’ peaks. The learning curve for this dataset (Additional file 1: Figure S6) shows that at ~ 900 transition pairs the curve plateaus. The engi-neered features were calculated for each transition pair in the training set as shown in Additional file 1: Figure S7. The patterns for the distribution of features were as expected. Flagged peaks had higher jaggedness, modality, shift, peak area CV% and lower symmetry and similar-ity scores. Additionally, they showed higher normalized intensities at the peak boundaries, as well as poor con-sistency in FWHM across samples and isotopes and poor consistency in pair isotope ratios across samples.
Predictive peak quality model development
The training set was used for development of five mod-els using different statistical approaches, including RRF, regularized logistic regression, SVM with linear and pol-ynomial kernels and KNN methods. Similar to the previ-ous example, the training set was split into training (80%) and validation (20%) subsets. The model was built using the training subset, while the validation subset was used for unbiased evaluation of the performance of the model. Using the validation subset for performance evaluation helps diagnose issues with overfitting and therefore is of great importance in choosing the final model.
Performance of the five developed models was com-pared in the training as well as the validation subset (Additional file 1: Table S3 and Figure S8). The RRF model yielded the highest classification accuracy, achieving an accuracy of 89.1% and 91.1% in the training and valida-tion subsets, respectively. The accuracy of the other tested models ranged from 80.1% in the linear SVM model to 87.0% in the KNN model. However, the sensitivity of the RRF model for flagging peaks with low quality significantly
outperformed that of the other four models and therefore RRF was selected as the final predictive model for peak quality assessment in this dataset. Furthermore, receiver operator characteristics (ROC) analysis of the outcome of the RRF model on the validation subset returned an area under the curve (AUC) of 0.975, which also demonstrates the high performance of the predictive model (Additional file 1: Figure S9). Depending on the difference between the distribution of individual QC features in low and high quality peak groups, each of these metrics plays a role in determining the output of the model. In this dataset, QC features that measure attributes such as peak intensity, modality, correlation and consistency of isotope peak area ratios, peak area CV%, FWHM, and symmetry appear to have a more prominent impact on the output of the model (Additional file 1: Figure S10). Alternatively, jaggedness and shift scores do not seem to play a crucial part in deter-mining the peak quality in the RRF model.
It should be noted that applying the model devel-oped in the artificial matrix to assess the quality of the longitudinal biomarker data and vice versa shows poor performance. This can be attributed to the complexity of the biological matrix in the experiment. The highly complex human CSF matrix containing endogenous biomarkers poses a greater challenge for the LC-MS/ MS method when compared to the artificial CSF matrix, which consists of bovine serum albumin with spiked-in standard isotope-labeled peptides. The matrix effect, bio-logical variability of samples and unpredictable interfer-ence from the endogenous analytes in CSF compromises the chromatography in the longitudinal biomarker study. This ambiguity complicates the definition of acceptable peaks in the dataset and creates a gray zone, where the assessment of the peak quality may be more subjective. In contrast, using BSA as an artificial CSF matrix creates a controlled sample, where the difference between high and low quality peaks is clearer. This clarity further sim-plifies annotation of the training set and subsequently optimization of the performance of the model. Moreo-ver, the concentrations of spiked-in AQUA™ peptides in the artificial CSF samples were greater than the limit of quantitation for the vast majority of the peptides, which generates peaks with higher intensities and fewer jagged or irregular peaks. Considering that the peaks that are close to the limit of quantitation are more anomalous in shape and quality, it is expected that a dataset of high intensity peaks, as seen in the experiment with artificial matrix, leads to a more simplified quality assessment process both through manual and automated workflows.
and 13 were misclassified as ‘flagged’ (S9 G–R) by the model. A majority of misclassified peaks fall into the gray area between a high and low quality peak. Ambigu-ity surrounds the annotations of flagged data by both the model and through manual inspection. To confirm this hypothesis, we can evaluate the class probabilities for the misclassified peaks. Class probability for each transition pair is the likelihood of that transition falling into a cer-tain class as estimated by the RRF model. For example, a ‘flag’ class probability of 0.5 or higher for a transition, results in flagging of that transition by the model as a low quality peak. Transitions with class probabilities closer to 0.5 are considered marginal cases. The ‘flag’ class prob-ability of the transitions correctly flagged by the model is 0.91 ± 0.10, whereas the probability for low quality mis-classified transitions is 0.65 ± 0.13, indicating a higher level of uncertainty about the peaks that were misclassi-fied. Similarly, the ‘ok’ class probability of the transitions that correctly passed QC by the model is 0.91 ± 0.09, while this probability for the low quality transitions that were misclassified as high quality is 0.70 ± 0.15. Many of the misclassified transitions are low intensity peaks that are either below or very close to the limit of quantitation. At such low concentrations, the quality of the peak could be compromised not due to poor chromatography or interference, but only because of the low intensity of the peak and limitations of the detector in resolving the peak. Therefore, defining more rigorous quality assessment cri-teria at these low levels may decrease the uncertainty of the model and therefore improve its performance.
Peak quality assessment in large targeted MS datasets using the predictive model
The optimized RRF model was applied to the CSF bio-marker longitudinal study dataset. The QC features were calculated for each transition pair for 36 peptides quanti-fied in 70 runs and used as the input to the model. Tar-getedMSQC generated a report based on the output of the model summarizing the QC results for the complete dataset and at sample and peptide levels. Additionally, for each peptide with an isotope pair, model output was visu-alized for individual transitions and samples. Here, two of these peptides are discussed in more details as examples of how this tool can assist the analyst in method develop-ment and data analysis. The full TargetedMSQC report for the CSF biomarker longitudinal study is provided in the Additional file 2.
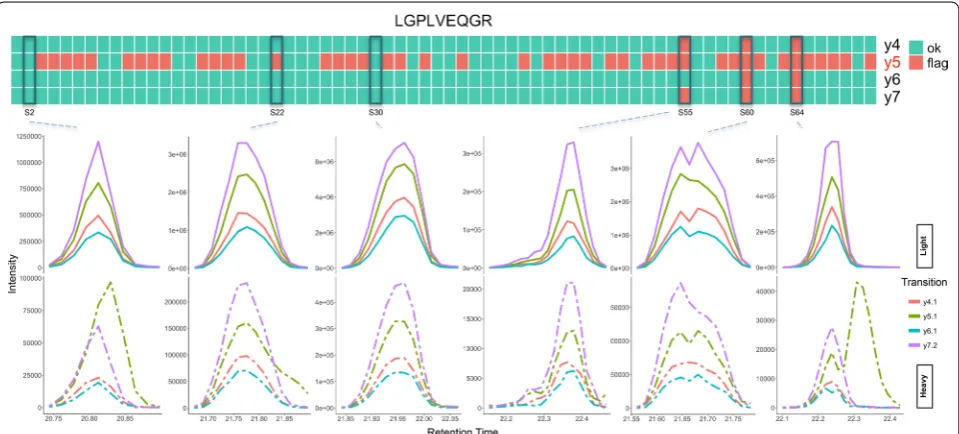
Figure 3 shows the QC results summary for peptide LGPLVEQGR. Four transitions, y4, y5, y6 and y7, were monitored for quantification of this peptide. The heat-map in Fig. 3 shows the output of the model for individ-ual transitions across 70 samples included in the study. The peak groups for 6 of these runs are depicted in the figure as representatives of the dataset. Sample S30 shows an example of a high quality peak, which has correctly passed QC by the model. As shown in Fig. 3, three of the transitions, y4 (red), y6 (blue) and y7 (purple) passed QC by the model in almost all of the samples. On the other hand, y5 (green) is flagged in the majority of the samples, including samples S22, S55, S60 and S64. LGPLVEQGR shows an example of a peptide that could be accurately
quantified across multiple samples by removing the tran-sition with interference (y5) from the quantitative analy-sis. Upon manual inspection of y5 across these samples, we observed that this transition had interference in many of the flagged samples similar to what is seen in S22 and S64. The interference resulted in high background at the peak boundary (S22: normalized intensity at boundary of 0.17 compared with 0.02 as the median of the dataset) and low similarity between the endogenous and stand-ard pairs (S64: pair similarity score of 0.06 compared with 0.98 as the median of the dataset) and high modal-ity score (S64: transition modalmodal-ity score of 0.34 com-pared with 0.00 as the median of the dataset). Sample S55 shows an example of a peak with poor chromatography and shoulders, where at least three of the transitions have been flagged due to a shoulder, particularly in the stand-ard peptide. Sample S60 shows an example of a peak with bimodal transitions that has also been correctly flagged by the model. All the transition pairs in this group suffer from jaggedness, poor modality and low similarity scores, all of which are likely the main driving force behind the output for this peak. Although the model performs well in a majority of the samples, there are examples where the output is not as expected. Sample S2 shows a peak group where the y5 transition has interference and needs to be flagged; however the model failed to flag this transi-tion as a low quality transitransi-tion. It should be noted that the model has predicted a value of 0.492 as the ‘flag’ class probability for this transition, which indicates that the QC features calculated for this transition place it on the
verge of being flagged. A solution to improving the sen-sitivity of the model for detection of marginal low qual-ity peaks such as y5 in sample S2 is to lower the default threshold of 0.5 as the cut-off class probability for flagged peaks in the RRF model. At the expense of increasing the rate of incorrectly flagging high quality peaks, lowering the threshold could help flag more peaks and transitions in the marginal gray area between the two classes.
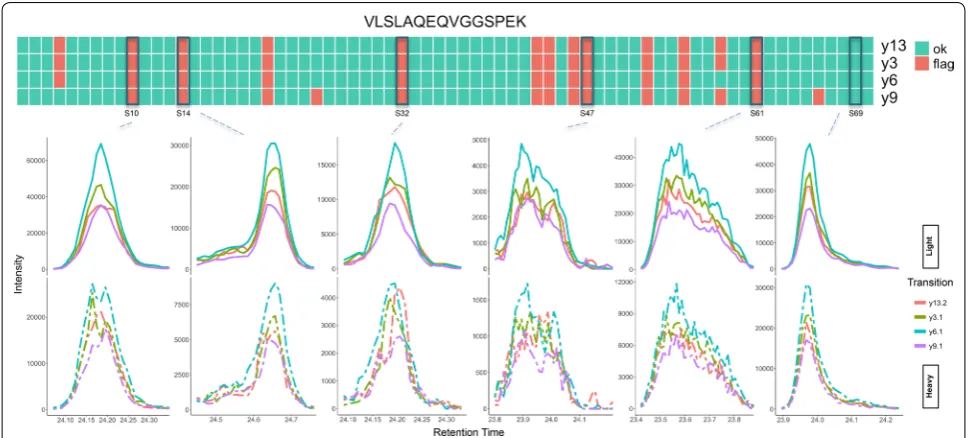
Figure 4 shows the QC results summary for peptide VLSLAQEQVGGSPEK. Unlike the LGPLVEQGR exam-ple, none of the transitions have been systematically flagged across majority of the samples. However, all four monitored transitions seem to be flagged in a number of samples. One could conclude from this data that in these samples the transitions cannot be used to reliably quan-tify the target peptides. Many of the flagged peaks seem to have failed quality assessment due to low intensity, jagged and tailing peaks. This is particularly evident for the heavy standard isotopes. This is represented in sam-ples S10 and S32. Both have slightly jagged, bimodal and low intensity standard signals. Samples S47 and S61 are highly jagged, slightly tailing and have very low standard signals. Sample S14 is jagged and tailing and therefore flagged for poor quality. Finally, sample S69 shows an example of a peak that has correctly passed QC. It should be noted that although this peak is tailing, the peak qual-ity is otherwise acceptable and therefore similar peaks in the training set were marked as acceptable.
Discussion and conclusion
In this study, a framework and toolset for quality assess-ment of large proteomics targeted MS datasets has been presented. This framework entails building and applying a predictive QC model tailored to the proteomics panel as well as the matrix used in the study to flag low qual-ity peaks and transitions. The predictive model is opti-mized based on a subset of pre-annotated peaks from the dataset, which provides guidelines on what repre-sents an acceptable peak. A step-by-step guide for the QC process using TargetedMSQC in a laboratory setting has been provided as a vignette in the R package. This framework can benefit the study in several ways. First, using the same model for peak quality assessment of the whole dataset ensures that quality standards are not altered during the course of the study. Given the inter- and intra-operator variability of manual peak assessment, the prolonged duration and multi-center nature of many proteomics studies, this model provides a unified way to standardize data QC and perform more robust analysis. Second, an automated QC approach reduces the time spent by the analyst on manual inspection of every peak. This algorithm allows the analyst to focus on peaks that have been flagged by the model. For instance, applying the predictive model for QC of our dataset of 70 sam-ples, 36 peptides, and 144 transitions, the process took less than 30 min, whereas manual inspection would have lasted days. It should be noted that an analyst should still review and adjust the boundaries on peaks that have been flagged by TargetedMSQC. However, this manual step is greatly reduced increasing the overall efficiency of the QC process. The TargetedMSQC framework is designed to be generic and not limited by instrument or platform and the QC process and standards can be optimized for each individual dataset. Providing such an agnostic framework allows for use in the quality assessment of large datasets and for the optimization of method devel-opment, by flagging transitions or peptides that might be poor performing or have low reproducibility. Finally, as demonstrated in this study, the rate of low quality peaks that were missed by the model is low, which speaks to the sensitivity of the developed models for identification of interference, poor chromatography and other peak qual-ity issues. The problem at hand, which is automated flag-ging of peaks with poor quality, has a higher tolerance for false positives than false negatives. In other words, mis-takenly flagging high quality peaks imposes a lower cost than mistakenly passing a low quality peak. Therefore, it is advisable to prioritize the sensitivity of the model over its specificity during model optimization and selection. In the representative examples, the peaks that were incor-rectly marked as ‘ok’ were usually marginal cases where the imperfection in the peak quality did not significantly
impact the outcome of the quantitative results. Moreo-ver, if the data contains significantly fewer ‘flagged’ peaks, accuracy may be a misleading performance metric for selecting the best model. For training a model based on imbalanced data, it is recommended to use ‘ROC’ as performance metric. TargetedMSQC allows the users to choose between accuracy and ROC for model selection.
The proposed framework provides several benefits for streamlining the QC process in targeted MS work-flows. It should be noted that this framework does have some limitation. One of the most time-consuming steps of building a quality assessment model using Target-edMSQC is in fact building a training dataset to guide model development. Currently, annotation of the train-ing set is conducted manually and takes a few hours to complete. Although this may be time-consuming for a small experiment, for a large datasets that require days of analysis time, a few hours spent on creating a training set can be considered acceptable. Additionally, integrat-ing this framework into software tools such as Skyline, could simplify generation of the training set by enabling the user to simply click a peak to flag it in the training set. Annotation of the training set can be accelerated by automating some of the annotation steps. Peaks with high background can be identified by higher intensities at the boundary. This value is included as one of the QC features calculated by TargetedMSQC and automated flagging of all peaks with high background as defined by this metric could simplify the annotation step. Another limitation of the TargetedMSQC approach is that, simi-lar to any supervised learning method, the quality of the model depends on the quality of the training set. In other words, the model still inherits the subjectivity or bias of the individual who annotates the training set. The effect of such bias is usually more pronounced when the train-ing dataset is small. To overcome these biases, traintrain-ing sets should always be reviewed by multiple analysts. This would be particularly beneficial for multi-center studies. Additionally, increasing the size of the training set could further mediate the impact of bias in the annotation step.
marginal cases that fall very close to the cut-off point. For this reason, it would be beneficial for the users to be able to manually adjust the cut-off threshold. To help the users decide on an acceptable threshold, ROC analysis can be performed to estimate the sensitivity and specific-ity of the model to identify low qualspecific-ity peaks in the train-ing set at each cut-off value (Additional file 1: Figure S9). This helps the user choose a cut-off that tunes the rates of false positives and false negatives according to their tol-erance for each group. It should be noted that since the ROC analysis does not cross-validate the estimated sen-sitivity and specificity, these values should be taken into account with caution. To estimate confidence intervals for sensitivity and specificity, users may choose ROC as performance metric for training the model. Another way to address the challenges of classifying marginal peaks is including more examples of such cases in the train-ing set, which may enable the model to better resolve low and high quality peaks. This could be achieved by first applying the model built on the initial training set to the dataset, identifying marginal cases based on their class probabilities, and prompting the analyst to further annotate these cases. The extended training set then may be used to further adjust the model. Additionally, since the process of annotating the training set is manual and therefore prone to human error, evaluating the output of the initial model may enable identification and correction of peaks that have been incorrectly annotated and there-fore improve the quality of the training set and subse-quently, the performance of the model. It should be noted that the goal of this step is to improve the quality and diversity of the training set by informing the user of the model output. This should not be mistaken as a step to enforce the manual annotations to match with the model output, as this may result in overfitting.
Given the increasing interest in targeted MS analysis for identification, validation and quantitation of clinical biomarkers, improving and providing tools for reliable analysis of targeted MS data is both a challenge and an opportunity. Methods to standardize and streamline this process are highly needed. TargetedMSQC provides a QC framework that can be customized for specific pan-els, instruments and sample types in an automated, time-efficient, and reproducible manner and therefore is a step towards more robust targeted MS data analysis.
Additional files
Additional file 1. Supplementary materials for development of predictive QC models using TargetedMSQC.
Additional file 2. TargetedMSQC report for the CSF biomarker longitudi-nal study.
Authors’ contributions
STE contributed to conception, design and implementation of the study, developed the R package, and drafted the manuscript. PA contributed to study design and prepared the datasets. RM contributed to conception and design of the study and critical review of the manuscript. All authors read and approved the final manuscript.
Acknowledgements
We thank Dr. Kristin Wildsmith, for sharing the datasets to evaluate TargetedM-SQC in this study and helpful discussions and feedback, Ali Faruqi for testing the R package and Drs. Bill Forrest and Jean-Philippe Fortin for invaluable input on the statistical analysis in this study.
Competing interests
All authors are employees of Genentech Inc., a member of the Roche group.
Availability of data and materials
TargetedMSQC package is available on GitHub (https ://githu b.com/shadi eshgh i/Targe tedMS QC). The skyline documents of the datasets in this study are available on PanoramaWeb repository (https ://panor amawe b.org/targe tedms qc.url).
Consent for publication
Not applicable.
Ethics approval and consent to participate
All donors provided informed consent for use of these studies with institu-tional review board approval for human collection protocols.
Funding
The study was funded by Genentech Inc., a member of the Roche group.
Publisher’s Note
Springer Nature remains neutral with regard to jurisdictional claims in pub-lished maps and institutional affiliations.
Received: 30 April 2018 Accepted: 24 September 2018
References
1. Picotti P, Aebersold R. Selected reaction monitoring-based proteom-ics: workflows, potential, pitfalls and future directions. Nat Methods. 2012;9:555–66.
2. Grebe SKG, Singh RJ. LC-MS/MS in the clinical laboratory—where to from here? Clin Biochem Rev. 2011;32:5–31.
3. Kitteringham NR, Jenkins RE, Lane CS, Elliott VL, Park BK. Multiple reaction monitoring for quantitative biomarker analysis in proteomics and metab-olomics. J Chromatogr B Anal Technol Biomed Life Sci. 2009;877:1229–39. 4. Addona TA, et al. Multi-site assessment of the precision and reproducibil-ity of multiple reaction monitoring-based measurements of proteins in plasma. Nat Biotechnol. 2009;27:633–41.
5. Kuzyk MA, et al. Multiple reaction monitoring-based, multiplexed, abso-lute quantitation of 45 proteins in human plasma. Mol Cell Proteomics. 2009;8:1860–77.
6. Peterson AC, Russell JD, Bailey DJ, Westphall MS, Coon JJ. Parallel reaction monitoring for high resolution and high mass accuracy quantitative, targeted proteomics. Mol Cell Proteomics. 2012;11:1475–88.
7. Schilling B, et al. Multiplexed, scheduled, high-resolution parallel reaction monitoring on a full scan QqTOF instrument with integrated data-dependent and targeted mass spectrometric workflows. Anal Chem. 2015;87:10222–9.
8. Ong SE, Mann M. Mass spectrometry-based proteomics turns quantita-tive. Nat Chem Biol. 2005;1:252–62.
•fast, convenient online submission •
thorough peer review by experienced researchers in your field • rapid publication on acceptance
• support for research data, including large and complex data types •
gold Open Access which fosters wider collaboration and increased citations maximum visibility for your research: over 100M website views per year •
At BMC, research is always in progress.
Learn more biomedcentral.com/submissions
Ready to submit your research? Choose BMC and benefit from: 10. Schiess R, Wollscheid B, Aebersold R. Targeted proteomic strategy for
clinical biomarker discovery. Mol Oncol. 2009;3:33–44.
11. Füzéry AK, Levin J, Chan MM, Chan DW. Translation of proteomic bio-markers into FDA approved cancer diagnostics: issues and challenges. Clin Proteomics. 2013;10:1.
12. Parker CE, Borchers CH. Mass spectrometry based biomarker discovery, verification, and validation—quality assurance and control of protein biomarker assays. Mol Oncol. 2014;8:840–58.
13. Crutchfield CA, Thomas SN, Sokoll LJ, Chan DW. Advances in mass spectrometry-based clinical biomarker discovery. Clin Proteomics. 2016;13:1–12.
14. Rosenberger G, et al. Statistical control of peptide and protein error rates in large-scale targeted data-independent acquisition analyses. Nat Methods. 2017;14:921–7.
15. Papac DI, Shahrokh Z. Mass spectrometry innovations in drug discovery and development. Pharm Res. 2001;18:131–45.
16. Kaltashov IA, et al. Advances and challenges in analytical characterization of biotechnology products: mass spectrometry-based approaches to study properties and behavior of protein therapeutics. Biotechnol Adv. 2012;30:210–22.
17. Peters FT. Recent advances of liquid chromatography-(tandem) mass spectrometry in clinical and forensic toxicology. Clin Biochem. 2011;44:54–65.
18. Pino LK, et al. The Skyline ecosystem: informatics for quantitative mass spectrometry proteomics. Mass Spectrom Rev. 2017. https ://doi. org/10.1002/mas.21540 .
19. Abbatiello SE, et al. Design, implementation and multisite evaluation of a system suitability protocol for the quantitative assessment of instrument
performance in liquid chromatography-multiple reaction monitoring-MS (LC-MRM-MS). Mol Cell Proteomics. 2013;12:2623–39.
20. Hoofnagle AN, et al. Recommendations for the generation, quantifica-tion, storage, and handling of peptides used for mass spectrometry-based assays. Clin Chem. 2016;62:48–69.
21. Reiter L, et al. MProphet: automated data processing and statistical valida-tion for large-scale SRM experiments. Nat Methods. 2011;8:430–5. 22. Rudnick PA, et al. Performance metrics for liquid
chromatography-tandem mass spectrometry systems in proteomics analyses. Mol Cell Proteomics. 2010;9:225–41.
23. Dogu E, et al. MSstatsQC: longitudinal system suitability monitoring and quality control for targeted proteomic experiments. Mol Cell Proteomics. 2017;16:1335–47.
24. Bereman MS, et al. An automated pipeline to monitor system perfor-mance in liquid chromatography-tandem mass spectrometry proteomic experiments. J Proteome Res. 2016;15:4763–9.
25. Choi M, et al. MSstats: an R package for statistical analysis of quantita-tive mass spectrometry-based proteomic experiments. Bioinformatics. 2014;30:2524–6.
26. Abbatiello SE, Mani DR, Keshishian H, Carr SA. Automated detection of inaccurate and imprecise transitions in peptide quantification by multiple reaction monitoring mass spectrometry. Clin Chem. 2010;56:291–305. 27. Wildsmith KR, et al. Identification of longitudinally dynamic biomarkers
in Alzheimer’s disease cerebrospinal fluid by targeted proteomics. Mol Neurodegener. 2014;9:1–14.