Cloud model-based analysis of regional sustainable water
resource utilization schemes
Fu Qiang
1,2,3*,
Meng Fanxiang
1,
Li Tianxiao
1,
Liu Dong
1,2,3,
Gong Fanli
1,
Amgad Osman
1,
Li Yutong
1(1. School of Water Conservancy and Civil Engineering, Northeast Agricultural University, Harbin 150030, China;
2. Heilongjiang Provincial Collaborative Innovation Center of Grain Production Capacity Improvement, Northeast Agricultural University, Harbin 150030, China; 3. Key Laboratory of High Efficiency Utilization of Agricultural Water Resource of Ministry of Agriculture,
Northeast Agricultural University, Harbin 150030, China)
Abstract: Given the adverse effects of current water shortages, low utilization and imbalance between the supply and demand, and other status quo problems relating to social economic development, the construction industry and agriculture, a cloud model was applied to a water resource system using five sustainable water resource utilization schemes for Kiamusze, Heilongjiang Province, as an example. This research changes the qualitative description of the concept language into a quantitative analysis of an evaluation indicator. A cloud model-based analytical method for regional sustainable water resource utilization schemes was proposed, and the sustainable grades of the water resources were calculated. The research results showed that, in addition to the natural continuation of such schemes, the development trends of four new schemes achieved the sustainable utilization of water resources, and thus, the sustainable water resource utilization was optimized. However, when the open-source, throttle, comprehensive and coordination schemes were subjected to the optimum applicability analysis, based on the limiting factors in different periods, resource availability and long-term development, decision-making regarding the best solution in different periods better ensures sustainable development in Kiamusze. The research results provide a significant theoretical basis for the formulation of scientific and reasonable sustainable water resource utilization strategies in Kiamusze.
Keywords: cloud model, regional water resources, sustainable utilization, normal cloud, scheme analysis DOI: 10.3965/j.ijabe.20160905.2529
Citation: Fu Q, Meng F X, Li T X, Liu D, Gong F L, Osman A, et al. Cloud model-based analysis of regional sustainable water resource utilization schemes. Int J Agric & Biol Eng, 2016; 9(5): 67-75.
1 Introduction
With rapid economic development, the demand for water resources has increased in Kiamusze, and thus, the imbalance between the supply and demand is becoming increasingly severe. In addition, water shortages,
Received date: 2016-04-13 Accepted date: 2016-09-01 Biographies: Meng Fanxiang, Master, Engineer, Research interests: system analysis of agricultural water and soil resources, Email: [email protected]; Li Tianxiao, Master, Engineer, Research interests: system analysis of agricultural water and soil resources, Email: [email protected]; Liu Dong, PhD, Professor, Research interests: system analysis of agricultural water and soil resources, Email: [email protected]; Gong Fanli, Master, Engineer, Research interests: system analysis of agricultural water and soil resources, Email: [email protected]; Amgad Osman,
pollution, low utilization, and other problems have also been exposed. These risks will threaten regional sustainable development in the future. Analyzing sustainable water resource utilization schemes will not only improve the efficiency of the optimum allocation of the water resources but also facilitate the development of
scientific and rational sustainable water resource utilization management strategies for Kiamusze, ultimately, and the achievement of regional sustainable development.
In 1992, the “International Conference of Water and Environment--Development Issues in the 21st Century” was held in Dublin, Ireland. The water resource system and the sustainable utilization research problems proposed by the conference aroused broad concern among scholars at home and abroad, and thus, sustainable water resource utilization research emerged[1,2]. Subsequently, an increasing number of scholars began to conduct in-depth research investigating indicators for sustainable water resource utilization evaluation, evaluation principles and evaluation methods[3-8], and a
series of improved methods for sustainable water resource utilization evaluation were introduced, such as the fuzzy four-element connection coefficient, the quantum genetic algorithm, the set pair analysis, and the evaluation method combining analytic hierarchy process with projection pursuit[9-12]. Most of these methods are
employed for sustainable water resource utilization evaluations based on the relationship between the existing annual actual indicator quantification value and the sustainable estimation scale standard, thereby reflecting the development level of the current sustainable water resource utilization system. However, when the uncertainty of the quantitative description of the evaluation indicator and the evaluation result grading are analyzed by these traditional methods, the self-uncertainty of these descriptions and evaluation is not considered, resulting in an inaccurate evaluation of the results[13]. For such common uncertainty in both the subjective and objective worlds, Li et al.[14] first proposed the state space theory and the cloud and language atomic models in the 1990s. Subsequently, the cloud model[15] was gradually improved and developed, and the exploratory qualitative-quantitative conversion[16] was achieved and successfully applied in many research fields, such as the intensive land use situations relating to development and utilization, air quality assessment, ship traffic adaptability and water resource-carrying capacity evaluations[17-23]. However, sustainable water resource
utilization analyses have rarely been reported. Therefore, this study will introduce the cloud model for the analysis of regional sustainable water resource utilization schemes, dynamically integrate fuzziness with randomness in the analysis process, and verify the rationality of the water resource schemes and sustainable utilization from the perspectives of persistence and feasibility, thereby evaluating the uncertainty of the regional sustainable water resource utilization. Then, the best scheme for regional sustainable water resource utilization in different periods of development will be screened, and policy guidance will be provided regarding the further development and utilization of the water resources in Kiamusze.
2 Materials and methods
2.1 Study area
Kiamusze is located in the northeast border of China in the heartland of the Sanjiang Plain where the Heilong River, the Wusuli River and the Songhua River converge (Figure 1). It is an important commodity grain producer and a key development zone in the Sanjiang Plain. Its total area is 32 704 km2. It is an economic and cultural
center and a traffic hub in the eastern region of Heilongjiang Province and has enormous potential for investment and development[24].
cross-border water supply is 2.84×10⁸ m3, whereas the development utilization rate is only 0.42%. Both the
cross-border water and surface water have substantial potential for development.
Figure 1 Geographic location of Kiamusze
2.2 Cloud model theory
2.2.1 Clouds and their numerical characteristics in an indicator system
(1) Clouds and cloud drops
The indicator system is defined as a cloud space, in which a unit cloud is related to the evaluation indicator system via the indicator grading standard, which corresponds to a domain of discourse C that can be represented by a precise numerical quantity with an appropriate qualitative concept Q. Moreover, the actual specific indicator x is the cloud drop that is dropped in the qualitative concept Q of its attribution indicator system; thus, we have a stable random number μ(x)∈[0, 1], which
is called the degree of certainty of x to Q. The distribution of x on C is called the cloud. The cloud is composed of many cloud drops, and the indicator system is thus composed of many indicator factors. The overall shape of the cloud reflects the important features of the
qualitative concept of the evaluation indicator. The indicator value quantitatively describes the qualitative concept, and the process of generating each cloud drop maps the uncertainty relationship between the qualitative concept and the quantitative description[25].
(2) Numerical characteristics of the cloud
The numerical characteristics are represented based on expectation (Ex), entropy (En), and hyper entropy (He),
and their distribution features[14] are shown in Figure 2. Combined with the evaluation indicator system, Ex is the
point that best represents the qualitative evaluation indicator concept in the sample data, and the peak value is the most representative water resource evaluation indicator value. Moreover, En represents the random
the dispersion degree of the specific indicator value and its range (based on the distribution characteristics of the normal cloud and the cloud drops that contribute to the qualitative concept, which mainly fall in [Ex−3En, Ex+3En]). The evaluation indicator value in [Ex−3En, Ex+3En] is denser, indicating that this section is more
important in the water resource evaluation indicator concept. Furthermore, He measures the uncertainty to
the entropy and reflects the cohesion of the evaluation indicator value in the overall space of the number field; higher hyper entropy correlates with a greater dispersion degree of the evaluation indicator value. Additionally, the greater the randomness of the degree of the membership is, the thicker the cloud is, and vice versa[17].
Note: Ex=0, En=1, He=0.1 and n=3000.
Figure 2 Digital characteristics of the cloud model
2.2.2 Cloud generator
The cloud generator is divided into a forward cloud generator and a backward cloud generator[25]. The forward cloud generator is mapped from a qualitative to a quantitative space to produce a cloud drop according to the numerical characteristics (Ex, En, He), which is a basic
cloud algorithm used to realize and obtain quantitative information from the qualitative expression of the concept language. The backward cloud generator is converted from quantitative to qualitative because the qualitative concept expressed by a cloud feature digit according to the specific quantitative value[17]. Their working principles are shown in Figure 3.
2.2.3 Modeling steps for water resource sustainable utilization based on the cloud model
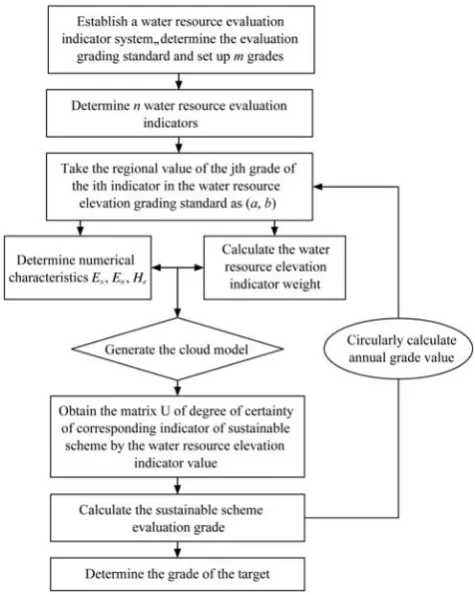
According to the aforementioned theories, the specific evaluation steps of the cloud model are as follows (see Figure 4):
Figure 3 Schematic diagram of the forward (backward) cloud generator
Figure 4 Flow chart of cloud model-based sustainable water resource utilization scheme evaluation
Step 1: Determining the cloud parameters in the water resource system
Determine 3 numerical characteristics of the cloud model according to the established water resource evaluation index and its standard:
( ) / 2 | | /6
x
n
e
E a b
E a b
H k
= +
⎧
⎪ = −
⎨
⎪ =
⎩
(1)
where, a and b represent the boundary values of the evaluation indicators in the attributed zone, and k is a constant that is regulated according to the fuzzy indicator threshold of the variable (in this study, He is taken as 0.1).
indicator weight
Because the impact of each evaluation indicator on the sustainable water resource utilization is different, its indicator weight also differs. In this study, the actual value of the evaluation indicator and the grading standard value (the larger value of the same indicator grading boundary) are used to calculate the weight vector of the evaluation indicator, where N={x1, x2, …, xn} is assumed
to be W={ω1, ω2, …, ωn}. Then,
1 i i n i i γ ω γ = =
∑
(2)1 1 1 1 q i j i m im i c q p m γ = = =
∑
∑
(3)where, n is the number of evaluation indicators, m is the grade number of the evaluation indicator, q is the evaluation year, ωi is the weight of the evaluation
indicator xi, ci is the indicator value of xi, pim is the grade
m standard value of xi, and γi is the average ratio of the
sum of the average indicator value of the q-year evaluation indicators and the evaluation indicator pim. In
this study, n=13, m=5 and q=23 (2008-2030).
Step 3: Generating the matrix of the degree of certainty using the forward cloud generator
Take En and Hecalculated in step 1 as the expectation
and variance, respectively, to generate the normality random number ( , 2)
i
n n e
E′ =NORM E H . Then, generate another normal random number ( , 2)
i
i x n
x =NORM E E′
using Ex as the expected number and Eni′2 as the
variance. This study utilized 23-year simulation data of 13 sustainable water resource utilization evaluation indicators in Kiamusze for ci in the system, and the
degree of certainty of the corresponding indicator was calculated using the following formula:
2 2 ( ) 2 i x ni c E E i e μ − − ′
= (4) The matrix of the degree of certainty of each evaluation indicator can be obtained as follows:
11 12 1
21 22 2
1 1
,
m
m n m
n n nm
U
μ μ μ
μ μ μ
μ
μ μ μ
× ⎛ ⎞ ⎜ ⎟ ⎜ ⎟ = =⎜ ⎟ ⎜ ⎟ ⎝ ⎠ L L
M M M M
L
n =1, 2,…,13;
m =1, 2,…,5.
Step 4: Calculating the sustainable water resource utilization scheme evaluation grading value
1
*
1 / 1
n
i i i nm
m m
j j
j j
q w
Q j q q
μ = = = ⎧ = × ⎪ ⎨ = × ⎪⎩
∑
∑
∑
(5)where, Q* is the scheme evaluation grading value.
Step 5: Repeating steps 1-4 to calculate the sustainable water resource utilization scheme evaluation grading value.
3 Results and analysis
3.1 The sustainable water resource utilization schemes
water resources. Table 1 shows the primary regulation measures of the five schemes.
Table 1 Main regulation measures for different sustainable water resource utilization schemes
Program
Surface water development and utilization
rate
Cross-border water supply
Groundwater development and utilization
rate
Industrial and agricultural
production water saving
Natural continuation
scheme
☆ ☆ ☆ ☆
Open-source
scheme ★↑ ★↑ ☆ ☆
Throttle
scheme ☆ ☆ ★↓ ★↑
Comprehensive
scheme ★↑ ★↑ ★↓ ★↑
Coordination
scheme ★comǁ ★com↓ ★com↓ ★com↓
Note: ☆ represents the measure that follows the natural continuation condition without regulation; ★ indicates that the relative measure is under dynamic regulation based on the natural continuation scheme; ★com indicates that relative measure is under dynamic regulation based on the comprehensive scheme; ↑/ǁ/↓, represent increase/invariant/drop respectively.
3.2 Establishment of a sustainable water resource utilization evaluation indicator system
A sustainable water resource utilization evaluation indicator system is the basis for the establishment of an evaluation model and is the primary objective of analyzing sustainable water resource utilization schemes[26]. Based on the fundamental principles of the
regional policy, the systematic objectivity and the overall operability and combined with the influencing factors, such as the balance between water supply and demand, the agricultural production capacity, the national economic level, and the water resource development and
utilization degree, a sustainable water resource utilization evaluation indicator system was established in Kiamusze.
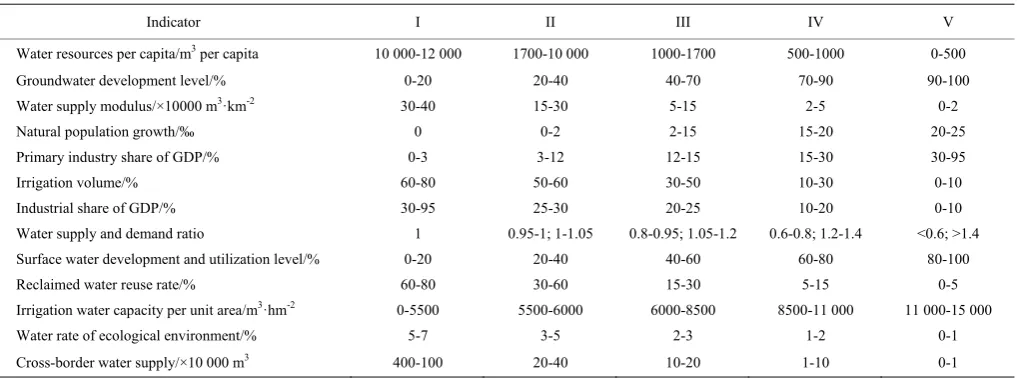
Another important task in sustainable water resource utilization analysis is the grading of the elevation indicator system. The generality of and differences in the indicator among the grading zones are indicated by judging the grade of the indicator. Thus, this study combines the water resource development and utilization characteristics in Kiamusze and screens the targeted indicator factors to establish five standard grades for sustainable water resource utilization evaluation in Kiamusze to achieve sustainable regional development[27] (Table 2). Grade I indicates that the sustainable water resource utilization prospect is good and that the balance between the water supply and demand is sufficient to support the coordinated development of a complex system of population-economy-resources-environment. Grade III indicates that the sustainable water resource utilization prospect is average and that the water resource supply and demand can support sustainable regional development. Grade V indicates that the sustainable water resource utilization prospect is poor and that the imbalance between the water supply and demand is large, that it will seriously limit industrial and agricultural production and socio-economic development, and that maintaining sustainable utilization will be difficult. Grades II and IV are intermediate grades. As different control measures and development and utilization patterns occur, grade II and grade IV shift towards the other three grades.
Table 2 Grading standards of the sustainable water resource utilization evaluation indicators in Kiamusze
Indicator I II III IV V
Water resources per capita/m3 per capita 10 000-12 000 1700-10 000 1000-1700 500-1000 0-500
Groundwater development level/% 0-20 20-40 40-70 70-90 90-100
Water supply modulus/×10000 m3·km-2 30-40 15-30 5-15 2-5 0-2
Natural population growth/‰ 0 0-2 2-15 15-20 20-25
Primary industry share of GDP/% 0-3 3-12 12-15 15-30 30-95
Irrigation volume/% 60-80 50-60 30-50 10-30 0-10
Industrial share of GDP/% 30-95 25-30 20-25 10-20 0-10
Water supply and demand ratio 1 0.95-1; 1-1.05 0.8-0.95; 1.05-1.2 0.6-0.8; 1.2-1.4 <0.6; >1.4
Surface water development and utilization level/% 0-20 20-40 40-60 60-80 80-100
Reclaimed water reuse rate/% 60-80 30-60 15-30 5-15 0-5
Irrigation water capacity per unit area/m3·hm-2 0-5500 5500-6000 6000-8500 8500-11 000 11 000-15 000
Water rate of ecological environment/% 5-7 3-5 2-3 1-2 0-1
3.3 Application of the cloud model
According to the 13 established sustainable water resource utilization indicators and the dynamic simulation data of each indicator from 2008 to 2030[28], the sustainable water resource utilization scheme in Kiamusze
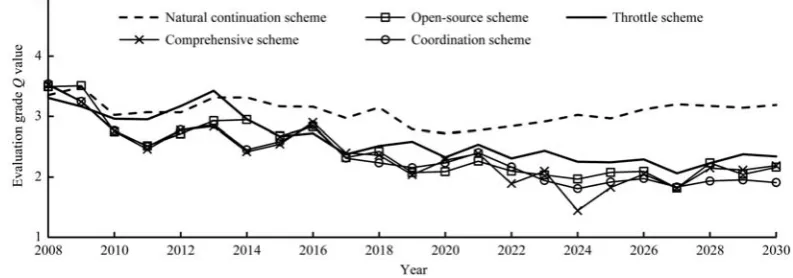
was optimized and evaluated using the cloud model. The sustainable utilization grading values of the five schemes for each year were calculated, and their development trends were analyzed to identify the best scheme for sustainable development in the region (see Figure 5).
Figure 5 Sustainable water resource utilization scheme grade trends
Figure 5 shows that, in addition to the natural continuation scheme, the other four schemes generally develop from grade III (“the basic sustainable state”) to grade II (“the sustainable transitional state”), indicating that the overall design adopted for the regional water resource system essentially reflected the development trend of the sustainable water resource utilization in Kiamusze. However, because the schemes consider different regulation measures, the amplitude of the variation of the scheme grade values also varies. The specific analysis results are as follows:
(1) The evaluation grade value of the natural continuation scheme in 2008 is 3.352, and it will remain 3.188 until 2030. Grade III persists for a long period, and thus, the sustainable utilization prospect is average. The water resource supply can support regional development, and thus, it corresponds to the basic sustainable state relative to the ideal development trend of sustainable water resource utilization. This is because the status quo continuation scheme is designed based on the state in 2008 without appropriately adjusting and managing the water resource system, leading to no significant increase in the sustainable water resource utilization capacity.
(2) The evaluation grade values of the open-source scheme and the throttle scheme from 2008 to 2030 developed from 3.493 and 3.308 to 2.163 and 2.343, respectively. The sustainable water resource utilization grade, which shifted from grade III to grade II, was
to develop cross-border water supply” will become the main basis for the efficient, stable and sustainable development of water resources in Kiamusze in the future.
(3) The elevation grade values of the comprehensive and coordination schemes will be 2.190 and 1.908, respectively, until 2030. The grade trend lines of both generally indicate stronger sustainable utilization ability. However, the trend of the comprehensive scheme fluctuates greatly, its sustainable utilization will be higher than that of the coordination scheme from 2019 to 2025, and its elevation grade value will reach 1.442 in 2024; however, after 2026, a slight upward trend will occur, and the evaluation grade value will be significantly higher than that of the coordinated scheme. This finding shows that increasing the water supply and reducing water demand as much as possible in combination with the open-source scheme and the throttle scheme when the regional water resources are extremely abundant might be beneficial for the regional water resources system. However, given the restriction of the economy, sociality, ecology, and many other factors, if the water resource system in Kiamusze does not consistently increase the water supply and reduce the water demand as much as possible, a decrease in the sustainable water resource utilization capacity caused by wasted resources, unsustainable economic development and other factors will occur; the mentioned benefits will only be achieved by regulating the surface water and the groundwater supply capacity as much as possible. The overall trend of the coordination scheme is more stable. From 2008 to 2030, the sustainable water resource utilization capacity will gradually increase and be converted from the basic sustainable utilization state to the sustainable utilization state. Regarding the long-term benefits, the coordination scheme is more conducive to the sustainable utilization of the water resources and sustainable development in Kiamusze.
4 Conclusions
In this study, the cloud model was applied to analyze sustainable water resource utilization schemes. The results obtained for 23-year sustainable water resource grade values of 13 evaluation indicators of the water resource system in Kiamusze are as follows:
When there are more regional water resource limiting factors and full measures cannot be regulated, the development of the open-source scheme will support the sustainable utilization of water resources;
When regional water resources are extremely abundant, even when maximum exploitation of the resources occurs, coordinated social, economic and ecological development will not be limited, and the comprehensive scheme is the best scheme to ensure the sustainable utilization of the water resources in Kiamusze.
In the long term, when the development of the regional water resources is subject to certain restrictions and the maximum exploitation of the water resources cannot be supported, the implementation of the coordination scheme is more conducive to achieving the sustained, stable and coordinated development of the water resources in Kiamusze. These results have important theoretical and practical significance for guiding the further rational development and utilization of the water resources in Kiamusze.
Acknowledgements
The Natural Science Foundation of China (51279031, 51479032, 51679039 and 51579044), the Heilongjiang Province Water Conservancy Science and Technology project (201318 and 201503), the Heilongjiang Province Outstanding Youth Fund (JC201402), and the Yangtze River Scholars Support Program of Colleges and Universities in Heilongjiang Province.
[References]
[1] Kallioras A, Ruzinski N. Sustainable development of energy, water and environment systems. Water Resour Manag, 2011; 25(12): 2917–2918. doi: 10.1007/s11269- 011-9888-9.
[2] Zilov E A. Water resources and the sustainable development of humankind: international cooperation in the rational use of freshwater-lake resources: conclusions from materials of foreign studies. Water Resour, 2013; 40(1): 84–95. doi: 10.1134/S0097807812030116.
[3] Ling H, Xu H, Fu J, Liu X. Surface runoff processes and sustainable utilization of water resources in Manas River Basin, Xinjiang, China. J Arid Land, 2012; 4(3): 271–280. doi: 10.3724/SP.J.1227.2012.00271.
sustainable utilization of urban water resources based on system dynamics: a case study of Jiamusi. Water Sci Technol: Water (Supply), 2016; 16(4): 980–991.
[5] Fu Q, Zhao K, Liu D, Jiang Q, Li T, Zhu C. Two-stage interval-parameter stochastic programming model based on adaptive water resource management. Water Resour Manag, 2016; 30(6): 2097–2109. doi: 10.1007/s11269-016-1273-2. [6] Fu Q, Zhao K, Liu D, Jiang Q, Li T, Zhu C. The application
of a water rights trading model based on two-stage interval-parameter stochastic programming. Water Resour Manag, 2016; 30(7): 2227–2243. doi: 10.1007/s11269- 016-1279-9.
[7] Fu Q, Zhu C H H, Jiang Q X, Guo H, Zhao K. Water resource management based on tradeoff analysis of multi-dimensional critical regulation and control indicators. Water Sci Technol: Water (Supply), 2015; 15(3): 552–558. [8] Jin J, Wei Y, Zou L, Liu L, Zhang W, Zhou Y.
Forewarning of sustainable utilization of regional water resources: a model based on BP neural network and set pair analysis. Nat Hazards, 2012; 62(1): 115–127. doi: 10.1007/s11069-011-0037-9.
[9] Dai T, S H, Sun S R, Zhao W H, Gu B Y. Evaluation of the sustainability of water resources system based on FAHP-PP model. Resources and Environment in The Yangtze Basin, 2009; 18(5): 421–426. (in Chinese with English abstract) [10] Zhao X L, Li Z H Y, Ding J. Application of improved
quantum genetic algorithm to the evaluation of sustainable utilization of regional water resources. J Nat Resour, 2007; 22(6): 980–985. (in Chinese with English abstract)
[11] Zhang D F. Evaluation of sustainable use of water resources in Wenshan based on AHP-BP model. J Water Resour Water Eng, 2013; 24(4): 203–209. (in Chinese with English abstract)
[12] Tan Q, Huang G H, Cai Y P. Multi-source multi-sector sustainable water supply under multiple uncertainties: an inexact fuzzy-stochastic quadratic programming approach. Water Resour Manag, 2013; 27(2): 451–473. doi: 10.1007/ s11269-012-0196-9.
[13] Cao Y S, Chen X N, Zhang W, Duan C Q. Application of evaluation model based on cloud theory in water resources carrying capacity. Journal of North China Institute of Water Conservancy and Hydroelectric Power, 2010; 31(4): 17–20. (in Chinese with English abstract)
[14] Li D Y, Liu C Y, Du Y, Han X. Artificial intelligence with uncertainty. J Softw, 2014; 15(11): 1583–1594.
[15] Li D Y, Liu C Y. Study on the universality of the normal cloud model. Eng Sci, 2004; 6(8): 28–34. (in Chinese with English abstract)
[16] Wang L, Wang Y R, Li X. An evaluation method of marine water quality based on cloud-model chart representation theory and its role in tourism of coastal cities. In: Zhu E, Sambath S (Ed.), Information Technology and Agricultural
Engineering Advances in Intelligent and Soft Computing. Berlin: Springer-Verlag, 2012. pp. 337–344.
[17] Wang M, S H, Zhu M. Evaluating intensive land use situation of development zone based on cloud models. Transactions of the CSAE, 2012; 28(10): 247–252. (in Chinese with English abstract)
[18] Ding H, Wang D. The evaluation method of water eutrophication based on cloud model. Acta Scientiae Circumstantiae, 2013; 33(1): 251–257 (in Chinese with English abstract)
[19] Zhu M, Wen Y Q, Xiao C H, S H, Hu Q B. Comprehensive evaluation of LNG ship’s traffic adaptability based on cloud model. J Wuhan Univ Technol, 2013; 35(7): 63–68. (in Chinese with English abstract)
[20] Zhang F, Zhang P L, Lv Zh Y, Wang P. Assessment of urban air quality based on cloud models. Environ Sci Technol, 2009; 32(6): 160–164 (in Chinese with English abstract)
[21] Fang F, Yu A M. The economic evaluation of the wind power projects based on the cloud model. In: Zhang W (Ed.), Advanced Technology in Teaching Advances in Intelligent and Soft Computing. Berlin: Springer-Verlag, 2012. pp. 443-448.
[22] Guo L, Bin F. Research on vehicle scheduling problem based on cloud model. In: Qu X, Yang Y (Ed.), Communications in computer and information science. Berlin: Springer-Verlag, 2012. pp. 28–35.
[23] Shi Y, Liu H, Sun J. The cloud model based on grey system theory and application on effectiveness evaluation. In: Huang D S, Bevilacqua V, Figueroa J C, Premaratne P (Ed.), Intelligent computing theories. Berlin: Springer-Verlag, 2013. pp. 31–38.
[24] Fu Q, Gong F, Jiang Q, Li T, Cheng K, Dong H, et al. Risk assessment of the city water resources system based on pansystems observation-control model of periphery. Nat Hazards, 2014; 71(3): 1899–1912. doi: 10.1007/s11069- 013-1004-4.
[25] Deng L, Chen S, Karney B. Comprehensive evaluation method of urban water resources utilization based on dynamic reduct. Water Resour Manag, 2012; 26(10): 2733–2745. doi: 10.1007/s11269-012-0036-y.
[26] Bao C, Fang C. Water resources flows related to urbanization in China: challenges and perspectives for water management and urban development. Water Resour Manag, 2012; 26(2): 531–552. doi: 10.1007/s11269-011-9930-y. [27] Li D Y, Shi M X, Meng H J. Membership clouds and
membership cloud generators. J Comput Res Dev, 1995; 32(6): 15–20. (in Chinese with English abstract)