Investigation of energy-efficient solid desiccant system for wheat drying
Shazia Hanif
1*,
Muhammad Sultan
1,2*,
Takahiko Miyazaki
3,4,
Shigeru Koyama
3,4 (1. Interdisciplinary Graduate School of Engineering Sciences, Kyushu University, Fukuoka 816-8580, Japan;2. Department of Agricultural Engineering, Bahauddin Zakariya University, Multan 60800, Pakistan; 3. Faculty of Engineering Sciences, Kyushu University, Fukuoka 816-8580, Japan;
4. International Institute for Carbon-Neutral Energy Research (WPI-I2CNER), Kyushu University, Fukuoka 819-0395, Japan)
Abstract: The study investigates the applicability of solid desiccant system for drying of freshly harvested wheat grains in order to reduce the moisture content to an optimum level. Fast and low-temperature drying systems are required by today’s drying industries in order to provide economical and safe drying. Therefore, comparison of desiccant drying has been made with the conventional method in terms of drying kinetics, allowable time for safe storage, the total time for drying cycle, and overall energy consumption. It has been found that the air conditions of proposed desiccant drying system provides a high drying rate and longer allowable storage time for safe drying. As the desiccants possess water adsorbing ability by means of vapor pressure deficit, therefore, the desiccant system successfully provides low-temperature drying which ensures the quality of wheat grains. Overall energy consumption is estimated for both conventional hot air drying and desiccant drying system. It has been found that the desiccant system requires less energy as drying is accomplished at minimum level of air flow and within allowable storage time. In addition, the overall performance index of the desiccant system is higher at all temperatures. The study is useful for developing a low-cost and sustainable drying technology for various agricultural products.
Keywords: desiccant, solid desiccant system, drying, grain, wheat, performance evaluation DOI: 10.25165/j.ijabe.20191201.3854
Citation: Hanif S, Sultan M, Miyazaki T, Koyama S. Investigation of energy-efficient solid desiccant system for wheat drying. Int J Agric & Biol Eng, 2019; 12(1): 221–228.
1 Introduction
Moisture adsorbing/absorbing materials have been used for the drying of agricultural products including wheat grains from ancient time[1]. Desiccants are hygroscopic materials and possess moisture adsorbing ability due to vapor pressure difference[2]. Therefore, it has been used for dehumidification and air-conditioning processes for various agricultural applications e.g. greenhouses[3] and agricultural product storage[4]. Certainly, desiccants possess the drying potential that can be used for various agricultural products, and consequently many studies have been reported in the literature[1,5-7]. In desiccant based drying system (DDS), the desiccant unit handles the latent load of drying air whereas heater is used for sensible heating of drying air to access the minimum vapor pressure. The ability of DDS to deal the sensible and latent component of vapor pressure distinctly[2] makes it versatile for drying of various agricultural products.
The drying conditions always influence the quality of agricultural produce, i.e. color, surface texture, cooking behavior,
Received date: 2017-09-24 Accepted date: 2018-12-27
Biographies:Takahiko Miyazaki, PhD, Professor, research interest: thermal energy conversion systems, Email: [email protected];
Shigeru Koyama, PhD, Professor, research interest: thermal engineering, Email: [email protected].
*Corresponding author: Muhammad Sultan, PhD, Assistant Professor, research interests: thermal air-conditioning and evaporative cooling for agricultural applications. Department of Agricultural Engineering, Bahauddin Zakariya University, Multan 60800, Pakistan. Tel: +92-333-610-8888, Fax: +92-61-9210298, Email: [email protected]; Shazia Hanif, PhD, Researcher, research interest: desiccant drying for agricultural storage. Interdisciplinary Graduate School of Engineering Sciences, Kyushu University, Fukuoka 816-8580, Japan. Email: [email protected].
etc. In addition, the drying temperature should be as low as possible to keep the nutrient retention. High drying temperature affects the product quality extremely e.g. in the form of decaying of vitamin C which is found in many fruits and vegetables and considered an index of nutrient loss[8]. All the agricultural products consist on numbers of the layers of biological materials which are very sensitive to temperature, hence drying of agricultural products is a complex process. It accomplished by two phase, i.e. constant rate and falling rate period[9]. During falling rate period, drying process is very slow as moisture remove from the inside of the product to the surface of the product. If the agricultural products expose to hot air for long period of time, it causes to burn or over dry of the outer surface. DDS provides low temperature and fast drying of vegetables to maintain its color and texture[10]. In addition, low regeneration temperature makes it possible to use solar energy or waste heat from the industry[11].
solely on drying application, Figure 1 presents the influence of high drying temperature on the quality of wheat grains which clearly shows the damage in wheat quality. In addition, pictorial view of insect attack[24] is also superimposed on the same figure which could be expected when non-favor able temperature/humidity conditions are employed to the grains. In this scenario, desiccant drying can be an optimum solution to provide low temperature drying by providing a certain level of vapor pressure difference. Drying of agricultural produce is usually expensive and it is considered high energy consuming process, i.e. 10%-25% of the total energy[25]. Conventional drying methods include, drying by
airflow, vacuum drying, and freeze-drying but these methods result in low drying rate[26-28]. Mainly there are two types of strategies
in practice, one of them is hybrid technology (combination of two or more different technologies) i.e., radio-frequency and microwave, infra-red combined with convective dryers[29],
microwave combined with freeze dryers[30] and infra-red combined
with freeze dryers[31] and others are desiccant based drying
technologies, for example, heat pump drying[32].
Figure 1 Influence of ambient air conditions on the quality of wheat grains: Effect of drying temperate (top right) and pictorial
view of insect attack (bottom)[24]
On the other hand, the DDS can be operated on low regeneration temperature[33] that can be supplied via low-grade waste heat preferably from solar thermal energy. Therefore, DDS can also help to provide low-cost drying with less energy consumption.
Post-harvested agricultural products including wheat grains possess high moisture level at the time of harvest and therefore cannot be stored for a long time unless proper storage/treatment has been employed[4]. In this regard, wheat grains need to dry up to a level of 14% moisture content (dry basis) to avoid mold growth as well as the insect’s attack[34,35]. It has been found in the literature that the DDS can address the environmental and economic issues of drying of wheat grains. According to [36], a drying system requires 19 h to bring the moisture content from 82% to 13% (wet basis) with the aid of air dehumidification whereas it takes 24 h without dehumidification, thereby, 21.5 kWh energy can be saved. Similarly, in another study by [7], the desiccant drying consumes
only 13.29 MJ/kg energy as compared to 60.4 MJ/kg in case of cocoa beans. In case of DDS, it is very important to select the optimum working range of system components to obtain maximum energy saving[37]. The drying time decreases with the decrease in air humidity and increase in air temperature, and collectively based on the net vapor pressure difference between grains and the encountered air. Therefore, the DDS can also play a role to reduce the drying time by providing fast adsorption rate process. In this regard, many studies on desiccant materials have been reported for total moisture adsorption equilibrium[38,39] and moisture adsorption rate[40,41]. Similarly, different parameters of desiccant based drying system are optimized for energy minimization, e.g. drying air temperature and drying rate[42]; desiccant rotor speed for optimum dehumidification and enthalpy recovery[43]; maximum energy saving[44]; desiccant rotor speed, temperature and velocity of regeneration air[43]. Consequently, the
study is objected towards the performance evaluation of DDS in compared with conventional drying system (CDS). Consequently, drying speed and corresponding energy requirements have been estimated and compared for both systems.
2 Proposed desiccant drying system
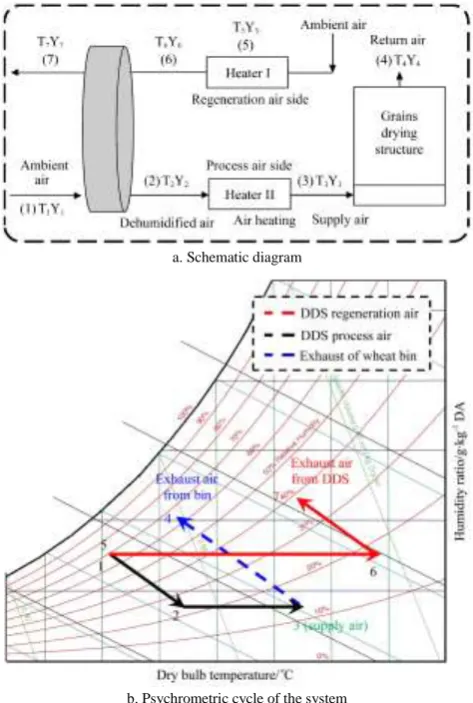
In this study, we proposed a solid DDS for the drying of wheat grains. Drying of agricultural products is crucial not only to avoid fungus/mold attacks but also to increase the shelf life of agricultural products[4]. It helps to minimize the demand and supply gap which ultimately brings economic stability of the agricultural products. Consequently, this can improve food shortage and malnutrition issues worldwide. Figures 2a and 2b represent the schematic and psychrometric diagrams of the proposed solid DDS. It mainly consists of: (i) a desiccant wheel used to dehumidify the air; (ii) heater for process air heating (bio-mass/gas or electric); (iii) drying bin/structure; (iv) heater for regeneration of desiccant wheel (electric driven or preferably bio-mass/gas driven). The numbers 1 to 7 showed in Figure 2 are the sequence and states of conditions of air during the drying process. It starts from the suction of ambient air by a desiccant wheel from state 1 to 2. At state 2, the specific humidity decreases from Y1 to Y2 due to adsorption of the moisture from the
air by the desiccant wheel. Furthermore, air temperature increases from T1 to T2 due to the heat of adsorption released by desiccant
material[33]. At state 3, air from the desiccant wheel further heated up to a certain temperature represented by T3 to establish a certain
vapor pressure deficit between the wheat grains and the encountered air. Thus, dehumidified and heated air moves forward from state 3 to state 4 while drying the wheat grains due to the vapor pressure deficit[3]. The air takes moisture from the grains while passing through it and therefore specific humidity increases (from Y3 to Y4) and temperature decreases (from T3 to
T4). The net conditions depend on the drying air condition
equilibrium with wheat grains. In Figure 2, state 5 to state 6 shows the heating of air from T5 to T6 for the regeneration of the
desiccant wheel. At state 6, heated air streams are passed through the desiccant which takes the adsorbed water as thereby the specific humidity increases from Y6 to Y7. During the drying process,
a. Schematic diagram
b. Psychrometric cycle of the system
Figure 2 Proposed solid desiccant drying system (DDS) for drying of wheat grains
3 Research methodology
In this study, authors used 10 t of wheat gains initially containing typical 26% of moisture contents (dry basis), for the calculations of CDS and DDS. The dryer size is determined by the drying area required per kg of wheat grains. Total volume required for wheat grains is calculated by means of Equation (1):
t
b W V
ρ
(1)
where, Wt is total weight of moist wheat grains, kg; and ρb is the
wheat bulk density, kg/m3. Therefore, volume of the drying bin of the wheat grain is 12.98 m3. The dryer area and height used for the drying calculation are 7.42 m2 and 1.75 m, respectively. As very high drying temperature can affect the quality of wheat grains, therefore, drying temperature is limit to 60°C according to the guidelines of FAO[45].
The modified Chung-Pfost Equation[46] can be used for the measurements of equilibrium relative humidity (ERH) of the air streams in the drying chamber. Therefore, it has been used in this study for the measurement of ERH of the air in the wheat drying chamber. The modified Chung-Pfost Equation has been defined in the form as given by Equation (2)[46]. It can be noticed that the Equation (1) uses three empirical coefficients, i.e. C1, C2 and C3,
which are supposed to optimize for the best fit against the moisture isotherm equations for the particular grains. In this study, the optimized parameters are obtained for the wheat grains from literature [47]. Consequently, the numerical values of the optimized parameters of C1, C2 and C3 for desorption isotherms of
wheat are 545.25, 64.047 and 0.17316, respectively.
1
3
3 2
lnERH C exp( C M)
T C
(2)
where, M represents the moisture content (dry basis) of the wheat grains in this study. The dry basis moisture content is the ratio of wheat moisture contents and dry grains of wheat, kg/kg. In order to reduce the moisture content of the wheat grains for safe annual storage to the optimum limit of the moisture content (i.e. 14%)[34], the drying time can be calculated by means of drying rate simply by using the well-known drying rate equation as given by Equation (3):
1
1( )
t
i i i
d
M M
t W
dw dt
(3)where, t is drying time, s; M is moisture content (dry basis); Wd is
drying matter of wheat grains, kg; and w is weight of moisture, kg.
The term dw dt
is drying rate, kg/s, which is calculation by
means of following relationship:
( )
a o i dw
k A Y Y dt
(4)
where, kaand A are the mass transfer coefficient, kg/(s·m2) and
area of drying structure/bin, m2, respectively; Yiand Yo are absolute
humidity of air, g/(kg DA) at inlet and outlet end of dryer, respectively.
As the mass transport is not a constant rate process, therefore, drying is considered as combination of constant and falling drying rate. It is assumed that the moisture is removed from the grain surface by the dry airflow for the first drying period. Later, water ceased to behave as it is on free surface and transported from the grain inside to the surface, thereafter, drying rate decreases which is known as falling drying rate. Consequently, thin layer drying model in the form of time and temperature, is used to predict the moisture content of grains during drying process as defined by Equation (5)[48]:
1 3 2 3 4 3 5 6
( )exp( ) ( )exp( )
t e
o e
M M
τ T τ τ t τ T τ τ t
M M
(5)
where, constants are τ1=0.03197, τ1=–1.009; τ3 =–0.034; τ4=
–0.032; τ5=1.9918; τ6=–0.009. The parameters T, t, Mt, Mo and
Me are drying air temperature (°C), drying time (min), moisture
content (dry basis) at time t, initial moisture content (dry basis) at t=0, and equilibrium moisture content at t=∞, respectively. Equilibrium moisture contents (Me) is calculated by using
Modified-Chung-Pfost Equation as defined by Equation (2) in the following form[48]:
3 2
3
3 1
1
ln ln
e
T C
M RH
C C
(6)
As thin layer drying model equation cannot precisely evaluate the drying time of 10 t wheat grains, therefore, for the sake of simplicity and counterbalance, it is only used to calculate the successive change in moisture content used in Equation (3), i.e. Mi–Mi+1. However, mass transfer coefficient is determined by
assuming packed bed air flow and governing equations as defined by Equations (7) to (10)[49]:
1 a
p p p
h Nuk ε
k
c C D ε
(7)
2 1
1
3 3
2
(0.5 0.2 )
u e e r
(1 ) p e ρvD R μ ε
(9)
p r
c μ P
k
(10)
where, ka is mass transfer coefficient, kg/(s·m
2
); h is heat transfer coefficient, J/(m2·s·°C); k is thermal conductivity, W/(m·K); N
u, Re
and Pr are Nusselt number, Reynolds number and Prandtl number,
respectively. The void fraction (ε) is estimated by means of bulk (ρb) and true (ρt) densities, kg/m
3
of wheat grains, respectively[50], i.e. ε=1–(ρb/ρt). The resulted value of ε is equal to 0.4375. The
particle diameter (Dp) is estimated by means of Dp=6Vp/Ap. The
value of particle volume (Vp) m
3
, and particle surface area (Ap) m
2
, obtained from the reference [51], consequently, the resulted Dp=
0.00347 m. The amount of moisture (Ww) to be removed from the
grains is calculated by using the following relationship:
( ) (100 ) i f w t f M M W W M
(11)
where, Ww and Wt are weight of moisture and total weight of moist
grains, respectively; Mi and Mf are initial and final moisture
contents (wet basis), respectively. The moisture contents can be changed to wet basis (Mwb) from dry basis (Mdb) and vice versa by
the following relationship.
100 db wb db M M M
(12)
Wheat grains in the top most layers of the drying bin contains high-level moisture as compared to the bottom layers, therefore, these are supposed to more susceptible to quality deterioration due to molds, fungus, etc. Therefore, the allowable storage time is set by means of temperature and moisture content of the grains in the top most layers of drying structure. Allowable storage time model of wheat drying is used to determine the number of days allowed for drying of grains[52]. The allowable storage time (tallow) equation
of drying systems can be written in the following form as given by:
log(tallow)=τ7+τ8Mt+τ9T4 (13)
where, tallow, Mt and T4 are allowable storage time, d, moisture
content wet basic, %, and air temperature, °C, respectively. The constant are τ7=4.129; τ8=–0.0997; and τ9=–0.0576. On the other
hand, time required to dry the grains depends on air flow rate, therefore, drying calculations are optimized within allowable storage time. Consequently, air flow rates are selected accordingly for the purpose of optimization.
Total energy consumption for DDS is calculated by the sum of thermal and mechanical energies. In case of DDS, thermal energy is used for air heating (Eth 2-3) and desiccant regeneration (Eth 5-6).
However, thermal energy is used for heating of air solely (Eth 2-3) in
the case of CDS. Input thermal energy associated with desiccant drying system for heating and regeneration is calculated as follows[53]:
Eth 2-3=FaCpt(T3–T2)
(14)
Eth 5-6=Fa,rCp,r(T6–T5) (15)
where, t is the time, s; Fa,r and Fa are the air mass flow rates, kg/s,
during regeneration and heating, respectively; Cp,r and Cp are the
specific heat capacities of air, kJ/(kg·K) during regeneration and heating, respectively. The parameters T6, T5, T3 and T2 are the
regeneration temperature, ambient air temperature, dryer inlet air temperature and desiccant wheel outlet air temperature, °C, respectively. It is noteworthy that the specific heat capacity and density of moist air is calculated from literature [54]. In addition,
mechanical energy consumed by the system is the sum of mechanical energy used for the handling and associated processes[53]:
Emec=Emec,1-2+Emec,3-4+Emec,6-7 (16)
Emec=(ΔPAregVregt)1-2+(ΔPAadsVadst)3-4+(ΔPAinVint)6-7 (17)
where, ΔP is pressure drop, kPa; t is drying time, s; Abin is drying
bin area, m2; A
adsand Areg are areas, m2, of the desiccant wheel at
adsorption and regeneration sides, respectively; Vin is air velocity,
m/s, at drying bin inlet whereas Vads andVreg are the air velocities,
m/s, of the desiccant wheel at adsorption and regeneration sides, respectively. For the conversion of electrical energy to mechanical energy, 46% device conversion efficiency factor is used[55]. The pressure drop across the processes and regeneration side of the wheel is assumed 0.325 kPa whereas for grain drying structure, it is calculated according to reference [56]:
2
Δ 123.9 1
2 1.657
Δ
in
e p
P ε ρV
L R ε D
(18)
where, Δ Δ P
L pressure drop per unit length of drying bin, m, in the direction of air flow. Specific energy consumption (SEC) is calculated which is the energy utilization for removing one kg of moisture for drying of wheat grains as given by [57]:
th mec w E E SEC W
(19)
where, SEC, Ww, Eth, and Emec are the specific energy
consumption(kJ/kg), the weight of water to be removed (kg), total thermal and mechanical energy consumptions (kJ), respectively. The coefficient of performance (COP) index is defined by the total energy consumed for removing water quantity (Ww) divided by the
total input energy to the dryer, as given by:
index w w fg
th mec th mec W h E
COP
E E E E
(20)
where, Ew is the energy consumed to remove mw, kg, of moisture
and it is calculated from latent heat of vaporization of water vapors, hfg, i.e. Ew=Wwhfg[53]. Latent heat of vaporization of water vapors,
kJ/kg, is calculated at any temperature by a correlation given by [58], i.e. hfg=2.503×10⁶–2.386×10³(Tabs–273.16).
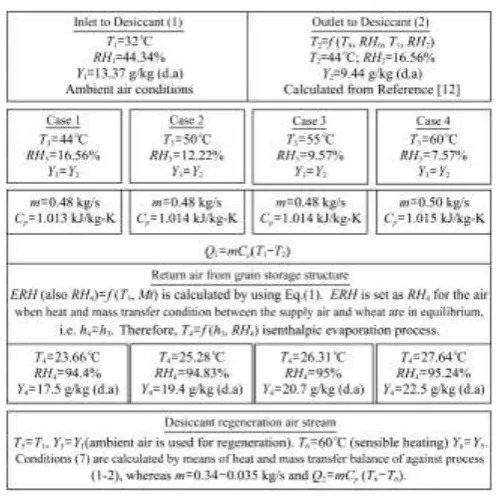
The simplified scheme and arrangement of the methodology used for the analysis of conventional and desiccant drying systems are given in Figure 3. The points presented in Figure 3 are corresponding to the state points used in Figure 2. The conditions of air associated with the desiccant wheel are estimated from reference [59]. The basic principle is to create vapor pressure deficit between the product and environment to accelerate the moisture removal. DDS control the latent load of the ambient air which helps to achieve drying at low temperature[60]. As low temperature and low humidity of drying air helps to conserve the nutrients[61]. In the reference study, a desiccant wheel of 580 mm diameter is used. The desiccant wheel is made up of polymer based desiccant material with frontal area ratio (process: regeneration) of 1:0.7. Consequently, the state 1 to state 7 shown in Figure 2 can be further explained as follows:
State 1: Typical ambient air condition, i.e. T1 = 32°C and Y1 =
13.37 g/kg DA.
State 2: Dehumidification of air takes place, and outlet conditions of the desiccant wheel are estimated from the reference study available in literature via reference [59].
State 4: Humidity of air is increased as it carries moisture from the wheat grains. This process is supposed to follow the isenthalpic process.
State 5: It is same as state 1 conditions, i.e. ambient air conditions.
State 6: Sensible heating of the air at T6 to regenerate desiccant
wheel.
State 7: Exhaust air conditions of the regeneration air from the desiccant wheel. It corresponds to the process 1 to 2.
Figure 3 Simplified scheme and arrangement of the methodology used for the analysis of drying systems
4 Results and discussion
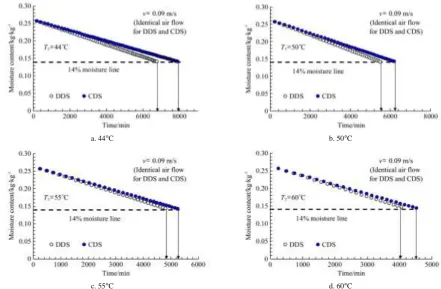
The equilibrium moisture content (EMC) is determined for DDS and CDS by using Equation (6). Figure 4 presents the drying of wheat grains from initial moisture content 26% (dry basis) to equilibrium moisture content at different drying air temperatures varying from 50°C to 60°C. The drying curves show that drying rate is constant at the start of drying process whereas it decreases as the moisture content approaches to the equilibrium moisture content. Drying rate decreases as the moisture gradient between the inside and outside of the grains decrease near the equilibrium conditions. In comparison with CDS, the DDS possesses high drying rate and takes relatively less time to approach a particular EMC value in order to provide a certain level of wheat grains drying. This behavior is consistent at all drying air temperatures. As EMC is a function of temperature and relative humidity, therefore, DDS drying air conditions are associated with the small value of EMC hence more driving potential for moisture ratio as expressed by Equation (5). However, drying air conditions of CDS require high EMC consequently delay in moisture content removal.
The effect of drying air temperature on drying cycle is presented in Figures 5a and 5d for both drying methods at 44°C, 50°C, 55°C and 60°C, respectively, in order to dry wheat grains up to a standard level of moisture content, i.e. 14% dry basis. It has been found that desiccant drying requires less drying time at all drying temperatures as compared to conventional drying method. This is due to the fact that dehumidified air provides more driving force for evaporation at same drying air temperature. It is also
indicated that increase in drying air temperature accompanied by a decrease in drying time. This is due to the fact that increase in air temperature speeds up the heat transfer between drying air and wheat grains due to the vapor pressure difference. In addition, high temperature may not favorable in order to keep the optimum quality of wheat grains as reported in the introduction section. As the maximum recommended drying temperature is 60°C for wheat and 44°C for seeds[37]. However, beyond this limit, it may affect the quality of grains in terms of color, vitamins, and nutrients. Grains drying at industrial level requires safe storage limit of moisture contents, otherwise, spoiling of grains may be the development of molds and fungus. Therefore, the allowable safe storage time is calculated by using Equation (13). Table 1 represents the allowable safe storage time for both drying methods at different supply air conditions. The allowable time for safe storage is based on initial moisture content and equilibrium temperature (T4). Therefore, DDS method gives more allowable
time as compared to the conventional system because it possesses low temperature at return air side (T4). Drying of grains within
the allowable time period is shown in Table 1. By increasing the supply air temperature for the same drying system, drying air velocity is adjusted to compensate the drying time within the allowable time. It can be seen that relatively higher drying air velocity is used for high-temperature supply air because allowable time decreases with high temperature. Higher air velocity is considered in case of conventional drying, it has less potential to carry out moisture and takes more time for the drying of the same quantity of grains. Minimum drying air velocity is optimized for all cases to complete the drying cycle which is about 2 h before the allowable time. Thermal and mechanical energy consumption per kg of dried grain is calculated for the moisture removal from 26% to 14% on dry basis, as presented in Figure 6. Total energy is increasing with the increase in drying temperature for both systems. It is ranging from 0.46 MJ to 0.50 MJ/kg of grain for DDS, whereas, it is ranging from 0.46 MJ to 0.56 MJ/kg of grain in case of CDS. On the other hand, thermal energies consumed are 0.44 MJ/kg, 0.46 MJ/kg, 0.48 MJ/kg and 0.484 MJ/kg of grain for DDS and 0.46 MJ/kg, 0.50 MJ/kg, 0.53 MJ/kg and 0.55 MJ/kg of grain for CDS, at drying air temperature of 44°C, 50°C, 55°C and 60°C, respectively. Conventional drying system consumed more thermal energy as compared to the desiccant drying for all drying air temperatures. Drying of grains at relatively higher ambient air humidity is the fact, which brings higher equilibrium moisture content for CDS method. It ultimately decreases moisture removal rate due to high vapor pressure. Therefore, high drying air velocity is required to complete drying cycle within allowable storage time which results in more energy consumption.
a. 44°C b. 50°C
c. 55°C d. 60°C
Figure 5 Comparison of drying time between CDS and DDS in order to dry wheat grains from 26% to 14% moisture contents at drying air temperature of 44°C, 50°C, 55°C and 60°C
Table 1 Optimum storage and drying time for conventional and desiccant drying systems at different drying air temperature
Drying air temperature/°C
DDS CDS
Air velocity /m·s-1 T4/°C
Drying cycle time1 /h
Optimum storage2 /h
Air velocity /m·s-1 T4/°C
Drying cycle time1 /h
Optimum storage2 /h
44 0.074 23.66 126.21 128.62 0.169 26.08 91.99 93.35
50 0.076 25.28 101.25 103.80 0.155 27.49 75.85 77.43
55 0.076 26.31 88.46 90.60 0.153 28.6 64.66 66.83
60 0.082 27.64 73.19 75.91 0.149 29.65 56.69 58.10
Note: 1 Time calculated for wheat grains drying from 26% to 14% moisture content. It depends on relative humidity and temperature of drying air, whereas drying air velocity is adjusted in order to complete the drying cycle with in the limit of optimum storage time. 2 Optimum storage is the time permitted for drying of wheat grains at particular drying conditions, which depends on moisture content (before drying) and temperature of wheat grains in the top layers of drying structure.
Figure 6 Thermal and total energy consumption by DDS and CDS systems at different drying temperatures in order to dry wheat
grains from 26% to 14% moisture content
Specific energy consumption (SEC) required to remove the unit mass of moisture from the wheat grains at different drying conditions in estimated for desiccant and conventional drying systems as shown in Figure 7. It has been increasing with the increase in drying temperature and ranging from 4.86 MJ/kg to 5.25 MJ/kg in case of DDS and 4.88 MJ/kg to 5.84 MJ/kg in case
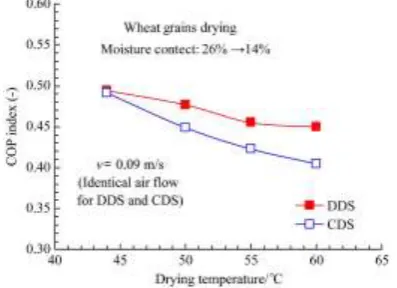
of CDS. The desiccant based drying method requires less energy consumption as compared to CDS at drying temperatures, and the results presented in Figure 7 are similar to the one obtained by [62]. Consequently, coefficient of performance (COP) index is estimated by means of Equation (20) and results are presented in Figure 8 for both drying methods. The COP index decreases with increase of drying temperature for both methods. However, it is ranging from
0.45 to 0.49 for desiccant drying and 0.40 to 0.49 for conventional drying. Therefore, it has been concluded that the desiccant based drying system provides low-cost and energy-efficient drying at fast drying rate while employing low drying temperature which ensures the quality of the wheat grains.
Figure 8 Overall performance comparison between conventional and desiccant drying system for different operating drying
temperatures
5 Conclusions
This study investigated the solid desiccant based drying system for wheat drying application. Thermodynamic expressions are presented in detail with the aid of available literature for the performance evaluation of desiccant drying systems. Results are compared with the conventional drying techniques in order to see the applicability of desiccant drying system. Quick and low temperature drying is the main objective of today’s drying industries that can be used for various applications including the wheat grains. In this regard, the desiccant can play a role due to their water sorption ability by means of vapor pressure deficit. The results of this study showed that the desiccant based drying process helps to provide low-temperature drying by which the quality of wheat grains will be can be assured. The study reports that the desiccant drying systems possess relatively higher drying rate as compared to conventional drying method. It could be useful not only for domestic drying applications but also for industrial applications. Upon comparison with conventional drying methods, it has been found that the proposed drying system is not only useful for providing quick and low-temperature drying but also helps in overall energy saving. The performance index of desiccant drying system is found higher than the conventional system at drying temperatures. It has been concluded that the desiccant based drying systems can provide low-cost and energy-efficient drying for wheat grains; therefore, this study helps to design sustainable and economical drying systems for developing countries.
[References]
[1] Watts K C, Bilanski W K, Menzies D R. Simulation of adsorption drying of corn, wheat, barley and oats using bentonite. Canadian Agricultural Engineering, 1987; 29 (2): 173–178.
[2] Sultan M, El-Sharkawy I I, Miyazaki T, Saha B B, Koyama S. An overview of solid desiccant dehumidification and air conditioning systems. Renewable and Sustainable Energy Reviews, 2015; 46: 16–29.
[3] Sultan M, Miyazaki T, Saha B B, Koyama S. Steady-state investigation of water vapor adsorption for thermally driven adsorption based greenhouse air-conditioning system. Renewable Energy, 2016; 86: 785–795.
[4] Mahmood M H, Sultan M, Miyazaki T, Koyama S. Desiccant
air-conditioning system for storage of fruits and vegetables: Pakistan preview. Evergreen Joint Journal of Novel Carbon Resource Sciences and Green Asia Strategy, 2016; 3(1): 12–17.
[5] Erdogan M, Graf S, Bau U, Lanzerath F, Bardow A. Simple two-step assessment of novel adsorbents for drying: The trade-off between adsorber size and drying time. Applied Thermal Engineering, 2017; 125: 1075–1082. [6] Kant K, Shukla A, Sharma A, Kumar A, Jain A. Thermal energy storage based solar drying systems: A review. Innovative Food Science & Emerging Technologies, 2016; 34: 86–99.
[7] Sari Farah D, Ambarita H, Napitupulu F H, Kawai H. Study on effectiveness of continuous solar dryer integrated with desiccant thermal storage for drying cocoa beans. Case Studies in Thermal Engineering 5. Elsevier, 2015; pp.32–40.
[8] Marfil P H M, Santos E M, Telis V R N. Ascorbic acid degradation kinetics in tomatoes at different drying conditions. LWT - Food Science and Technology, 2008; 41(9): 1642–1647.
[9] Fournier M, Guinebault A. The shell dryer-modeling and experimentation. Renewable Energy, 1995; 6: 459–463.
[10] Nagaya K, Li Y, Jin Z, Fukumuro M, Ando Y, Akaishi A. Low-temperature desiccant-based food drying system with airflow and temperature control. J. Food Eng., 2006; 75: 71–77.
[11] Uyun A S, Miyazaki T, Ueda Y, Akisawa A. Experimental investigation of a three-bed adsorption refrigeration chiller employing an advanced mass recovery cycle. Energies, 2009; 2: 531–544.
[12] Shamshiri R R. Advances in greenhouse automation and controlled environment agriculture: A transition to plant factories and urban agriculture. Int J Agric & Biol Eng, 2018; 11(1): 1–22.
[13] Shamshiri R R. Review of optimum temperature, humidity, and vapour pressure deficit for microclimate evaluation and control in greenhouse cultivation of tomato: A review. International Agrophysics, 2018; 32(2): 287–302.
[14] Bennis N, Duplaix J, Enéa G, Haloua M, Youlal H. Greenhouse climate modelling and robust control. Computers and Electronics in Agriculture, 2018; 61(2): 96–107.
[15] Gruber J K. Nonlinear mpc based on a volterra series model for greenhouse temperature control using natural ventilation. Control Engineering Practice, 2011; 19(4): 354–366.
[16] Ioslovich I, Per Olof G, Raphael L. Hamilton-Jacobi-Bellman formalism for optimal climate control of greenhouse crop. Automatica, 2009; 45(5): 1227–1231.
[17] Ismail W I W, Shamshiri R, Ahmad D, Janius R. Adaptability factors for open-field tomato production in east and west of Malaysia. in American Society of Agricultural and Biological Engineers Annual International Meeting 2015, vol. 3.
[18] Mashonjowa E, Ronsse F, Milford J R, Pieters J G. Modelling the thermal performance of a naturally ventilated greenhouse in zimbabwe using a dynamic greenhouse climate model. Solar Energy, 2013; 91: 381–393.
[19] Shamshiri R, Wan I, Wan I. Performance evaluation of ventilation and pad-and-fan systems for greenhouse production of tomato in lowland Malaysia. World Research Journal of Agricultural & Biosystems Engineering, 2012; 1(1): 1–5.
[20] Shamshiri R, Wan I, Wan I. A review of greenhouse climate control and automation systems in tropical regions. J. Agric. Sci., 2013; 2(3): 176–183.
[21] Shamshiri R, Wan I, Wan I, Desa bin A. Experimental evaluation of air temperature, relative humidity and vapor pressure deficit in tropical lowland plant production environments. Advances in Environmental Biology, 2014; 5–14.
[22] Impron. A greenhouse crop production system for tropical lowland conditions, 2011; 117.
[23] Shamshiri R R. Adaptive management framework for evaluating and adjusting microclimate parameters in tropical greenhouse crop production systems. in Plant Engineering, edited by S. Jurić. Rijeka: InTech. 2017. [24] Kozlowski T T. Insects, and seed collection, storage, testing, and
certification. Elsevier Science, 1972; 435p.
[25] Erbay Z, Arif H. Advanced exergy analysis of a heat pump drying system used in food drying. Drying Technology, 2013; 31(7): 802–810. [26] Clary C D, Wang S J, Petrucci V E. Fixed and incremental levels of
[27] Zhang M, Li C L, Ding X L. Optimization for preserva-tion of selenium in sweet pepper under low-vacuum dehydration. Drying Tech., 2003; 21(3): 569–579.
[28] Zhang M, Li C L, Ding X L. Effects of heating conditions on the thermal denaturation of white mushroom suitable for dehydration. Drying Techn., 2005; 23(5): 1119–1125.
[29] Raghavan G S V, Rennie F J, Sunjka P S, Orsat V, Phaphuangwittayakul W, Terdtoon P. Overview of new technologies for drying biological materials with emphasis on energy aspects. Brazillian J. of Chem. Eng., 2005; 22(2): 195–201.
[30] Duan X, Zhang M, Mujumdar A S, Wang R. Trends in microwave-assisted freeze drying of foods. Drying Technol., 2010; 28: 444–453.
[31] Chakraborty R, Mukhopadhay P, Bera M, Suman S. Infra-red-assisted freeze drying of tiger prawn: parameter optimization and quality assessment. Drying Technol., 2011; 29: 508–519.
[32] Ogura H, Mujumdar A S. Proposal for a novel chemical heat pump dryer. Drying Technol., 2000; 18: 1033–1053.
[33] Sultan M, Miyazaki T, Koyama S, Khan Z M. Performance evaluation of hydrophilic organic polymer sorbents for desiccant air-conditioning applications. Adsorption Science & Technology, 2017; 35(7): 1–16. [34] Whitesides Ralph E. Home storage of wheat. All Archived Publications.
1995; Paper 638. 10 (June).
[35] Bruce A. Agricultural engineer digest, https://www.extension.purdue.edu/ extmedia/AED/A ED-20.html [Accessed on 2018-02-16]
[36] Chramsa-ard W, Sirinuch J, Chatchai S, Sorawit S. Performance Evaluation of the desiccant bed solar dryer. Energy Procedia, 2013; 34: 189–197.
[37] De Antonellis S, Intini M, Joppolo C M, Romano F. On the control of desiccant wheels in low temperature drying processes. International Journal of Refrigeration, 2016; 70: 171–182.
[38] Sultan M, El-Sharkawy I I, Miyazaki T, Saha B B, Koyama S, Maruyama T, et al. Insights of water vapor sorption onto polymer based sorbents. Adsorption, 2015; 21(3): 205–215.
[39] Xia Z Z, Chen C J, Kiplagat J K, Wang R Z, Hu J Q. Adsorption equilibrium of water on silica gel. Journal of Chemical & Engineering Data, 2008; 53(10): 2462–2465.
[40] Sultan M, El-Sharkawy I I, Miyazaki T, Saha B B, Koyama S, Maruyama T, et al. Water vapor sorption kinetics of polymer based sorbents: Theory and experiments. Applied Thermal Engineering, 2016; 106: 192–202. [41] Sun B, Chakraborty A. Thermodynamic frameworks of adsorption
kinetics modeling: Dynamic water uptakes on silica gel for adsorption cooling applications. Energy, 2015; 84: 296–302.
[42] Abasi S, Minaei S, Khoshtaghaza M. Performance of a recirculating dryer equipped with a desiccant wheel. Drying Technology, 2016; 34(8): 863–870.
[43] Zhang L Z, Niu J L. Performance comparisons of desiccant wheels for air dehumidification and enthalpy recovery. Applied Thermal Engineering, 2002; 22 (12): 1347–1367.
[44] De Stefano A, Joppolo C M, Molinaroli L, Pasini A. Simulation and energy efficiency analysis of desiccant wheel systems for drying processes. Energy, 2012; 37(1): 336–345.
[45] FAO. Grain crop drying, handling and storage. Rural Structures in the Tropics: Design and Development, 2011; 363–411.
[46] Oberoi D P S, Sogi D S. Moisture sorption characteristics of dehydrated watermelon (Citrullus lanatus Thunb) pomace wastes. Journal of Food Processing and Preservation, 2017; 41(2): 1–6.
[47] Sun D W, Woods J L. The selection of sorption isotherm equations for wheat based on the fitting of available data. Journal of Stored Products Research, 1994; 30(1): 27–43.
[48] Debabandya M, Srinivasa Rao P. A thin layer drying model of parboiled wheat. Journal of Food Engineering, 2005; 66(4): 513–518.
[49] Whitaker S. Forced convection heat transfer correlations for flow in pipes, past flat plates, single. AIChE Journal, 1972; 18(2): 361–371.
[50] Bhise S R, Kaur A, Manikantan M R. Mositure dependent physical properties of wheat grain (PBW 621). International Journal of Engineering Practical Research, 2014; 3(2): 3–8.
[51] Gastón A L, Abalone R M, Giner S A. Wheat drying kinetics. diffusivities for sphere and ellipsoid by finite elements. Journal of Food Engineering, 2002; 52(4): 313–322.
[52] Fraser B M. Solargrain drying in Canada: A simulation study. Canada. Can. Agric. Eng., 1980; 22: 55–59.
[53] Ali M, Minaei S, Banakar A, Ghobadian B, Khoshtaghaza M H. Comparison of energy parameters in various dryers. Energy Conversion and Management, 2014; 87: 711–725.
[54] Tsilingiris P T. Thermophysical and transport properties of humid air at temperature range between 0 and 100°C. Energy Conversion and Management, 2008; 49(5): 1098–1110.
[55] Summers Claude M. The conversion of energy. Scientific American, 1971; 225 (3): 148–160.
[56] Molenda M, Montross M D, McNeill S G, Horabik J. Airflow resistance of seeds at different bulk densities using Ergun Equation. Transactions of the ASAE, 2005; 48(3): 1137–1145.
[57] Torki-Harchegani M, Ghanbarian D, Pirbalouti A G, Sadeghi M. Dehydration behaviour, mathematical modelling, energy efficiency and essential oil yield of peppermint leaves undergoing microwave and hot air treatments. Renewable and Sustainable Energy Reviews, 2016; 58: 407–418.
[58] Mortaza A, Mobli H, Rafiee S, Madadlou A. Energy and exergy analyses of the spray drying process of fish oil microencapsulation. Biosystems Engineering, 2012; 111(2): 229–241.
[59] Hyungmook K, Lee D-Y. Experimental investigation and introduction of a similarity parameter for characterizing the heat and mass transfer in polymer desiccant wheels. Energy, 2017; 120: 705–717.
[60] Hanif S, Sultan M, Miyazaki T, Koyama S. Steady-state investigation of desiccant drying system for agricultural applications, Evergreen, 2018; 5(1): 33–42.
[61] Kosuke N, Li Y, Jin Z, Masahiro F, Yoshinori A, Atsutoshi A. Low-temperature desiccant-based food drying system with airflow and temperature control. J. Food Eng., 2006; 75: 71–77.