September, 2015 AgricEngInt: CIGR Journal Open access at http://www.cigrjournal.org Vol. 17, No. 3 441
Nigeria’s grain resource structure and government sustainable
policy: a review
Ndukwu M. C.
*, Akani .O. A, K. J. Simonyan
(Department of Agricultural and Bioresources Engineering, Michael Okpara University of Agriculture, Umudike, Umuhia, P.M.B 7267, Abia State, Nigeria)
Abstract: Nigeria is rich in several food grain resources that empower the country with a large capacity to develop a food-grain policy. The current food-grain resource structure of Nigeria is reviewed in terms of production, milling, storage structure and issues confronting the sector growth, sustainability, policies and frameworks towards the actualization of food production efficiency. Total food-grain consumption (wheat, maize, sorghum and rice) decreased by 1.2 Mt in 2011-2013. Local consumption of wheat, and rice marginally increased by 191,000 and 500,000 t respectively in 2011-2013, that of maize and sorghum decreased by 1.5 Mt and 350,000 t respectively at the same period. About 76% of the total food grain consumption was produced locally in 2011/2012 while 73% was produced locally in 2012/2013. In 2011/2012, only 0.023% of wheat and 53.3% of rice was locally produced while 0.022% and 52.5% was produced in 2012/2013. The short fall in supply was met through importation. Challenges were found to exist, not only in low production capacity in the case of wheat but generally from low milling and storage capacity, which is less than 50% of the country’s total installed milling capacity. Challenges were also found to exist from energy production and distribution pattern, which alienates the grain hubs of the country, causing them to seek for costly alternative energy sources for drying, milling and storage. Dependence on import to fill the shortfall in local production is a problem. In addressing these challenges, the government plan was to treat food-grain production as a business by integrating food-grain production, storage and processing by value chain and adopting import-substitution measures to drive sector growth. For all this to work, it must follow a sustainable framework to enhance economic growth and reduce poverty.
Keywords: grains, storage structure, sustainable policy, grain reserves, Nigeria
Citation: Ndukwu, M. C., O. A. Akani, and K. J. Simonyan. 2015. Nigeria’s grain resource structure and government
sustainable policy: a review. AgricEngInt: CIGR Journal, 17(3): 441-457.
1 Introduction
1The world is plagued with climate change and the
uncertainty of weather condition all the year round.
Adverse weather condition in many countries has been
the bane of agricultural production. Nigeria is not
immuned to this weather problem as recently shown in
2012 by the flooding of the banks of the river Niger and
its tributaries up to the delta region. Also, the
continuing insecurity caused by activities of various
Received date: 2015-01-29 Accepted date: 2015-06-26
*Corresponding author: Ndukwu M. C., Department of Agricultural and Bioresources Engineering, Michael Okpara University of Agriculture, Umudike, Umuhia, P.M.B 7267, Abia State, Nigeria. Email: ndukwumcu@gmail.com, ndukwumcb@yahoo.com.
militant groups like the Boko Haram Islamic sect in the
Northern Nigeria continues to deter Nigeria’s
agricultural productivity and food availability (U.S.
Library of Congress, 2014). Therefore, the ability of
various countries especially those in Sub-Saharan Africa
to feed its population is the major issue confronting them
at the moment. Although agricultural production
contributed about 40% to the country’s GDP and grew
by 4.0% in 2012 (Central Bank of Nigeria Annual
Report, 2012), a lot of food is still imported, causing the
country to lose a lot of foreign exchange. The rebased
Nigerian economy in 2013 continues to show that since
1970 the economy is mainly dependent on proceeds from
crude oil and natural gas (Central Bank of Nigeria
has exposed the economy to the global market forces,
making it very vulnerable without any sector of the
economy acting as a buffer to absorb the shock if global
oil prices crashes (Ohunakin, 2013). A typical example
is the unsustainable spending profile that led to near
economic collapse when global petroleum prices and
stocks crashed in 1986 and 2008 -2009 (Suleiman, 2010;
Nigeria-Economy, 2005). The consequence was
external borrowing, mainly from the Paris club, which
raised its debt profile. This is because the huge
proceeds earned from crude oil were not diversified for
meaningful and sustainable development in other sectors
like agriculture. Therefore, poverty and hunger
continued to rise and people remain deprived of adequate
food supply. Nevertheless, with the rebased (gross)
Domestic Product (GDP), growth rate has increased by
1.7% from 2005 - 2012 (Central Bank of Nigeria Annual
Report, 2012; Central bank of Nigeria, 2012) rate, the
government is privatizing important sectors of the
economy, promoting public-private partnerships and
encouraging strategic alliances with foreign firms, for
infrastructure development and technology acquisition in
critical sectors such as security, power generation,
transportation, healthcare and agriculture (U.S. Library
of Congress, 2014; Central Bank of Nigeria, 2011;
National Bureau of Statistics, 2011). The targeted
objective is turning the country from net importer to net
exporter of several products. In achieving the target
above, the government has developed an economic blue
print called vision 20:2020, which believes that it will
transform the country and place it among 20 most
developed economies in the world. The high share of
grains in the overall food consumption of Nigeria
reflects the adoption of grains in meeting food energy
requirements both in the rural and urban areas in these
policies. This, however, led the government to the
process of restructuring grain production, processing and
storage and will cover the whole value chain, starting
from planting and harvesting, transportation, post harvest
processing, distribution and storage. Nigeria is a major
grain consumer, which accounts for about 80% of food
ration in the country. Nigeria alone, accounts for 30%
to 40% of all grain imports into West African sub region
(Inter-reseaux (Development rural) bulletin, 2014).
Between 2000 and 2008, these annual grain imports
represented an average annual cost of $939 million and
recently this has increased exponentially causing a drain
in the country’s foreign exchange reserve (Inter-reseaux
(Development rural) bulletin, 2014). Nigeria imported
nearly $1 billion worth of wheat in 2011-2012, with the
USA accounting for 70% of the market share as is shown
in Figure 1a. The country also imported nearly $1.5
billion worth of rice as is shown in Figure 1b from 2011
– 2012 (U.S. Library of Congress, 2014).
September, 2015 AgricEngInt: CIGR Journal Open access at http://www.cigrjournal.org Vol. 17, No. 3 443 This trend is worrisome and the consequence is that
the country has a large agri-food trade balance deficit,
which attained nearly $1.5 billion in 2002-2004.
Despite the widespread vegetation pattern in the country,
which can accommodate the production of different
kinds of grain, successive governments lacked the
political will to invest in grain production. Nigeria
therefore, continues to be a substantial net importer of
grains. Grain production is left in the hand of peasant
farmers who toil with little resources and the result most
of the times is not encouraging. What is produced is
lost due to spoilage or sold at give away price due to the
rush to sell because of inadequate facilities for proper
processing to attract higher price or poor storage
facilities. The situation is worst during the period of
glut when the excesses, which could have been used to
fill in the shortfall at other periods, are allowed to waste
or even fed to animals. This stems from moribund
storage structure and inappropriate distribution pattern of
the strategic grain reserves in the country. Therefore,
developing economies like Nigeria, with a population of
around 170 million people and constituting 2.4% of the
world population (U.S. Library of Congress, 2014)
require a robust access to reliable and advanced grain
milling and storage structure. Adequate and sustainable
grain supply will guarantee the nation’s economic
stability by reducing poverty level, improving health
conditions and enhance productivity (Ajayi and Ajanaku,
2007; Kalu and Tomasz, 2010). Importation of grains
depletes the nation’s foreign reserve and expands the
country debt profile with the population kept in abject
hunger and under development. In view of this, there is
a need to provide adequate information that is vital to the
realization of government vision (20:20:20) for
economic stability. In this paper the current problem
facing grain production, milling, storage and utilization
in the country as well as the efforts by the government to
sustain local production where summarized. In
addition, issues confronting growth and expansion of
grain processing, storage and distribution where
explained alongside with policies and frameworks
needed for the actualization of food (grain) efficiency
and conservation.
2 The ecological grain distribution zones
The ecology and climate of Nigeria from south to
north shows that different kinds of grains can thrive in
the country (Badmus and Ariyo, 2011). Figure 2 shows
the country’s ecological zones with rainfall heaviest in
the southern states, peaking in June-July and the forests
and savannas benefits from the abundant rainfall and
relatively short dry seasons here (U.S. Library of
Congress, 2014). The major grain grown here are rice
and maize. The far northern part, with a longer period
of dry season and low rain falls, lies mostly in the Sudan
Savanna and the arid Sahel zone. This region produces
grains massively, which include millet, cowpeas, and
sorghum (guinea corn). Maize is also cultivated, as
well as rice in suitable lowland areas. The wheat area
covers mainly the Sudan/Sahelian zones of Borno, Yobe,
Bauchi, Jigawa, Kano, Zamfara, Katsina, Sokoto, Kebbi
and Adamawa states, where commercial wheat
production is possible through the use of expensive
irrigation (Lyddon, 2011). Between the arid North and
the humid South is the Guinea Savanna region (referred
to as the middle belt). This area produces grains such
as, sorghum, millet, cowpeas, and maize, with rice as an
important crop in some places. The middle belt's
southern edge represents the lower limits of the northern
grain-dominated economy. Maize production in the
Savanna middle belt benefits from heavier rainfall,
which frequently permits two crops a year. According
to the International Grains Council (World- grain.com
news update, 2013), the county’s total grain production
in 2010-2011 was down by 700000 t from 28 Mt in 2009
3 Grain production and consumption (1970
-2013)
It has been noted that grains constitute 80% to 90%
of the per calorie intake of most Nigerian’s(Fafchamps
et al., 2003). In fact as at 1977-1983, sorghum and
millet combined accounted for 80% of the country’s total
grain production and intake before the emergence of
maize in 1984 (Simons, 1976; Reference book, 2006).
During this period, sorghum alone contributed about 50% of the country’s calorie intake and 73% in the Savannah
region (Simons, 1976). However, the demand for rice,
much of it imported, increased dramatically during the
bumper period of late 1970s because of increased
revenue from crude oil that enhanced the spending
profile of most Nigerians. Despite this, local
production did not improve until 1988 when the local
production jumped from 808,000 t in 1987 to 2.081 Mt
in 1988 (Reference book, 2006). The total production
of grains increased from 3106-7394.7 t for millet,
4053-10593.5 t for sorghum, 1443-10369.6 t for maize,
19-59.1 t for wheat and 884-4462.2 t for beans from the
1970 figure in 2005/6 (Reference book, 2006). The rise
in grain productions is due to the extension of cultivated
area than to any significant improvement in yields.
This is because yields either stagnated or progressed at a
very slow pace, putting the average yield per hectare at
1.0-1.5 t over the 2000-2006 period. However,
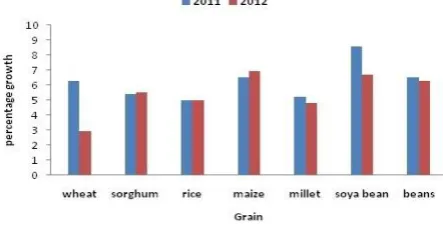
between 2011 and 2012, the growth rate of 0.1% was
recorded for sorghum, -0.4% for millet, 0.4 % for maize,
0.0% for rice, -3.4 % for wheat and -0.2 % for beans as
is shown in Figure 3 (U.S. Library of Congress, 2014)
and this is as a result of decrease in cultivated area
because of insecurity caused by insurgence, adverse
weather condition and consumer preference for imported
grain.
Figure 3 Growth in Production of grains (per cent)
2011 -2012: ( U.S. Library of Congress, 2014)
Recently, wheat consumption has continued to
dominate the spending profile of Nigerians among
various food grains. Changing consumer taste is also,
driving this expansion of demand for wheat. The
demand for wheat is projected at 4.2 Mt in 2013/14, up
from 4.1 Mt in 2012/13 (Fafchamps et al., 2003).
However, the nation is facing a herculean task in
September, 2015 Nigeria’s grain resource structure and government sustainable policy: a review Vol. 17, No. 3 445 Nigeria’s wheat production (85,000 t) fell further by 10.5%
in 2012/13 from 2011/12 production figure and this
represents a fall of 564.7% from the peak production of
565,000 t in 1988 (Reference book, 2006). This figure
is less than 0.023% of local consumption in 2013.
Maize (corn) production has increased from 2.4 Mt in
1961 to 7.7 Mt in 2012 as is shown in Table 1. In 2007,
the paddy rice production of six states of Niger, Kaduna,
Benue, Taraba, Ebonyi, and Kwara constituted more
than 60% of total domestic rice output (USAID, 2009).
The percentage contribution of various states to the
national rice output in 2004 is shown in Table 2. In
2008, Nigeria produced approximately 3.3 Mt of milled
rice and imported roughly 1.6 Mt, including the
estimated 800,000 t that is smuggled into the country on
an annual basis (Nigeria Federal Ministry of Agriculture
and Water Resources, 2008).
The volume of rice produced increased by 96.3%
between 1970 and 2013, reaching 7.5 Mt in 2012
(Inter-reseaux (Development rural) bulletin, 2014).
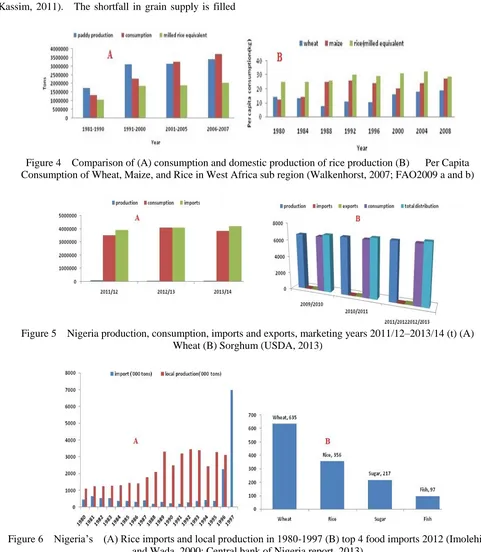
Almost all the grains produced in the country are
consumed as is shown in Figure 4 and Figure 5, while
the remaining is smuggled across the border to Niger,
Cameroun, Chad and Benin Republic. Figure 4a
showed that rice consumption is far more than the
locally milled equivalent. This explains the high
importation of rice into the country to cushion the deficit.
Table 1 Production, supply and demand data statistics of maize in Nigeria (USDA Foreign agricultural services, 2011)
Maize Nigeria
2011/2012 2012/2013 2013/2014
Market year begin Oct. 2011 Market year begin Oct. 2012 Market year begin Oct. 2013 USDA official; New post USDA official; New post USDA official; New post
Area harvested 5510 5150 4160 4160 4250 4250
Beginning stocks 266 266 266 266 146 146
Production 9250 9250 7630 7630 7700 7700
My imports 100 100 100 100 100 100
TY imports 100 100 100 100 100 100
TY imp. from USA 26 20 0 0 0 0
Total Supply 9616 9616 7996 7996 7946 7946
MY export 100 100 50 50 100 100
TY export 100 100 50 50 100 100
Feed and residual 1700 1700 1700 1700 1800 1800
FSI Consumption 7550 7550 6100 6100 5900 5900
Total Consumption 9250 9250 7800 7800 7700 7700
Ending stocks 266 266 146 146 146 146
Total distribution 9616 9616 7996 7996 7946 7946
1000HA, 1000MT, MT/HA
Table 2 Nigerian rice production by states (Ezedimma, 2005)
Production
system Major states covered
Estimated share of national rice area, %
Average yield, t/ha
Share of rice production, % Rainfed
upland
Ogun, Ondo, Abia, Osun,E Kiti, Delta, Niger, Kwara
Kogi, Sokoto, Kebbi, Kaduna, FCT And Benue 30 1.9 28
Rainfed lowland
Adamawa, Ondo, Ebonyi, Ekiti, Delta, Edo, Rivers, Bayelsa, Cross River, Akwa Ibom, Lagos, All Major Valleys E.G Shallow Swamps, Of Niger Basin, Kaduna Basin, And Inland Of Abakiliki And Ogoja
52 2.2 43
Irrigated Adamawa, Ebonyi, Cross River, Akwa Ibom, Lagos, Niger, Kaduna,
Sokoto, Kogi, Benue,Kebbi, Kano, Enugu, Kwara, Borno , Ogun State 16 3.7 28 Mangrove
Generally, grain consumption in West Africa has
increased since 1980 as is shown in Figure 4b. Though
Nigeria still remains the largest producer of food grain in
sub- Saharan Africa, her production and processing
capacity is below the total consumption in the country.
The mean output levels for rice, sorghum, millet and
maize, within the last 10 years, stood at 3,758,000,
9,928,000, 7,360,000 and 9,342,000 t, respectively
(Kassim, 2011). The shortfall in grain supply is filled
with cheap import, mainly from Thailand, India and
Vietnam. Despite this, domestic production of grains
generally has continued to grow (Figures 4, Figure 5 and
Figure 6). The nation is now faced with the challenge
of stifling sales of locally produced grains especially rice
by the imported ones. Since the lifting of importation
of rice by the federal government in 1996/97, Nigeria
has turned to a dumping ground for rice in Africa.
Figure 4 Comparison of (A) consumption and domestic production of rice production (B) PerCapita Consumption of Wheat, Maize, and Rice in West Africa sub region (Walkenhorst, 2007; FAO2009 a and b)
Figure 5 Nigeria production, consumption, imports and exports, marketing years 2011/12–2013/14 (t) (A) Wheat (B) Sorghum (USDA, 2013)
September, 2015 AgricEngInt: CIGR Journal Open access at http://www.cigrjournal.org Vol. 17, No. 3 447
3.1 Grain milling capacity
Small mills dominate the processing of domestic
grains in the country. In the heavy grain production
zones (such as Bida in Niger State, Abakiliki in Ebonyi
State and Laffia in Nasarawa State), there are clusters of
small mills that attract both traders and buyers and
ultimately serve as milling, parboiling and marketing
hubs (USAID, 2009). There are also classes of
medium-sized mills that are typically integrated with
relatively large-scale paddy rice production operations in
these areas. Under the former Nigerian Grains Board
(NGRB), there were three Rice Mills in the country
located at Badeggi in Niger state, Sokoto and Makurdi
respectively. Out of the three Mills, Badeggi Rice
Processing Company Limited appeared to be the biggest
in terms of supportive facilities and it is the only
surviving gigantic modern rice mill in the country today
among the three with an installed capacity of processing
120 t (Table 3) of paddy rice per day on three shifts of 8
h per shift per day (Badeggi Rice Mill, 2013).
However a number of major rice importers in the
country have invested in milling industry. Examples of
these private sector initiatives are: Veetee Rice in Ogun
State; Olam in Lagos, Benue, Nasarawa and Kwara
States; and Stallion in Lagos. As part of a backward
integration program, some of the companies have
developed nucleus estates that would use local farmers
as out growers to supply rice to the mills. Maize in
Nigeria is banned for export and very few quantities are
imported through informal cross border smuggling,
usually from Benin Republic. Most of the maize
produced is utilized in brewing and poultry feeds.
These companies have their own mill and it is difficult to
ascertain their milling capacity since they mill for
personal use in further production. However, various
small-scale milling points are scattered all over the
country. Records of the involvement of large milling
companies in the milling of maize in Nigeria are very
scanty. They are mostly involved in wheat milling and
currently there are about 21 wheat milling companies in
the country (Nigeria’s Flour Milling Industry, 2008) with
total installed capacity of 22,000 t/d in 2008. Flour
Mills of Nigeria controls about 38% of the market share.
Other top producers by installed capacity include
Dangote Flour Mills (18%), Honeywell, Ideal Group and
Crown Flour with 7%, 14% and 8% respectively.
Nigeria’s wheat installed milling capacity increased in
2012-2013 to about 8 Mt (wheat equivalent), up from 6.6
Mt the prior year. However, local capacity utilization
of installed milling capacity is put at about 50%
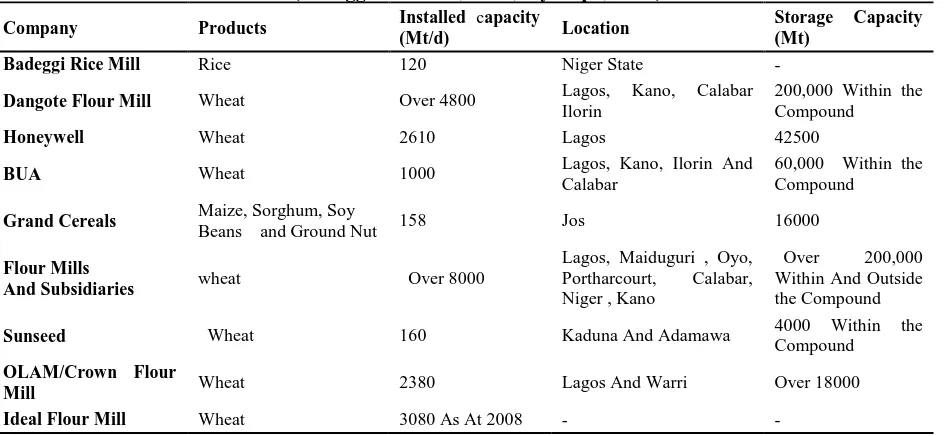
Table 3 Installed milling and storage capacity of some major grain milling companies in Nigeria (Badeggi Rice Mill, 2013; Oyedepo, 2012)
Company Products Installed capacity
(Mt/d) Location
Storage Capacity (Mt)
Badeggi Rice Mill Rice 120 Niger State -
Dangote Flour Mill Wheat Over 4800 Lagos, Kano, Calabar Ilorin
200,000 Within the Compound
Honeywell Wheat 2610 Lagos 42500
BUA Wheat 1000 Lagos, Kano, Ilorin And
Calabar
60,000 Within the Compound
Grand Cereals Maize, Sorghum, Soy
Beans and Ground Nut 158 Jos 16000
Flour Mills
And Subsidiaries wheat Over 8000
Lagos, Maiduguri , Oyo, Portharcourt, Calabar, Niger , Kano
Over 200,000 Within And Outside the Compound
Sunseed Wheat 160 Kaduna And Adamawa 4000 Within the Compound
OLAM/Crown Flour
Mill Wheat 2380 Lagos And Warri Over 18000
(Agritrade news analysis, 2014). Large mill
distribution and storage facilities are unevenly
distributed as is shown in Table 3, resulting in long
distance hauling of grains by transporters to be milled or
milled products to the various distribution and sales
centers through the various dilapidated roads. This is
very costly and discourages farmers as the cost involved
does not add up to the profit envisaged. Therefore
because of the constraints encountered in getting the
grains to the nearest mills most of them are wasted and
sometimes fed to animals. Although small milling
centers are common in most rice producing communities
but they face problem of energy supply for operation.
These problems of processing for sale and the attendant
wastage and seasonal shortage led various governments
in Africa to establish strategic grain reserves.
3.2 Challenges to grain production, expansion and
sustainability
3.2.1 Insurgency and herdsmen
Nigerian grain hub is located mostly in the area
affected by problem of insurgents. Nigerian goal of
achieving sustainability in grain production for now is
challenged by the activities of the Boko Haram Islamic
sect in the North Eastern region, with ecology for wheat
production. The farmers are under the threat of
insecurity posed by this sect. Also the farmers and the
herdsmen are constantly in conflict over grazing parts
which most often lead to fatal exchanges. The
herdsmen and their cattle destroy large grain farms and
with most of this farms uninsured, everything will be
lost.
3.2.2 Quality of locally processed grain
Most Nigerians prefer the polished rice imported into
the country than the local rice. This is because of low
processing quality of locally produced rice as they
contain so much of stones and impurities. The country
is faced with the problem of destoning machines in most
rice producing areas. According to (CIA World Fact
book, Nigeria, 2012), one can find well over 50 mills,
but no destoner in some part of the country. This is a
source of worry as so much money is spent in rice
importation to satisfy the local choice. Relying on the
import of staple food like grain on the global markets
fuels domestic inflation and puts pressure on the local
currency. Grain seats at the top of Nigerian food
imports that worth about 11 billion dollars if fish is
added (Figure 6b). According to a report by the
Federal Ministry of Agriculture in 2014, Nigerian food
import is growing at a rate of 11% per annum. This
situation is unhealthy for an economy that is
characterized by a high level of unemployment and low
technological capacity.
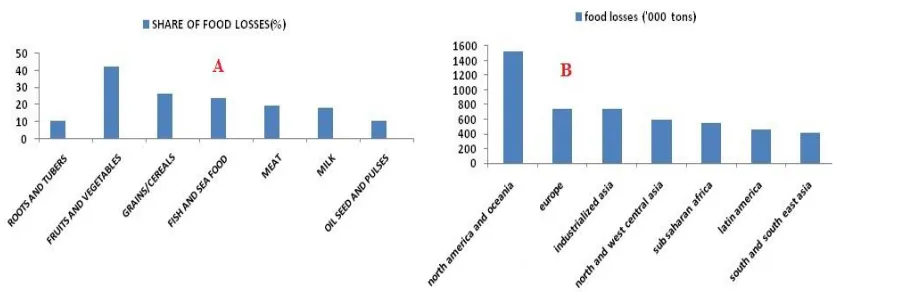
3.2.3 Issue of post harvest grain Losses
Food and Agriculture Organization (FAO) estimates
that 32% of all food produced in the world was lost or
wasted in 2009 with cereals/grain contributing about 26%
of the global share (Figure 7a) (FAO, 2011). About 4.5
Mt of this losses occurred in sub-Saharan Africa (Figure
7b) and with Nigeria producing and consuming more
than 50% of the food in sub-Saharan Africa, this
translates to nearly 2.25 Mt of food lost in 2009, with
grains accounting for about 26% of it (Inter-reseaux
September, 2015 Nigeria’s grain resource structure and government sustainable policy: a review Vol. 17, No. 3 449
Food loss and waste have significant negative
economic and environmental impacts. Economically,
they represent a wasted investment that can reduce
farmers’ incomes and increase consumers’ expenses.
Environmentally, food loss and waste inflict a host of
impacts, including unnecessary greenhouse gas
emissions and inefficiently used water and land, which
in turn can lead to diminished natural ecosystems and the
services they provide (Lipinsk et al., 2013). A major
problem with grain production in the country is lack of
adequate storage facilities. Experience has shown that
food production is not synonymous with food
availability if not matched with good storage system.
On average, 30% of grain output in the country is lost
due to spoilage, contamination, attacks by insects and
rodents, and physiological deterioration in storage
(postharvest losses). This high loss translates to loss of
revenue for the farmers (Lyddon, 2011). Government
large-scale grain procurement and storage is vulnerable
to waste, fraud, and abuse (The partnership for child
development (PCD), 2013). The resultant effect is that
during the period of glut most produced grain are either
not processed or fed to animals or allowed to rot away,
allowing imported grains to fill this gap in future.
Therefore, what should be most worrisome to the
government is stopping or reducing significantly
postharvest grain losses in the country. This becomes
imperative because a robust sustainable domestic food
grain production will improve the standard of living,
reduce poverty and boost the economy by contributing
immensely to the sectors growth of the GDP (Figure 8).
3.2.4 Inadequate, poor distribution and poor
management of grain storage facilities (Nigerian
Grain Reserves)
Storage is an essential phase between harvesting,
processing and consumption (Asoegwu and Asoegwu,
2007). Traditional grain storage with cribs, rhombus, Figure 7 Share of food loses or wasted in 2009 A- by percentage kcal B- by region (Lipinsk et al., 2013)
gourds, sacks, by hanging on roof tops, trees and fire
places and barns have not provided adequate protection
from rain, insects and rodents, resulting in 20%-65% loss
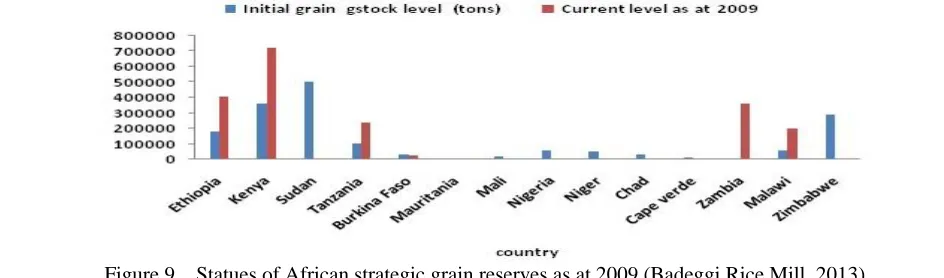
annually. Nigeria established strategic grain reserve in
1989 with initial stock level of 60,000 t (IFPRI, 2008)
(Figure 9) but as at 2014, due to poor management, the
level of targeted stock is hardly met.
The Nigerian strategic grain reserve is part of the
national food storage program launched in 1987 (Federal
ministry of Agriculture and Rural Development
(FMARD), 2014). The core objective is to stabilize
prices during scarcity and period of glut. Despite
concerns regarding their use and management, grain
reserves are being recommended by some experts to
checkmate high food prices, with a potential to smoothen
price volatility as well as reduce the impacts of other
food security shocks (FAO). If properly located and
distributed will absorb the excesses and serves as a
storage facility during the period of glut in production
and the market. Recent calls have been made by
governments and development partners for renewed
attention to strategic grain reserves in light of draughts in
Eastern and Sothern Africa. Grain stocks need careful
and steady attention with good management skill and
require good storage facilities. The stock should be
equipped with good rotating mechanism and operated
frequently for quality and health reasons. In practice,
this is rarely done because most grain stores in Nigeria
suffer from poor design, low capital allocation, lack of
electricity to power the agitators and dearth of
professionalism in terms of management skills.
Currently, commodities in the national strategic grain
reserves are corn (8,735 t), sorghum (7,227 t), millet
(2,299 t), soyabean (9,800 t) and paddy rice (6,000 t)
(USDA, 2014).
According to Borokini (Lipinski et al., 2013), the
existing Strategic Grains Reserve Complex in Nigeria
has a storage capacity of 325,000 t in 2009. However
in 2011, the national food reserve agency was expected
to have completed the construction of steel silo storage
with capacity for over 1 Mt of grain, primarily maize,
sorghum and millet, at 10 sites in key production areas
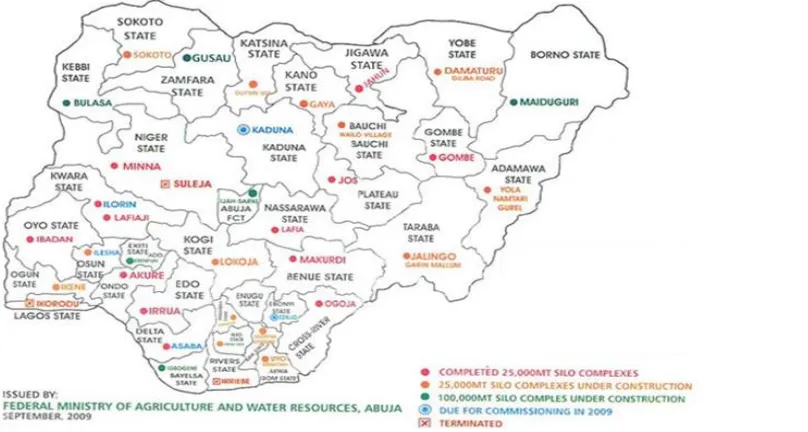
but the facts on ground does not suggest this. The latest
commissioned 25,000 t grain storage reserves in
Dusinma, Katsina State is an addition to the countries,
dilapidating grain reserve complexes littered all over the
country, as is shown in Nigeria grain reserve map
(Figure 10). The various grain reserves established in
the country (Figure 10) have not been functioning
efficiently due to poor management, fraud and initial
design problems. The FAO queried the decision to use
steel instead of concrete bins in the construction of silos
in many parts of the country. This is because of their
greater susceptibility to moisture migration and thus
their unsuitability for long-term storage of grain in the
humid climate of Nigeria. Moisture migration and
condensation in grain stock result in spoilage and is the
shortcoming of metallic silo cells. When metallic silos
were used, an estimated 25% to 30% post-harvest loss
September, 2015 Nigeria’s grain resource structure and government sustainable policy: a review Vol. 17, No. 3 451 for cowpeas (Anonymous, 2014). Modern silos and
warehouses of concrete, wood, mud and composite and
sizes to handle between 5-2500 metric tons of grains are
therefore required in several parts of Nigeria.
3.2.5 Low energy utilization in agriculture
The energy utilization in grain processing can be
viewed collectively with the entire agricultural sector.
Virtually all energy resources are available for grain
processing and storage. However solar energy still
remains the dominant energy used in rural areas mainly
for initial grain drying. Energy utilization in the
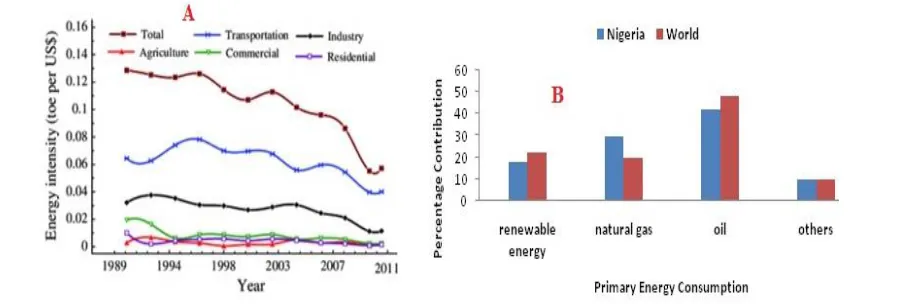
country is measured in terms of energy intensity. Abam
et al (2014) stated that whereas the cost and demand for
energy in all sectors of the economy is growing rapidly
at 7% per annum that of agriculture is shrinking with
dire consequences for agricultural production and
processing (Figure 11a). The energy intensity of the
agricultural sector decreased by 79.6% from 0.003 toe
per US$ 1,000 in 1990 to 0.001 toe per US$ 1,000 in
1998 and its contribution to the total energy intensity
between 1990-2011 is a paltry 1.2% (Abam, 2014). It
is correct to assume that the majority of energy
consumed in agriculture in Nigeria is mainly on grain
processing involving large and medium scale enterprises
in the milling of grains and little from households, which
uses mostly solar in the initial drying of grains. The
energy intensity of the agricultural sector with grain
processing dominating, can be used to measure the
sector performance and technological capacity utilization,
because agricultural mechanization involves the use of
all level of machines in agricultural cultivation, irrigation,
harvesting, processing and storage. Energy is also
consumed in transportation of grains from the rural
communities to the urban centers where they are
processed and mostly sold. The total contribution of
agriculture to the total energy intensity within these
years was 1.2%, indicating an abysmal energy use
(Abam et al., 2014). This shows the state and level of
capacity utilization of agricultural machines littered all
over the country including grain processing machines.
The intensity of energy use in the agricultural sector was
very low Vis-à-Vis grain processing between 1998 and
2011. To worsen the situation, electricity and fuel
supply in recent years has been epileptic and costly.
Private generation of power through available
non-renewable energy resources and its utilization in
grain processing is not cost sustainable in rural areas.
Nigeria energy consumption relies heavily on
unsustainable non renewable energy, mainly crude oil
resources are mostly, inefficient hydropower from
various aging damns. The rural communities where
much of the initial grain processing is done, energy
supply in terms of fuel or electricity is inadequate or
nonexistent. This stems from the fact that most of the
states in the country are not linked to the national
electricity power grid. Some derive their power from
small power stations located at Afam, Egbin, Sapele and
Ugheli. Mechanized grain processing, milling and
storage in particular require a lot of energy (renewable
and non-renewable).
3.2.6 Unfavourable energy distribution pattern to
grain producing area
Government emphasis has been on the supply of
energy to the urban centers and industrial areas while
neglecting the agro-producing rural communities thus;
causing an energy inequality within the country’s energy
demand profile. This limits the grain processing,
milling and storage capacity of these communities in
view of the high cost of sourcing alternative private
energy generation, leading to the loss of a large quantity
of unprocessed grains. The current urban-centered
energy strategy is inadequate, as instances of rural and
sub-rural energy demand and distribution do not get to the center phase of the country’s energy expansion plans
(Oyedepo, 2012). A situation where energy carrier to
agricultural communities is mostly single phased is not
suitable for agro-processing and related industries, which
are usually equipped by three-phase powered machines.
This current situation should be reviewed. For
sustainable food grain supply, sufficient and dependable
energy supply system for all types of energy carriers to
the rural communities will be necessary. The energy
distribution pattern of the government, need to change to
give more consideration to the rural communities. This
will ensure adequate availability of energy in the rural
areas for grain processing, milling and storage. Hence,
for sustainable development, the energy demand and
supply chain must be repositioned to attain a reasonable
equilibrium (Abam et al., 2014). Nigeria has enough
energy resources to meet with the challenges of energy
demand. The current dependence of agro rural
communities solely on wood and traditional biomass for
their energy need should be replaced with a robust and
cheap energy supply system to enhance productivity.
According to Chel and Kaushik (Chel and Kaushik, 2011)
sustainable agricultural system is based on the prudent
use of renewable and/or recyclable resources. A
system which depends on exhaustible resources such as
fossil fuels cannot be sustained. Potentials of
alternative energy sources (renewable energy) in the
sector are largely unexplored due to inadequate research,
knowledge and technology to harness them.
3.2.7 Poor policy, policy summersault and poor policy
implementation
Nigeria’s efforts at exploiting its grain growing
potential are challenged by inconsistent agricultural Figure 11 Energy intensity by sectors (A) and consumption (B) in Nigeria and the world (1990–2011)
September, 2015 Nigeria’s grain resource structure and government sustainable policy: a review Vol. 17, No. 3 453 policies, poor marketing channels, and weak farming
organizations and motivation. In 1987, the government
initiated the Accelerated Wheat Production Program in
order to encourage local wheat production. This
programme led to a decline in wheat importation that
year and government was encouraged to outrightly ban
wheat imports into the country. Wheat production
figures from that year increased from 139,000 to 515,000
t in 1992 (Reference book, 2006), whereas the estimated
total national demand stood at about 3.7 Mt per year, as
the report stated. The government lifted the import ban
on wheat in 1993. Nigeria’s wheat production figures
then declined to 33,000 t, that year given that local
production was no longer viable because of cheap wheat
from USA flooding the local market. Also the Nigerian
government in September 2008 lifted the import ban on
maize and imports are allowed at 5% tariff with the
thinking that the country has attained self sustainability
in maize production. The government believes that
importing maize into the country is not profitable,
therefore local consumers, brewers and poultry farms
have relied on domestic supply for their needs. This is
against the import substitution policy the previous
governments have adopted. At the same time,
government lifted import ban on sorghum also in 2008
and a tariff of 5% was imposed too. In 2008, Nigeria
released its National Program for Food Security (NPFS),
laying out dozens of constraints to food security and
adopting a “value chain approach” to address these
constraints. The vision of the NPFS is “to ensure
sustainable access, availability, and affordability of
quality food to all Nigerians and to be a significant net
provider of food to the global community. The NPFS
lists rice as the second most important food security crop.
It is important both for consumption and as a source of
revenue for small farmers in rural areas. In order to
achieve the above set goal, the government introduced
the National Rice Development Strategy (NRDS). The
NRDS recognizes the importance of the value chain
approach, but is government-driven and does not reflect
coherent incentives to upgrade private-sector
participation to respond to the challenge (USAID, 2009).
This policy failed to achieve the set objective because
emphasis was on production without facility for storage.
By 2010, rice importation continued to increase,
prompting the government to introduce new tariffs
(effective July 1, 2012) which brought a 30% levy on
imported brown rice and a 100% levy on imported
polished/milled rice (effective December 31, 2012), with
intention to ban rice imports within two years. The
new tariffs resulted in increased stockpiling by importers
and increased cross-border trade in rice (with Benin and
Cameroon) during the second half of 2012.
4 Current government intervention policy
Wheat: According to world grain bulletin published
in 2011, the first major Government of Nigeria
intervention on food grain production was on wheat
production in 1959 and was necessitated by the
development of irrigation schemes for Northern Nigeria
and increase local demand of flour (Lyddon, 2011).
The report indicated that the same year, there were
increased research in promoting local wheat production
resulting in the introduction of some improved (and high)
and early-yielding local wheat varieties for better bread
making. The Lake Chad Research Institute of Nigeria
collaborated with the International Maize and Wheat
Improvement Center (CIMMYT) to do so (World-
grain.com news update, 2013). However, the
government targeted to plant 212,000 ha of wheat by
2014, with expected production of over 1 Mt and a
projection to expand the cultivated area to 215,000 ha by
2015 with an anticipated output of 1.2 Mt. This goal,
though still a mirage but if met, would allow the country
to meet about 68% of its wheat needs by 2015.
However, the country is seeking for alternative route to
reduce wheat import and consumption through a policy
compelling cassava flour inclusion in wheat flour as
from 2012. Inclusion starts with a 10% cassava flour
40% by 2015. As a part of the plan, the government
has imposed import tax (levy) of 15% on wheat grain
(which has increased the effective duty from 5% to 20%).
A 65% levy was also imposed on wheat flour imports
bringing the effective duty to 100% since mid-2012, as a
part of this new policy. The government also
introduced fiscal incentives to local industry to stimulate
increased domestic production and processing of
cassava.
Rice: According to the Central Bank of Nigeria
annual report of 2012, as part of the rice transformation
plan, the government is to establish three new rice
processing mills in Ebonyi, Niger and Kebbi States, with
a combined annual capacity of 90,000 t of milled rice.
Also, the Federal government secured a low interest
financing facility to support private sector operators for
the establishment of 100 large-scale integrated mills for
improved rice production (estimated at over US$ 800
million). The rice processing mills would have a
combined capacity of 2 Mt per year. As an incentive to
these companies, the government has granted a
concessionary duty of 5% on brown and paddy rice that
will initially allow them to import these supplies until
such a time that they can source sufficient domestic
supplies to operate their mills at full capacity. In order
to encourage the companies, the government is procuring
385.5 t of milled rice to be distributed to out-growers at
no cost under the transformation action plan from twelve
large mills located in Bauchi, Benue, Cross River,
Ebonyi, Enugu, Jigawa, Kano, Nasarawa and Zamfara
states (Central Bank of Nigeria Annual Report, 2012).
5 Government grain transformation action
plan
One of the major strategies to meet food grain
demand is through the adoption of a government-enabled,
private sector-driven approach. The Federal Ministry
of Agriculture and Rural Development have drawn a
contingency plan to improve grain production. Part of
the plan is for government to (1) treat food grain
production as a business by Integrating food grain
production, storage and processing by through value
chains approach where the country has comparative
advantage and adopting import-substitution measures to
drive sector growth; (2) investment-driven strategic
partnerships with the private sector; (3) investment
drives to unlock potential of the states in grain
production (joint initiatives with state governments); (4)
to make Nigeria self sufficient in grain production and
ensure availability of adequate numbers of integrated
mills and seed companies; (5) new incentives for private
sector (0% duty on all agricultural machinery and
equipment) (Nigeria’s Agricultural Transformation
Agenda (ATA), 2014). This strategy has resulted in the
growth of seed companies in the country from 11 to 70
in 2012. The need for affordable agricultural financing
is being tackled while the new CBN financing
framework for agriculture, will unlock $3.5 billion of
loans from banks at attractive interest rates to farmers.
The government has also developed other agricultural
policies and programs as a component of the vision
(20:2020). They include Federal Government
Agricultural Transformation Action Plan (ATAP)
supported by the World Bank ($2.2 billion) and
International Fund for Agricultural Development (IFAD,
$80million) under the Growth Enhancement Support
Scheme (GESS), designed to give farmers timely access
to agricultural input (Central Bank of Nigeria Annual
Report, 2012). A breakdown of the figure indicated
that US$ 150 million was earmarked for the Commercial
Agricultural Development Project (CADP); US$150.0
million for the Fadama Development Project; US$500.0
million to finance the agricultural value chain, while the
balance of US$400 million was for financing irrigation
infrastructure. Other supporting are Bill and Melinda
Gates Foundation (US$5 million), United State Agency
for International Development(USAID, $ 100 million),
UNDP ($ 1.5million), DFID (£37 million) and OPIC
September, 2015 Nigeria’s grain resource structure and government sustainable policy: a review Vol. 17, No. 3 455 procurement opportunities for farm inputs and provision
of storage facility (U.S. Library of Congress, 2014).
6 Conclusion
Nigeria is the largest and most populated country in
Africa; a fast-developing nation but is lagging behind
among food grain producing countries in the world
especially wheat and rice. Total food grain
consumption (wheat, maize, sorghum and rice)
decreased from 24.95 Mt in 2011 to 23.74 Mt in 2013
(Imolehin and Wada, 2000). While the local
consumption of wheat, and rice increased marginally by
191,000 and 500,000 t respectively in 2011-2013, that of
maize and sorghum decreased by 1.5 Mt and 350,000 t
respectively at the same period. About 76% of the total
food grain consumption (wheat, maize, sorghum and rice)
is produced locally in 2011 while 73% was produced
locally in 2013. This high percentage is deceptive
because maize and sorghum are massively produced
locally and almost have equilibrated with the local
demand. Only 0.023% of wheat and 53.3% of rice
were locally produced in 2011/2012, while 0.022% and
52.5% respectively of these were produced in 2013.
This short fall in food grain production is met through
food grain importation from USA and Asia. Nigeria
would have attained sustainability and even exported
food grain especially rice, beans, maize and sorghum if
the basic processing, milling and storage needs of the
rural farmers have been met. The country is still
lacking in terms of providing sufficient energy to run her
grain sub agricultural sector despite the high demand for
food grain. Most of the challenges facing the country
in sustainable supply of food grains for local
consumption were found to exist not only in low
production capacity in the case of wheat but generally
from low milling and storage capacity, which experts has
said to be less than 50% of total local production
capacity. Further challenges were found to also exist
from poor energy production and distribution pattern
which alienates the grain hubs of the country causing
them to seek for costly alternative energy source for
drying, milling and storage of grains. Nigeria is
endowed with vast deposit of renewable and non
renewable energy resource. Dependence on foreign
grain resources to fill the local production gap, poor
utilization of the available grain reserve to checkmate
wastage during glut, low private sector participation in
bulk grain milling and inconsistent government policies
are serious challenges. In a bid to address these
problems government has put in place an ambitious
strategy for sustainable growth in food grain supply.
One of the strategies is to treat grain production;
processing and milling as business by incorporating
private sector participation by value chain where the
country has comparative advantage. This policy is
expected to be implemented in a sustainable way to
achieve the required equilibrium in demand and supply
of food grain in the country. This will reduce food
losses and there by boost the country’s production
capacity.
References
U.S. Library of Congress. 2014. Economy of Nigeria: crops. http://www.countrystudies.us/nigeria/58.htm.
(Accessed May 8 2014)
Central Bank of Nigeria Annual Report. 2012. Real sector
developments. pp 1-30.
http://www.cenbank.org/.../annualreports.asp . (Accessed June 15 2014)
Ohunakin, O. S. 2010. Energy utilization and renewable energy sources in Nigeria. Journal of Engineering and Applied Science. (5): 171–177.
Suleiman, S. 2010. Energy consumption and economic growth: causality relationship for Nigeria. OPEC Energy Review., 34(1): 15–24.
Nigeria–Economy. 2005.
http://www.mogabay.com/reference/country_studies/n igeria/Economy/.htlm
Central bank of Nigeria (CBN). 2012. Statistical bulletin, 1(4), http://www.cenbank.org/document/statbulletin. (Accessed 04 June 2014)
Central Bank of Nigeria (CBN). 2011. Annual report and
http://www.cenbank.org/out/2012/publications/report/r sd/arp/2011. (Accessed 05 Feb. 2014)
National Bureau of Statistics (NBS). 2011. Annual abstract of statistic http://www.nigerianstat.gov.ng/. (Accessed 05 Feb, 2013)
Inter-reseaux (Development rural) bulletin. 2014. Staple crop production and consumption: Nigeria on the way to
food self-sufficiency.
www.inter-reseaux.org/revue--grain-de-sel/51-special -issue-nigeria/article/staple-crop-production. (Accessed June 6 2014)
BICO reports 2012, Nigeria’s Wheat Millers Association & Master Bakers’ Association, Federal Ministry of Agriculture, Nigerian Customs Service
Ajayi, O. O., and K. O. Ajanaku. 2007. Nigeria’s energy challenge and power development: the way forward. Bulletine of ScienceAssociation of Nigeria. 28: 1-3. Kalu, U., and A. Tomasz. 2010. Sustainable energy
development: the key to a stable Nigeria.
Sustainability, (2): 1558-1570.
Badmus, M. A., O. S. Ariyo. 2011. Forecasting cultivated areas and production of maize in Nigerian using ARIMA Model. Asian Journal of Agricultural Sciences, 3(3): 171-176.
Lyddon C. 2011. World grain.com news update, focus on Nigeria.
http://www.world-grain.com/department/country. (Downloaded May 8 2014)
World- grain.com news update. 2013. Nigeria’s wheat
dilemma. http://
www.world-grain.com/new/news%20home/features/2 013/12/Nigeria%20wheat%20dilema.aspx
FAO Country report. 2008. Country Report on the state of plant genetic resources for food and agriculture in Nigeria (1996-2008). A Country Report, National Centre for Genetic Resource and Biotechnology Ibadan/Federal ministry of agriculture. http://.www.fao.org/docrep/013/.../nigeria.pdf. (Accessed June 6 2014)
Fafchamps, M. E., M. Gabre, and B. Minten. 2003. Increasing returns and efficiency in agricultural trade. Markets, Washington D.C., International Food Policy Research Institute, Trade and Institutions in Kassim, A. A. (2011). Economics of Marketing of Food Grains in South Western Nigeria. economía mexicana nueva época, vol. XXI, núm. 2, segundo semestre de 2012 . PP. 373-390
Simons E.B. 1976. Samaru miscellaneous paper 5
Reference book. 2006. Central Bank of Nigeria statistical bulletin,16, December: domestic production , consumptions and prices
USDA Foreign agricultural services. 2011. GAIN Report Number NI11015. Nigeria Grain and Feed Annual USAID. 2009. attachment iv; to the global food security
response west Africa rice value chain analysis: global food security response Nigeria rice study. .” http://www.gain.fas.usda.gov. (Downloaded June 15 2014)
Nigeria Federal Ministry of Agriculture and Water Resources. “Agricultural Production Survey.”2008
Walkenhorst P. (2007). “Distortions to Agricultural Incentives in Nigeria.” Agricultural Distortions Working Paper 37, Munich Personal RePEc Archive 1-26. http://mpra.ub.uni-muenchen.de/10055/. (downloaded June 15 2014)
FAO. FAOSTAT 2009 a Commodity Balances Database. Rome: http://faostat3.fao.org/home/index.html#DOWNLOA D.
FAO. FAOSTAT 2009 b Population Database. Rome: http://faostat3.fao.org/home/index.html#DOWNLOA D.
Ezedimma. C. 2005. Impact of trade on domestic rice production and the challenges of self sufficiency in Nigeria. Paper presented at a rice policy and food security in sub – Saharan Africa Cotonou, Benin Kassim, A. A. 2011. Economics of marketing of food grains
in south western Nigeria. economía mexicana nueva época, vol. XXI, núm. 2, segundo semestre de 2012 . PP. 373-390
USDA. 2013. Nigeria – Grain and feed update’, GAIN Report, 24 October 2013. USDA, ‘Nigeria – Grain and feed update: Nigeria remains a strong growth market for wheat’, GAIN Report, 24 October 2013
Imolehin, E. D., and A. C. Wada. 2000. Meeting the rice production and consumption demands of Nigeria with improved technologies. International Rice Commission Newsletter, Vol. 49, FAO, Rome, pp. 23-41.
Central bank of Nigeria report. 2013. Nigeria’s top 4 food imports ; Annual food imports in Federal Ministry of Agriculture and Rural Development report on Nigeria’s Agricultural Transformation Agenda (ATA), 2014.
September, 2015 Nigeria’s grain resource structure and government sustainable policy: a review Vol. 17, No. 3 457 Oyedepo, S. O. 2012. Energy and sustainable development in
Nigeria: the way forward. Energy, Sustainability and Society., 2(15): 2-17.
Nigeria’s Flour Milling Industry (An Analyst’s Perspective). 2008. Lead capital limited industrial report. http: // www.proshareng/…./download.php
Agritrade news analysis. Informed Analysis, Expert Opinions. West Africa, Cereals.http://agritrade.cta.int/
CIA World Fact book, Nigeria. 2012. https://www.cia.gov/library/publications/the-world-fac tbook/geos/ni.html. (Accessed 25 June 2014) FAO. 2011. Global food losses and food waste—extent,
causes and prevention. Rome: UN FAO in Lipinski et al.(2013) Reducing Food Loss and Waste: Working Paper ; Installment 2 of “Creating a Sustainable Food Future. World Resources Institute
Lipinski. B., C. Hanson, J. Lomax, L. Kitinoja, R. Waite, and T. Searchinger. 2013. Reducing food loss and waste: Working Paper ; Installment 2 of “Creating a Sustainable Food Future. World Resources Institute
Washington DC
http://www.wri.org/.../reducing-food-losses-and-... (Accessed on 10th June 2014)
Lyddon, C. 2011. World grain.com news update, focus on Nigeria.
http://www.world-grain.com/department/country. (Downloaded May 8 2014)
The partnership for child development (PCD).Summary of PCD’s Strategic Grain Reserve programme. http:// www.hgsf-global.org/.../302-summary-of-pcd.... (downloaded June 3 2014)
Asoegwu. S., and A. Asoegwu. 2007. An Overview of Agricultural Mechanization and Its Environmental Management in Nigeria. Agricultural Engineering
International: the CIGR Ejournal, Invited Overview No. 6., Vol. IX. May, 2007 pp 1- 22
IFPRI. 2008. Accelerating Africa’s food production in response to rising food prices: impacts and requisite actions. www.ifpri.org. (downloaded June 2014) Federal ministry of Agriculture and Rural Development
(FMARD). 2014. News update.Strategic Grains Reserve.
USDA. 2014. Foreign agricultural service GAIN report “Nigeria Grain and Feed Rice Update” http://www.gain.fas.usda.gov. (Accessed Jun 15 2014) Borokini, T. I. 2013. The state of ex-situ conservation in
Nigeria. International journal of conservation science, 4(2): 197-212
Anonymous. 2014. Rice transformation project proposal for Nigeria. www.unaab.edu.ng. (Accessed June 10 2014) Abam., F., B. I. Nwankwojike, O.S. Ohunakin, and S. A. Ojomu.
2014. Energy resource structure and on-going sustainable Development policy in Nigeria: a review.
International Journal of Energy and Environmental Engineering. 10.1007/s40095-014-0102-8
Chel, A., and G. Kaushik. 2011. Renewable energy for sustainable agriculture. Agronomy for Sustainainable development., (31):91-118.
World- grain.com news update. 2013. Nigeria’s wheat
dilemma. http://
www.world-grain.com/new/news%20home/features/2 013/12/Nigeria%20wheat%20dilema.aspx