Effect of two drying processes about soybean seed quality
Daniela Laoretani
1*, Maria Cristina Gely
2, Susana Nolasco
2,3 (1. Instituto de Desarrollo y Diseño INGAR - CONICET - UTN, Avellaneda 3757, 3000, Santa Fe, Argentina; 2. TECSE - Facultad de Ingeniería - UNCPBA, Avenida Del Valle 5737, Olavarría, 7400 Buenos Aires, Argentina;3. Comisión de Investigaciones Científicas de la Provincia de Buenos Aires –CIC- Argentina)
Abstract: This work studies the effects of two drying processes on quality soybean seed. This study compares simultaneously the effects of two drying processes: the dry-aeration process and conventional drying process. Two drying temperatures (60°C and 80°C) and two tempering times (30 and 120 min) were investigated. The seed quality variables analyses were: tegument break and germinating power. Results show that both drying processes were negative effect on quality seed but dry-aeration process cause less damage. The dry-aeration process with lower temperature and higher tempering time caused less damage than conventional drying process about germinating power and tegument integrity of the soybean seed. In dry-aeration process, the highest tempering time (120 min.) shows a positive effect on soybean seed quality. For temperature analysis, the most relevant damage occurred at the highest temperature.
Keywords: dry-aeration, conventional drying, drying temperature, tempering time, soybean seed
Citation: Laoretani D., M. C. Gely, and S. Nolasco. 2017. Effect of two drying processes about soybean seed quality. Agricultural Engineering International: CIGR Journal, 19(4): 124–132.
1 Introduction
Soybean oil production has gained great importance
in Argentina and in the world for its high nutritional value.
Because of this, the production of soybean seed gained
great interest in covering large areas of land. The early
harvest technique of seed makes seeds retain higher
moisture and, thus, they should be dried through artificial
drying. Moisture content for safe storage that could
assure good quality is 10%-12% wet basis (w.b.) (Yang et
al., 2015), while soybean seeds are harvested with a
moisture content that ranges between 18%-16% (w.b.) or
more. The moisture reduction by artificial drying is the
preservation technique used more efficiently to prevent
and / or minimize grain damage during storage
(ASHRAE Handbook, 1997). It is a process of mass and
heat transfer where heat vaporizes the water in the grain
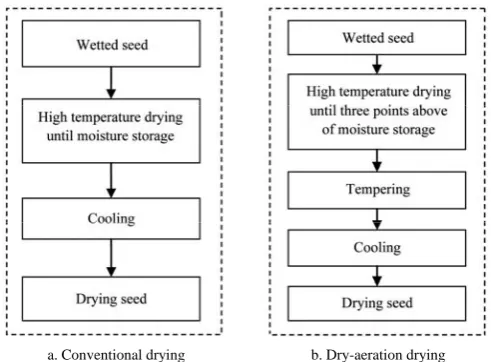
removing it with the drying air (Gely, 2002). In this work
were analyzed two drying process of seed showed in
Received date: 2016-12-12 Accepted date: 2017-04-17
∗ Corresponding author: Daniela Laoretani. Email: [email protected].
Figure 1. The conventional drying processes for drying
soybeans include a stage with high temperature air until
the desired moisture content is reached, followed by
second stage immediate cooling “in situ” with air at
ambient temperature (Figure 1a). One disadvantage of
this drying process is that the change in temperature
during drying (hot-cold) damages product quality.
Non-conventional drying process is the dry-aeration
process. This is an alternative process to avoid damaging
the seeds. The dry-aeration process involves an
intermediate storage stage between high temperatures and
cooling (Figure 1b.). This intermediate stage is called
tempering and this is very important for homogenization
of moisture inside seeds, as there is moisture diffusion
from the interior to the external surface of the seed, this
made easy eliminate the last point moisture. This stage
has two objectives: reducing costs of drying process and
keeping seed quality (Iguaz et al., 2006).
The soybean seed doesn’t have practically endosperm.
It consists of a seed coat or integument and a very large
embryo. This consists of two cotyledons and embryo axis.
Because of grain morphology, mechanical damage that
postharvest can determine the future inability to
germinate (Casini, 2007). El-Abady (2014) studied the
effect of temperature drying on high quality maize seed.
This work analyzes the effect of drying in fast green test,
standard germination, abnormal seedlings, speed of
germination, cold test, electrical conductivity, shoot
length, root length and seedling dry weight. The obtained
results show the negative effect of high temperature
drying on the seed. Dong et al. (2010) studied the effect
of drying time and tempering time on fissuring the two
variety rice. Their results show that shorter time drying
and higher tempering time reduced the rice fissuring.
Also, Iguaz et al. (2006) analyzed different drying
processes on quality rice displayed that use of tempering
time minimizes damage of grain. Devilla et al. (1999), in
their study, displayed that dry-aeration process reduces
the susceptibility of corn to damage.
a. Conventional drying b. Dry-aeration drying
Figure 1 Comparison of two drying processes
The objective of this study was to analyze the effects
of dry-aeration process on the quality of soybean grain
specifically on the break tegument and germinating
power. Also it intends to compare these effects with the
effects caused by conventional drying. This paper seeks
to preserve the quality of soybeans seed once separated
from the plant, achieving maximization of Argentina’s
agroindustrial productivity.
2 Experimental Section
2.1 Preparation and characterization of the sample
Soybean seeds (360 GR variety) from a 150 kg bag
were conditioned and characterized. These seeds were
harvested in summer 2006/2007, in the area of Olavarría,
Argentina. Soybean seed had no drying treatment. The
characterization analyses were: initial moisture of seeds,
break tegument and germination power.
Initial moisture of seeds was determined by AOAC
14.003 (AOAC, 1990). This was analyzed by triplicate. In
this analysis, a vacuum oven (40 cm Hg) was used at
110ºC until constant weight was reached, which was
attained after about 8 h. Then, the seeds were wetted for
analysis of the drying process.
Wetted soybean seed sample
Water was added to the soybean seeds to reach the
moisture of 27% (w/w) (d.b.). Afterwards, seeds were
stored for 48 h in closed containers at 8°C to homogenize
the moisture inside the sample seeds. Wetting of the
sample was performed in duplicate. The final moisture
was analyzed according to method (AOCS Ba – 2b – 82)
(AOAC, 1990).
Break tegument
The break tegument was determined by putting 10
seeds in a sodium hypochlorite solution 1% (w v-1) for
10 minutes. Then, the swollen and translucent white seed
were counted, value corresponding to the number of seed
which break tegument (Gutormson, 1992). The ten
repetitions were performed.
Germinating power
The germination seed power was determined
following ISTAS 5.2.2 (2003) method. In order to
standardize the internal conditions of the germination
camera, the size of the sample was modified to 50 seeds.
The analysis was performed on 4 replications at 25°C for
7 days. The substrate used was sand previously sterilized
(8 h at 150°C in a forced circulation oven) and wet with
distilled water. The count of seedlings was performed at
5 days and then at 7 days.
2.2 Dry-aeration process
2.2.1 Dry-aeration equipment
The equipment utilized in this study belongs to the
Department of Chemical Engineering of UNICEN
(Universidad Nacional del Centro de la Provincia de
Buenos Aires) with headquarters in Olavarría, which has
a data acquisition system for temperature to allow
tracking the temperature of the air passing through the
changing the temperature and flow of drying air. The
equipment contains four trays, of equal size, 16 cm wide,
16 cm long, and 0.5 cm high, whereby it was possible to
monitor the moisture content of seed in a thin layer of
seeds (individually dried). It also contains four drawers,
whose sizes are 5 cm high, 16 cm wide, and 16 cm long,
corresponding to each of the trays, as shown in Figure 2.
Each tray has a standard-type heat-resistance PT100
sensor, built for converting the heat resistance signal into
a standard 420 mA signal for which the transducer is
allocated. They were calibrated by manufacturer for a
range from 0°C to 200°C.
Figure 2 Dry-aeration equipment employed in the studied processes
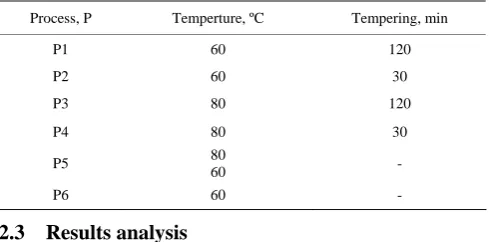
2.2.2 Experimental drying processes
In this study, four dry-aeration processes and two
conventional drying processes were analyzed. Here, were
evaluated two drying temperatures and two tempering
times. Temperatures and tempering times were those used
in the industrial practice. The drying temperature
analyzed were 60ºC and 80ºC and the tempering time
were 30 and 120 minute. Table 1 shows the analyzed
dry-aeration processes (P1 to P4). Samples of 100 g were
placed on the equipment trays, and 1300 g samples were
arranged in each drawer. The air flow enters the seeds
mass perpendicularly from the first to the last tray (from
top to bottom), with 0.088 m s-1 ± 0.016 average air speed,
during all tested drying processes. The drying time of
grains was determined by the decrease in weight of the
samples contained in each tray. This samples were
weighed at one-minute time intervals; moisture content
on the dry basis (d.b.) of the four trays was calculated by
weight difference, the all heat drying process being
finished when the average moisture reached 19% (w w-1)
moisture (d.b.) (2.5 points on wet basis moisture above
the base marketing or safety storage). Immediately after
that, the tempering process is started. Once tempering
time for each dry-aeration process is finished, aeration is
started to reach the required moisture for soybean
marketing (15.6%, d.b.). During the aeration, air flow rate
similar to the one implemented during the heat drying
step (0.088 m s-1) was used. In duplicate sample
processing times equally conditions were respected.
Also, conventional drying process were performed at
each tested temperature, 60ºC and 80ºC (P5 and P6 in
Table 1). This process involves drying with hot air until
reaching the marketing moisture of seeds, followed by
aeration with air at room temperature to cool seeds. The
seeds were weighed each one-minute interval, and average
moisture (d.b.) was computed until marketing moisture
was reached.
Table 1 Descriptions of the analyzed drying processes
Process, P Temperture, ºC Tempering, min
P1 60 120
P2 60 30
P3 80 120
P4 80 30
P5 80
60 -
P6 60 -
2.3 Results analysis
Statistical analysis of the obtained data was
performed using ANOVA (analysis of variance) with
SYSTAT software for Windows (Wilkinson, 1990). Also,
Tukey technique (α=0.05) was implemented to verify the
mean difference between the sample without drying
treatment and the dried samples by each of the proposed
drying systems.
3 Results and Discussion
3.1 Characterization of soybean seeds
Table 2 displays the results obtained in the
characterization of soybean seeds for initial soybean and
wetted soybean seeds. These soybean seed samples
showed a low break tegument, less than 42% reported in
the literature. This indicates a proper postharvest handling
of seed, as also a high germination power (Colombo et al.
2006). For wetted soybeans, the increase in moisture
consistent with a study by Bauer et al. (2003). The
tegument break was similar for both samples of soybean.
Hereinafter the soybean sample which it is dried by
the processes in analysis is the wetted soybean.
Table 2 Results of characterization analysis of soybean seeds
Physical characteristics of initial soybean seeds
Analysis Result Bibliographic value Apparent density 0.68 ± 0.70 g mL-1 0.732 g ml-1 (Kachru, 1994)
Real density 1.22 ± 0.01 g mL 1.19 g mL-1 (Kachru, 1994) Porosity 44.2% 38.8% (Kachru, 1994) Equivalent diameter 6.56 mm 5.13 mm (Kachru, 1994)
Analysis Result Initial soybean seeds
Moisture (% w.b.) 10.9 ± 0.28 Moisture (% d.b.) 12.3 ± 0.36 Break tegument (%) 11 ± 2 Germinating power (%) 90 ± 6
Wetted soybean seeds
Moisture (% w.b.) 21.4 ± 0.58 Moisture (% d.b.) 27.2 ± 0.37 Break tegument (%) 10 ± 2 Germinating power (%) 74 ± 4
3.2 Results of Drying processes
Table 3 shows the times of each stage for each drying
process. The highest drying times with hot air were
obtained for P 5 and P 6 processes, by convetional drying
and this occurs because it is necessary to reduce moisture
to a safe storage level with hot air. The conventional
drying doesn’t have tempering. For dry-aeration
processes, at the end of the tempering time, air at room
temperature was applied to achieve safe moisture storage
and cool the seed. These results are influenced by relative
humidity of the specific day of drying process. Appendix
A shows the humidity conditions for each experimented
treatments, where the highest daily relative humidity was
observed in process 2.
Table 3 Drying and aeration times in all experiment treatments
Process Drying time with hot air, min Aeration time, min
P1 41 26
P2 76 162
P3 44 93
P4 40 84.2
P5 77.5 40
P6 126.4 30
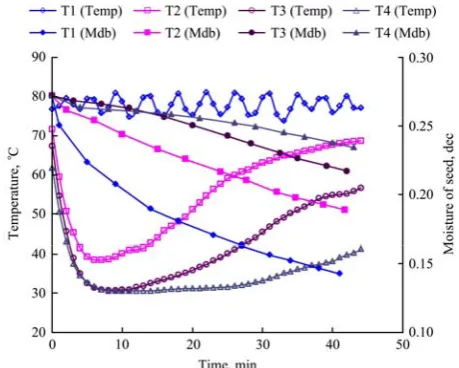
Figure 3 shows the effects of the temperature and on
the seed moisture content as a function of processing time
for each tray of the equipment in Process 3 (80ºC and
120 min. tempering time). This gives an idea of the
behavior of the drying equipment. The seed’s moisture
decreases acording to processing time. Its reduction was
bigger in tray 1 because tray 1 was in direct contact with
the hot air entering the equipment. Tray 4 had a smaller
moisture reduction because it was further away from the
hot air source. A similar behavior was that of the
temperature. Tray 1 presented the highest temperature and
tray 4 the lowest. The final results are the average results
of each of the four trays.
Figure 3 Temperature performance (Temp) and moisture dry base (Mdb) of the seeds for each tray (T) of the equipment in Process 3 (80ºC and 120 min. tempering time) as a funtion of time processing
with hot air
3.2.1 Tegument’s Break Results
Figure 4 shows the results obtained for tegument
breaking analysis of soybean drying in each processes
analyzed (P1 to P6) with wetted soybean (WS). The
results displayed a strong temperature drying effect on the
tegument break in P4 and P5, which had the highest
percentages of tegument breaking. Also, the results show
a positive effect of tempering time for equal drying
temperature (P1, P2 and P6). The highest tempering time
(120 min. in P1) caused less damage that less tempering
time (30 min. in P2), as well as conventional drying, with
no tempering time (P6). Preserve the integrity of the
tegument is very important to maintain quality of the seed
for long time. In this study case, the process that less
damages causes in the tegument was P1, by dry-aeration
process at lower temperature and higher tempering time.
The tempering time has a positive effect on the
preservation of seed integrity (Aquerreta et al., 2007).
differences between wetted soybean and drying processes
analyzed (p<0.001) (see Table 1B in Appendix B). This
was corroborated by analysis of mean differences (Tukey
α=0.05), confirming the differences between the samples
analyzed (as shown in Figure 4 by different letters).
Figure 4 Results obtained for tegument break of soybeand seeds. Different letters indicate significant differences (Tukey’s test, α=0.05)
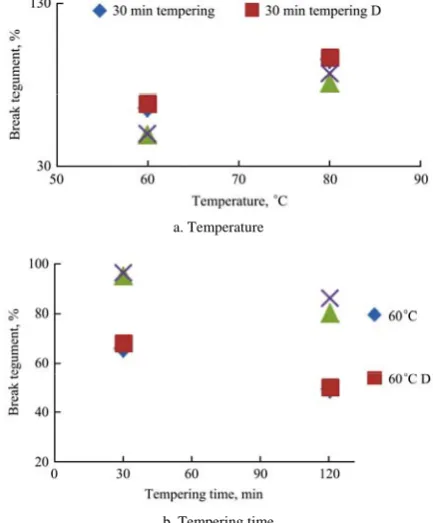
3.2.2 Tegument’s Break Results for Dry-aeration processes
In this work, all dry-aeration processes studied
affected the tegument break. Figure 5 shows the effects of
temperature (Figure 5a) and tempering time (Figure 5b)
on tegument breaking. This figure displayed that higher
drying temperature has a negative effect on tegument
break at both tempering times (Figure 5a). An increase of
tempering time of 90 min. decreases the damage of
tegument break; at 60ºC, decreases the damages in 26%
and at 80ºC, the damage is reduced by 13% (Figure 5b).
The ANOVA statistical analysis found significant
differences considering the variables temperature and
tempering time (p<0.001) (see Table 2B in Appendix B).
There is no significant interaction between the two
variables (p>0.198).
3.2.3 Results of the comparison between dry-aeration
and conventional drying processes in Tegument Break
Figure 6 analyses the two dry-aeration processes for
each tempering time implemented. The highest tempering
time has a positive effect on tegument break (Figure 6b)
for both temperatures drying compared to convention
drying. For 30 min. tempering and temperature of 60ºC
damage is less compared with conventional drying; but at
80ºC, damage was similar for both drying processes
(Figure 6a). The ANOVA statistical analysis revealed
significant differences between the analyzed temperatures
(p<0.001). There are significant differences between
drying processes (see Table 3B and 4B in Appendix B)
and there is significant interaction between the two
variables (p<0.001).
a. Temperature
b. Tempering time
Figure 5 Effects of temperature and tempering time in dry-aeration process in soybean seeds. D indicates duplicate.
a. Dry-aeration
b. Conventional drying
3.2.4 Results of the Germinating power
Figure 7 shows the results obtained for germinating
power in wetted soybean for each of the drying processes
analyzed. The results obtained displayed a strong
negative effect of conventional drying processes
(convective drying) and dry-aeration processes to higher
temperature (P3 and P4). Between two drying processes,
conventional processes have a major negative effect on
germinating power. The ANOVA statistical analysis
revealed significant differences between wetted soybean
and drying processes in relation to germinating power (p<
0.001) (see Table 5B in Appendix B). This was
corroborated by the analysis of mean differences (Tukey
α=0.05) where the differences between the samples
analyzed are shown in Figure 7 with different letters.
There are no differences between WS (wetted soybean)
and P1, as there are no significant differences between P3,
P4 and P6.
Figure 7 Results obtained for the germinatin power concerning each drying process analyzed and wetted soybean (ws). Different letters indicate significant differences (Tukey’s test, α=0.05).
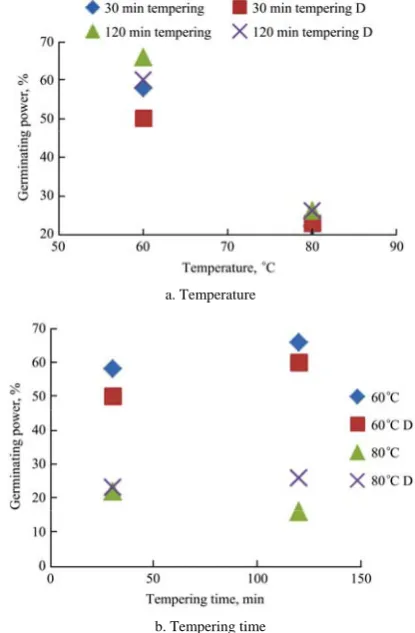
3.3 Germinating power results for Dry-aeration
processes
Figure 8 shows the effects of drying temperature (8a)
and tempering time (8b) for dry-aeration processes. It is
displayed that at higher temperatures drying decreases the
germination for both tempering times; for 120 min.
tempering, the reduction was 66.7% and for 33 min.
tempering, the reduction was 58.3% (Figure 8a). In
Figure 8b it can be seen that an increase in tempering
time of 30 to 120 min., at 60°C, results in an increase in
the germination power (14.3%) while at the highest
temperature, 80°C, the opposite effect occurs, with a
reduction of 6.7%. These results were corroborated by
ANOVA statistical analysis where significant differences
between temperatures studied were found (p<0.001) (see
Table 6B in Appendix B). There are no significant
differences between tempering times (p>0.780) as there
are no interactions between both variables (p>0.213).
a. Temperature
b. Tempering time
Figure 8 Effect of temperature and tempering time in dry-aeration processes on germinating power of soybean seed
Results of the comparison between Dry-aeration and
conventional drying processes in germinating power
Figure 9 shows results obtained comparing the two
drying processes: conventional drying and dry-aeration
with 30 min tempering (Figure 9a) and conventional
drying and dry-aeration with 120 min. tempering (Figure
9b). For both temperatures and both tempering times, the
conventional drying generated highest damage. These
results were analyzed by ANOVA statistical analysis,
revealing significant differences between the analyzed
temperatures (p<0.001), as well as significant differences
between drying processes (p<0.001). There were no
interaction between both factors (P>0.064) (see Table 7A
and 8A in Appendix B).
Figure 10 shows the result obtained in germinating
power analysis for process P5 (conventional drying at
days of incubation. The P5 process was the one that
generated the greatest decrease of germinating power.
a. Dry-aeration
b. Conventional drying
Figure 9 Effects of Dry-aeration and conventional drying processes in germinating power.
Figure 10 Result of germinating power in conventional drying at high temperature (P5)
4 Conclusion
In this work were analyzed two drying processes
about soybean seed quality. The quality variables
analyzed were breaking tegument and germinating power
and processes analyzed were dry-aeration and
conventional drying. In the dry-aeration processes were
analyzed two drying temperatures and two tempering
times. Furthermore they were analyzed conventional
drying processes at each drying temperatures.
The results obtained for tegument break analysis
displayed that the conventional drying processes caused
more damage. While that dry-aeration process at higher
temperature and less tempering time had a similar effect.
This shows a marked and strong temperature effect on the
integrity of the tegument. The implement of tempering
times in dry-aeration processes has the objective to avoid
this kind of damage in the seeds. For dry-aeration
processes, the process with lower temperature (60°C) and
higher tempering time (120 min) caused less damage in
tegument seeds.
For germinating power, the results showed that the
higher the drying temperature the lower the seed
germination for both drying processes. All processes had
a negative effect on this analysis. As in the previous
variable, the process with lower temperature (60°C) and
higher tempering time (120 min) had the highest
germination effect. For this drying process, lower
temperature had a marked positive effect of tempering
time. The higher tempering time did not show positive
effects about germination power for the higher drying
temperature (process P3).
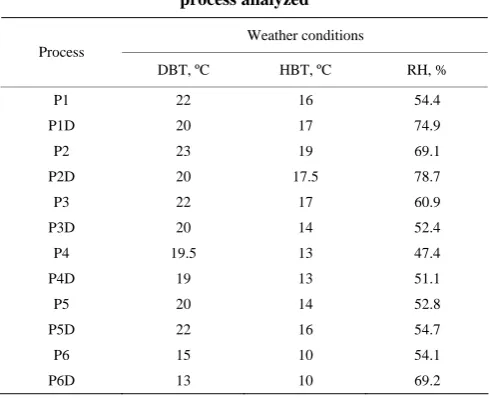
Appendix A
Table 1A shows the weather conditions for each day
of dry processing.
Table 1A Dry bulb temperature (DBT), Humid bulb temperature (HBT), Relative humidity (RH) for each day of
process analyzed
Weather conditions Process
DBT, ºC HBT, ºC RH, %
P1 22 16 54.4 P1D 20 17 74.9
P2 23 19 69.1 P2D 20 17.5 78.7
P3 22 17 60.9 P3D 20 14 52.4
P4 19.5 13 47.4 P4D 19 13 51.1 P5 20 14 52.8 P5D 22 16 54.7
P6 15 10 54.1 P6D 13 10 69.2
Appendix B
Tables 1B to 4B shows the results obtained by
ANOVA analysis for tegument break, considering all the
drying processes and wetted sample soybean seeds and
their interactions: processes – temperature and processes
– tempering time.
Table 1B Results obtained by ANOVA analysis for drying processes and wetted sample soybean seeds
Source of variation Sum of square DF Mean sum of square F-value Processes 12365.857 6 2060.976 641.193
Error 22.500 7 3.214
Table 2B Results obtained by ANOVA analysis for dry-aeration processes and wetted sample soybean seeds
Source of variation Sum of square DF Mean sum of square F-value Temperature 1922.0 1 1922.0 366.095 Tempering 450.0 1 450.0 85.714 Temperature-tempering 12.5 1 12.5 2.381
Error 21.0 4 5.22
Table 3B Results obtained by ANOVA analysis between dry-aeration processes and conventional drying for 30 min of
tempering
Source of variation Sum of square DF Mean sum of square F-value Process 435.125 1 435.125 497.286 Temperature 435.125 1 435.125 497.286 Process-Temperature 378.125 1 378.125 432.143 Error 3.5 4 0.875
Table 4B Results obtained of ANOVA analysis between dry-aeration processes and conventional drying for 120 min of
tempering.
Source of variation Sum of square DF Mean sum of square F-value Process 1770.125 1 1770.125 363.103 Temperature 595.125 1 595.125 122.077 Process-Temperature 528.125 1 528.125 108.333 Error 19.5 4 4.875
Tables 5B to 8B shows the results obtained by
ANOVA analysis for germinating power considering all
the drying processes and wetted sample soybean seeds
and their interation: processes – temperature and
processes – tempering time.
Table 5B Results obtained by ANOVA analysis for drying processes and wetted sample soybean seeds concerning
germinating power
Source of variation Sum of square DF Mean sum of square F-value Processes 8296 6 1382.667 57.783
Error 167.5 7 23.929
Table 6B Results obtained by ANOVA analysis for dry-aeration processes and wetted sample soybean seed
concerning germinating power
Source of variation Sum of square DF Mean sum of square F-value Temperature 1764 1 1764 70.209
Tempering 2.25 1 2.25 0.09 Temperature-tempering 55.125 1 55.125 2.194
Error 100.5 4 25.125
Table 7B Results obtained by ANOVA analysis between dry-aeration processes and conventional drying for 30 min of
tempering concerning germinating power
Source of variation Sum of square DF Mean sum of square F-value Process 1596.125 1 1596.125 48.923 Temperature 2016.125 1 2016.125 61.797 Process-Temperature 210.25 1 210.25 6.441
Error 130.5 4 32.625
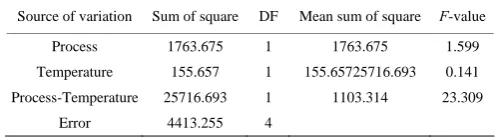
Table 8B Results obtained by ANOVA analysis between dry-aeration processes and conventional drying for 120 min of
tempering concerning germinating power
Source of variation Sum of square DF Mean sum of square F-value Process 1763.675 1 1763.675 1.599 Temperature 155.657 1 155.65725716.693 0.141 Process-Temperature 25716.693 1 1103.314 23.309
Error 4413.255 4
Acknowledgments
The authors acknowledge financial support from
CONICET (Consejo Nacional de Investigaciones
Científicas y Técnicas) and Universidad Nacional del
Centro de la Provincia de Buenos Aires, Argentina. The
authors are grateful for the collaboration and / or advice
of Doctors Sergio Giner and Carmen Mateo for the
development of the work.
Conflicts of Interest: The authors declare no conflict
of interest.
References
Aquerreta, J., A. Iguaz, C. Arroqui, P. Vı´rseda. 2007. Effect of high temperature intermittent drying and tempering on rough rice quality. Journal of Food Engineering, 80(2): 611–618. ASHRAE Handbook. 1997. Fundamentals. American Societies of
Heatin, Refrigerating and Air-Conditioning Engineers, New York: ASHRAE, Inc.
Association of Official Analytical Chemists. 1990. Official Methods of Analysis, 15th ed. Washington, DC: Association of Official Analytical Chemists.
2003. Germinación y vigor de la semilla de soja del grupo de maduración III cosechada bajo diferentes condiciones. Revista Brasileira de Sementes, 25(2): 53–62.
Casini, C. 2007. Los granos son los actores principales en el almacenamiento y muchas veces no se los toma en consideración. Proyecto Precop (Eficiencia de Cosecha y Postcosecha). Available at: www.cosechaypostcosecha.org. Accessed 17 october 2016.
Colombo, D., M. C. Gely, M. Cocconi, R. Cravioto, M. S. Nolasco, S. A. Giner. 2006. Efecto del secado sobre los parámetros de calidad del grano de soja. Congreso Internacional de Ciencia y Tecnología de los Alimentos. Argentina. Libro de Actas 1: 135–136.
Devilla, I. A., S. M. Couto, D. M. De Queiroz, D. G. de Souza, and R. F. Pinheiro. 1999. Qualidade de gra~os de milho submetidos ao processo de saca-aeracao. Revista Brasileira de Engenharia Agrícola e Ambiental, 3(2): 211–215.
Dong, R., Z. Lu, Z. Liu, S. Koide, and W. Cao. 2010. Effect of drying and tempering on rice fissuring analysed by integrating intra-kernel moisture distribution. Journal of Food Engineering, 97(2): 161–167.
El-Abady, M. I. 2014. Viability of stored maize seed exposed to different periods of high temperature during the artificial drying. Research Journal of Seed Science, 7(3): 75–86. Gely, M. C. 2002. Factibilidad técnico – económica de la
seca–aireación de soja en plantas de acopio. M. S. Thesis. Olavarria: Univ. of the center of the province of Buenos Aires Gutormson, T. J. 1992. Hypochlorite soak test for soybeans. Ext.
Pub. July 1992. Ames, Iowa: Iowa State University.
Iguaz, A., M. Rodrı´guez, P. Vı´rseda. 2006. Influence of handling and processing of rough rice on fissures and head rice yields. Journal of Food Engineering, 77(4): 803–809.
ISTA (International seed testing Association). 2003. Handbook on seedling evaluation, 3rd edition. Zurich, ISTA, 232.
Kachru, R. P., R. K. Gupta, A. Alma. 1994. Physico-Chemical Constituents y Engineering-Properties of food Crops (1ra edition). ed: Scientific Publishers S-A. ISBN: 8172330839 Wilkinson, L. 1990. SYSTAT: The system for statistics. Evanston,
IL: Systat Inc.