3868 DEVELOPMENT AND VALIDATION OF UV SPECTROPHOTOMETRIC METHOD AND RP-HPLC METHOD FOR ESTIMATION OF CANDESARTAN
CILEXITIL IN BULK AND TABLET DOSAGE FORMS
A. Prameela Rani, B. Radha Madhavi*
A.N.U. College of Pharmaceutical Sciences, Acharya Nagarjuna University, Nagarjuna Nagar – 522510, Guntur, A.P.India
*Corresponding author E-mail: [email protected]
ARTICLE INFO ABSTRACT
Key Words
Candesartan, UV-visible spectroscopic
method, HPLC method,
Validation
The main objective of the present work is to develop and validate a simple, novel, specific, accurate, and reliable method for the estimation of candesartan in bulk and pharmaceutical dosage forms using UV-visible spectroscopy and sensitive Reverse Phase High Performance Liquid Chromatographic method. The uv-visible spectrophotometric determination was performed with Elico double beam SL 210 UV-visible spectrophotometer having deuterium lamp at λmax 238 nm using water as a medium. Linearity was noted over a concentration range of 2-10μg/ml with a correlation coefficient of 0.99. HPLC analysis was performed with Agilent 1260 infinity DAD detector using Eclipse XDB C18 column with 5 μm particle size having dimensions 4.6 X 250 mm column, 1260 infinity quaternary pump using Ezchrome software at a flow rate of 1 ml/min and a run time pressure of 2140 psi. The mobile phase used was 0.01m mono basic potassium phosphate buffer: Acetonitrile (40:60) and the effluents were analyzed at 238 nm at a flow rate of 0.7 ml per minute. As per International Conference on Harmonization (ICH) guidelines, both the proposed methods were validated for various parameters like linearity, precision, accuracy, robustness, ruggedness, selectivity, detection, quantification limits and formulation analysis. Linearity for UV and HPLC method was noted over a concentration range of 25-200 μg/ml with a correlation coefficient of 0.99. The retention time was considered to be 6.7 min. The % RSD for interday and intraday precision studies and recovery analysis of both UV and HPLC methods was found to be less than 1% which is less than the official RSD limit (2%). Recovery analysis performed using marketed formulation Candelong was considered to be greater than 99% for both the methods. Validation of both the methods was performed according to the ICH guidelines. Hence it was evident that the proposed methods were novel, sensitive, precise and reliable for estimation of Candesartan in bulk and were successfully applied for estimation of pharmaceutical dosage forms.
INTRODUCTION:
Candesartan is an angiotensin- II receptor blocker (ARB), used to treat hypertension. It competes with angiotensin II binding at the AT1 receptor subtype by blocking the vasoconstrictor
aldosterone-secreting effects(1). Chemically, Candesartan
cilexetil is 2-ethoxy-3-[21-
(1H-tetrazol-5-yl)-4-yl methyl]-3H-
benzoimidazole-4-carboxylic acid 1-cyclohexyloxy carbonyl oxy ethyl ester with a molecular formula of
Journal of Global Trends in Pharmaceutical Sciences
3869
C33 H34 N6 O6 and a molecular weight of 610(2).The chemical structure of the drug was shown in the figure -1.
N
N
N
N N
N H O
O H
O CH3
Fig 1: Chemical Structure of Candesartan Cilexetil.
Candesartan cilexetil gets
metabolized completely by esterases to the active candesartan moiety in the intestinal
wall during absorption. Based on the
detailed review of the literature, there are several reported analytical methods for the estimation of candesartan in biological fluids or pharmaceutical formulations such as stability indicating LC method (3), HPLC
method for simultaneous analysis of
candesartan cilexetil and hydrochlorthiazide
(4,5). HPTLC densitometric method and
Q-absorbance ratio method for analysis of
candesartan cilexetil and
hydrochlorothiazide were developed (6,7). First derivative UV spectroscopic method for determination of candesartan cilexetil and dissolution testing were also prescribed
(8). The literature survey is revealed about its
pharmacological action (9,10). The main
objective of the present work was to develop a simple, accurate, precise and economic UV and RP-HPLC methods to estimate the
candesartan cilexitil in bulk and
pharmaceutical dosage forms.
2. MATERIALS AND METHODS
Chemicals and reagents
The reference sample Candesartan cilexitil was secured from Natco pharma
Ltd. Hyderabad. analytical grade.
Acetonitrile (HPLC grade), Monobasic potassium phosphate and acetic acid Ethanol(HPLC grade) were acquired from Merck specialty's private ltd., Mumbai, India. All the reagents used were of
analytical grade. Commercial tablet
Candelong was procured from the local market.
Instrument specifications
The UV analysis was performed using Elico double beam SL 210 UV visible spectrophotometer having deuterium lamp associated with spectra treats software. The HPLC analysis was performed using Agilent 1260 infinity system (Ezchrome elite software) consisting of DAD VL detector adjusted to a wavelength of 304 nm. The instrument also consisted of Inertsil ODS-3V C-18 (250 x 4.6 mm, 5µm) and a 1260 infinity VL quaternary pump.
Spectrophotometric and chromatographic conditions
Spectrophotometric analysis was performed using triple distilled water as mobile phase. The detection was carried out at an absorption maximum (λmax) of 238
nm. Chromatographic separation was
achieved using mobile phase 0.01m mono
basic potassium phosphate buffer:
AcetonItrile (40:60). A flow rate of 0.7 ml/min was maintained throughout the separation process with a Run time pressure of 600 bars. All the contents of the mobile phase were filtered through a 0.45 mm
membrane filter and degassing was
performed using ROHS sonicator to remove dissolved gasses if any. For each trial, 20 μl samples were injected manually, and a total run time of 10 min was maintained. The eluent was detected at 238 nm. Various systems suitability parameters were assessed as mentioned in table 1.
Preparation of stock solutions and sample solutions
a. UV-Visible method
Preparation of standard solution:
Candesartan cilexetil (100mg) was
3870
Preparation of working solutions:
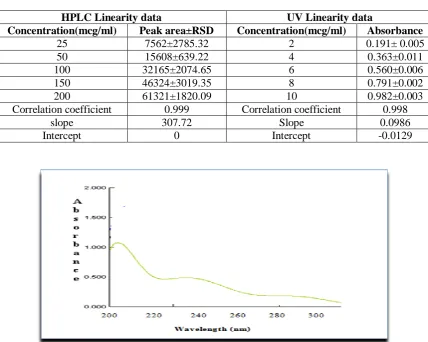
From the standard stock solution aliquots 0.2ml, 0.4ml, 0.6ml, 0.8ml and 1ml were pipetted out into 10ml volumetric flask. The volume was made up with phosphate buffer pH6.8 to get a final concentration of 2 µg/ml, 4 µg/ml,6 µg/ml,8 µg/ml and 10µg/ml respectively. The absorbance of
each concentration was measured at
238nm.The UV-visible spectral scan was shown in figure 2.
b. HPLC METHOD
Standard preparation (200ppm)
Accurately weighed and transferred 20 mg of Candesartan into 100 mL volumetric flask to this add 70 mL of diluents and sonicated for 15 mins. Then made up to the volume with diluents.
Preparation of stock solution (2000ppm)
Accurately weighed and transferred 100 mg of Candesartan into 50 mL volumetric flask to this add 30 mL of diluents and sonicated for 15 mins. Then made up to the volume with diluents and used as a stock solution.
c. Validation of developed methods (11,12)
Linearity and range
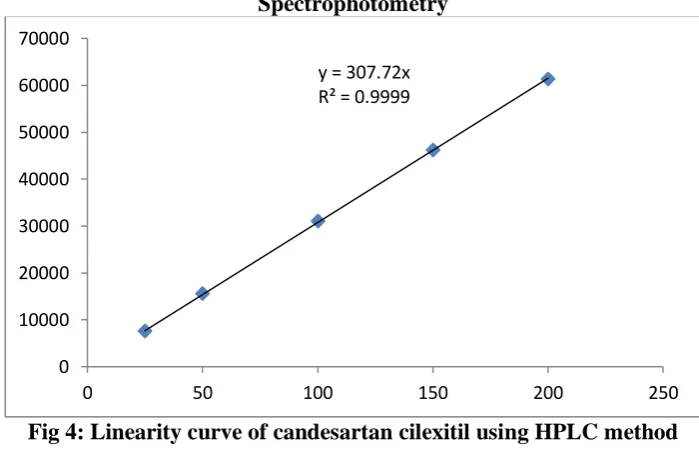
Linearity is defined as the ability to obtain test results, which were directly proportional to the concentration of an analyte in the sample within a given range. Linearity data for the spectrophotometric method was obtained at an absorption maximum of 238 nm as shown in figure 3 by using five concentrations in the range of
2–10μg/ml. A calibration curve was
obtained by plotting absorbance against
concentration by considering five
observations as shown in figure 4. Linearity data for the chromatographic method was obtained by using five concentrations within the range of 25–200 μg/ml. A calibration curve was obtained plotting peak area against concentration by considering five observations as shown in figure. 4. Both the
methods were studied using six replicates of each sample concentrations.
Precision
The degree of closeness of
agreement between a series of measurements obtained from multiple samplings of the same homogeneous sample under the prescribed condition was determined. The intra-day precision was performed by analyzing six replicate standard solutions on the same day, and inter-day precision was performed by analyzing a series of standard solutions for 3 consecutive days using the proposed U V and HPLC methods. The data obtained was presented in table 5.
Robustness
Robustness is defined as the measure of its capacity to remain unaffected by small
but deliberate variation in method
parameters, and it provides an indication of
its reliability during normal range.
Robustness of both the methods was studied using six replicates of the sample at a concentration level of 100μg/ml(for HPLC) and 10 μg/ml (for UV).
Ruggedness
Ruggedness was calculated by considering the same sample at different labs by different analysts.
Detection and quantification limits
Limit of detection (LOD) represents the lowest amount of analyte in the sample
which can be detected. Limit of
quantification (LOQ) represents the lowest
amount of analyte, which can be
quantitatively determined. The above
parameters are calculated based on the standard deviation of the response and the slope. The standard deviation was calculated based upon the calibration curve. LOD = 3.3σ/SLOQ = 10σ/S
Selectivity and specificity
3871
Table 1: System suitability parameters for HPLC
HPLC system Azilent 1260 Infinity
Column Inertsil ODS-3V C-18 (250 x 4.6 mm, 5 µm)
Mobile phase 0.01M mono basic potassium phosphate buffer:
Acetonotrile(40:60) pH 6.0 adjusted with 10% Acetic Acid
Flow rate 0.7 mL/min
Injection volume 20µL
Detection 238 nm
Temperature Ambient
Retention time 6.7 min
Run time 10min
Table 2: Summary of validation parameters obtained for proposed UV and HPLC methods
Validation parameters UV HPLC
Beer’s law limit 2-10 25-200
Correlation coefficient (r2) 0.998 0.999
Regression equation Y=0.0986x-0.0129 Y=307.72x+0.00
slope 0.0986 307.72
intercept -0.0129 0
LOD 1.361119µg/ml 15.34251µg/ml
LOQ 4.124604µg/ml 46.49247µg/ml
Table 3: Linearity data table for proposed HPLC and UV methods (where n=6)
HPLC Linearity data UV Linearity data
Concentration(mcg/ml) Peak area±RSD Concentration(mcg/ml) Absorbance
25 7562±2785.32 2 0.191± 0.005
50 15608±639.22 4 0.363±0.011
100 32165±2074.65 6 0.560±0.006
150 46324±3019.35 8 0.791±0.002
200 61321±1820.09 10 0.982±0.003
Correlation coefficient 0.999 Correlation coefficient 0.998
slope 307.72 Slope 0.0986
Intercept 0 Intercept -0.0129
3872
Fig. 3: Linearity curve of candesartan cilexitil in 6.8 pH phosphate buffer by UV – Visible Spectrophotometry
Fig 4: Linearity curve of candesartan cilexitil using HPLC method
Table 4: Precision analysis data of Candesartan for UV and HPLC
Parameter UV HPLC
Interday(%RSD) 0.021 0.39
Intraday(%RSD) 0.72 0.91
Table 5: Recovery analysis for Candesartan by the proposed UV and HPLC methods
Method Std.
solution
Conc. level
Amount added (μg/ml)
Total amount (μg/ml)
Amount founded (μg/ml)
Amount recovered (μg/ml)
%
Recovery % RSD
UV 10 µg /
ml
50% 5 15 14.97 4.97 99.4 0.054
100% 10 20 19.73 9.81 98.1 0.063
150% 15 25 24.82 14.78 98.53 0.059
HPLC 100 µg /
ml
50% 50 150 149.92 49.92 99.84 0.113
100% 100 200 198.65 98.65 98.65 0.247
150% 150 250 249.74 149.74 99.83 0.123
y = 0.0986x - 0.0129 R² = 0.9982
-0.2 0 0.2 0.4 0.6 0.8 1 1.2
0 2 4 6 8 10 12
ab
so
rb
an
ce
concentration µg/ml
y = 307.72x R² = 0.9999
0 10000 20000 30000 40000 50000 60000 70000
3873
Table 6: Single factor ANOVA for recovery studies performed using UV method
Source of variation ss df MS F cal p-value F tab
Between groups 0.0384 1 0.0384 0.001559 0.970397 7.708647 Within groups 98.5294 4 24.63235
Table 7: Single factor ANOVA for recovery studies performed using HPLC method
Source of variation ss df MS F cal p-value F tab
Between groups 0.476017 1 0.476017 0.000191 0.989642 7.708647 Within groups 9982.944 4 2495.736
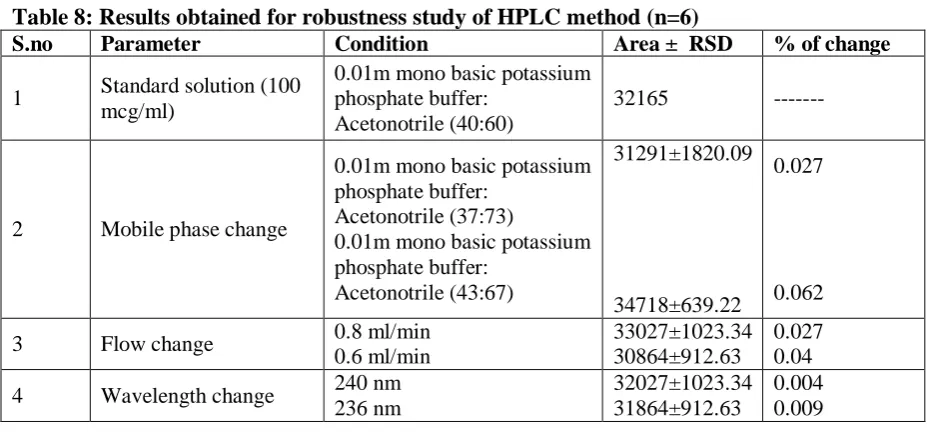
Table 8: Results obtained for robustness study of HPLC method (n=6)
S.no Parameter Condition Area ± RSD % of change
1 Standard solution (100 mcg/ml)
0.01m mono basic potassium phosphate buffer:
Acetonotrile (40:60)
32165 ---
2 Mobile phase change
0.01m mono basic potassium phosphate buffer:
Acetonotrile (37:73)
0.01m mono basic potassium phosphate buffer:
Acetonotrile (43:67)
31291±1820.09
34718±639.22
0.027
0.062
3 Flow change 0.8 ml/min 0.6 ml/min
33027±1023.34 30864±912.63
0.027 0.04
4 Wavelength change 240 nm 236 nm
32027±1023.34 31864±912.63
0.004 0.009
Table 9: Results obtained for robustness study of UV-Visible spectrophotometric method (n=6)
S.No Parameter Condition Absorbance % of change
1 Standard solution (10
µg/ml) phosphate buffer pH6.8 0.982
2 Mobile phase change
phosphate buffer pH6.8: methanol (98:2)
phosphate buffer pH6.8: water (98:2)
0.943±0.011
0.906±0.023
0.04
0.07
3 Wavelength change 240 nm
236 nm
0.979±0.013 0.973±0.009
0.003 0.009
Table 10: Detection and quantification limits of proposed UV and HPLC methods Detection and
Quantification limits UV Method HPLC Method
LOD 1.361119µg/ml 15.34251 µg/ml
3874
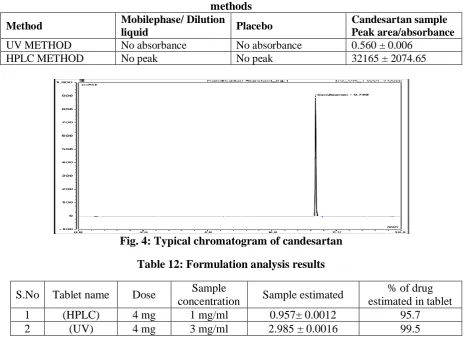
Table 11: Selectivity and specificity of Candesartan samples using proposed UV and HPLC methods
Method Mobilephase/ Dilution
liquid Placebo
Candesartan sample Peak area/absorbance
UV METHOD No absorbance No absorbance 0.560 ± 0.006
HPLC METHOD No peak No peak 32165 ± 2074.65
Fig. 4: Typical chromatogram of candesartan
Table 12: Formulation analysis results
S.No Tablet name Dose Sample
concentration Sample estimated
% of drug estimated in tablet
1 (HPLC) 4 mg 1 mg/ml 0.957± 0.0012 95.7
2 (UV) 4 mg 3 mg/ml 2.985 ± 0.0016 99.5
Estimation of an active ingredient in bulk and in tablet dosage form (Formulation
analysis):
Twenty tablets (Candelong 4 mg) were weighed accurately and crushed into powder form. Accurately weighed the quantity of powder taken and a standard solution of 1000 μg/ml was prepared using the mobile phase and the diluting fluid. Serial dilutions were taken to ensure the standard solution prepared, and the solutions were analyzed spectrophotometrically and chromatographically using the proposed methods.
3. RESULTS AND DISCUSSION
The summary of validation
parameters obtained for proposed UV and
HPLC methods were given in table 2
Linearity and range
The linearity of candesartan employing UV method was constructed by considering concentration (μg/ml) on X–axis and Absorbance on Y– axis. The regression coefficient was considered to be 0.998 over
a concentration range of 2–10 μg/ml. The representative linearity equation was found to be y = 0.0256x+0.0002 as shown in figure 3and data were shown in table 3. The linearity of proposed Candesartan employing
HPLC method was constructed by
considering concentration (μg/ml) on X–axis and peak area on Y-axis. The regression coefficient was considered to be 0.999 over a concentration range of 25–200 μg/ml. The representative linearity equation was found
to be Y=307.72 xs+0.00 as shown in figure
4 and the corresponding data were shown in
table 3. For both the methods the % RSD was found to be within the acceptable theoretical limits of ≤ 2%.
Precision
The % RSD for intra-day precision (six independent series in the same day) and inter-day precision (3 consecutive days)
analysis performed for six different
individual samples of drug solution using the proposed UV and HPLC methods was found
to be 0.021%, 0.72%and 0.39%,
3875
obtained as shown in table 4 were within the
proposed theoretical limits<2% RSD
according to IP, the method was
demonstrated to be precise. Recovery studies
The accuracy of the proposed UV-visible spectroscopic method and HPLC method was established by recovery experiments. The recovery analysis studies
were carried out at three different
concentration ranges (50, 100 and 150%). All studies were carried in triplicate, and the results obtained were presented in table 5. The analyzed samples yielded high recovery values from the proposed methods. % RSD values were found to be less than 0.2% for both UV and HPLC analysis, indicating that the proposed methods were accurate. All the RSD values obtained were less than the theoretical limit of<2% RSD according to IP. F-test results for both the UV and HPLC methods revealed that the F cal value is less than the tabulated value as shown in table 6 & 7, proving that null hypothesis is accepted. Hence it was proved that there is no significant difference between the actual amount added, and the amount recovered. Robustness
The robustness of the proposed HPLC method was checked in terms of variation in mobile phase, flow rate change
and wavelength change. Experimental
findings proved that the change of mobile phase is the most influential factor on repeatability of the proposed HPLC method. Suitable measures have been adopted to maintain similarity in various instrumental
aspects like injection and capillary
conditioning. Since % RSD values for all the
parameters were found to be less than 0.1%
(less than the acceptable theoretical limit of<2% RSD) the proposed HPLC method was found to be robust. The results obtained were presented in table 8. The robustness of the proposed UV method was checked in terms of variation in the mobile phase and
change in wavelength. Experimental
findings proved that change in the mobile phase has a higher influence on repeatability of the proposed UV method compared to change in wavelength. % RSD values for all the parameters were found to be less than
0.02% (less than the acceptable theoretical limit of<2% RSD) which proved that the proposed UV method was found to be robust. The results obtained were presented in table 9.
Ruggedness
Standard solutions of candesartan were analyzed using both the proposed methods for ruggedness, the difference
between labs, analysts or between
instruments. Thus both the methods are proven to have ruggedness.
Detection and quantification limits
The LOD and LOQ for candesartan utilizing the proposed UV method were determined to be 1.36 μg/ml and 4.12μg/ml respectively. The LOD and LOQ for Candesartan using the proposed HPLC method were found to be15.34 μg/ml and
46.49μg/ml respectively. The results
obtained were presented in table 10. Both the methods indicate the accuracy and precision to detect a very low quantity of analyte which is a favorable sign for extending the method to plasma drug analysis.
Specificity
The selectivity and specificity of the proposed methods were tested by studying the effect of various excipients and other additives usually present in the formulations of candesartan. The chromatograms didn’t yield any peaks for mobile phase and placebo when analyzed with the proposed HPLC method. No absorbance was found for
blank/dilution fluid when analyzed
spectrophotometrically using the proposed UV method. The results obtained were
presented in table 11. The well-shaped
peaks and the linearity of the results indicate that the proposed methods are selective and specific. A model chromatogram was illustrated in figure. 4.
Determination of an active ingredient in bulk and in tablet dosage form
(Formulation analysis)
3876
limits specified by I. P. The results obtained were presented in table 12. F-test results for UV and HPLC method revealed that the Fcal value<F tab value proving that null hypothesis is accepted. Hence it was proved that in both the methods, there is no
significant difference between sample
concentration and the sample estimated. The results also assured that both the proposed methods are selective for estimation of formulations.
4. CONCLUSION
A novel, precise, economical,
accessible, reliable and reproducible method for estimation of candesartan in bulk and tablet dosage form using UV and HPLC methods were developed and were validated as per ICH guidelines. The wide range of linearity establishes a further scope of promoting the proposed methods for estimation of candesartan. The RSD values for all the validation parameters were found to be less than 1, indicating that the proposed UV and HPLC methods were trusts worthy. Both the methods have ample scope and application in industry for estimation of Candesartan.
5. ACKNOWLEDGEMENT
The authors are grateful to the
management of ANU college of
pharmaceutical sciences and the
management and principal of Vignan Pharmacy College for providing necessary facilities for the fulfillment of the current work.
REFERENCES
1. Maryadele J O Neil, Patricia E
Heckelman, Cherie B Koch and Kristin J Roman. The Merck index. Merck research laboratories.2006; pp.281.
2. Suresh S, Preparation and evaluation
of mouth dissolving tablets of salbutamol sulfate. Indian J Pharm Sci. 2007; 467–469.
3. Subba Rao DV, Radha Krishnan. A
stability-indicating LC method for
candesartan cilexetil.,
Chromatographia. 66: 2007; 499-507.
4. Quatab (2007). Simple and sensitive
LC-UV method for simultaneous
analysis of hydrochlorothiazide and
candesartan cilexetil in
pharmaceutical formulations, Acta chromatographica.19: 2007; 119-129.
5. Bala muralikrishna K and
Syamasundar B. Development and hydrochlorothiazide in combined
tablet dosage form, Der
PharmaChemica. 2(6): 2010; 231-237.
6. Bipin H Mehta and Sachin B Morge.
HPTLC-Densitometric analysis of
candesartan cilexetil and
hydrochlorothiazide in tablets,
Journal of Planar Chromatography. 21(3):2008; 173-176.
7. Patel J, Analysis spectrophotometric
methods for estimation of
candesartan cilexetil and
hydrochlorothiazide in tablet dosage form, Journal of Chemical and
Pharmaceutical Research. 2(3):
2010; 10-14.
8. Naseem A Charoo, Mohammad B,
Abdalla E and Khalid I Haj.
Determination of candesartan
cilexetil in tablet dosage forms and dissolution testing samples by first derivative UV Spectrophotometric method, Analytical letters. 42(14): 2009; 2232-2243.
9. Akira Matsumori. Efficacy and
safety of oral candesartan cilexetil in
patients with congestive heart
failure, The European Journal of Heart Failure.5: 2003; 669–677.
10.Nagisa Y, The angiotensin IIreceptor
antagonist candesartan cilexetil
(TCV-116) ameliorate retinal
disorders in rats, Diabetologia. 44: 2001; 883-888.
11.Validation of analytical procedures: Text and methodology. International Conference on Harmonization (ICH)
Q2 (R1) guideline. Geneva,
Switzerland; 2005.