Internetworking Indonesia Journal
34
0
0
Full text
(2) Internetworking Indonesia Journal. The Indonesian Journal of ICT and Internet Development ISSN: 1942-9703 Internetworking Indonesia Journal is a semi-annual peer-reviewed electronic journal devoted to the timely study of Information & Communication Technology (ICT) and Internet development in Indonesia. The journal follows the open-access philosophy and seeks high-quality manuscripts on the challenges and opportunities presented by information technology and the Internet in Indonesia. Journal mailing address:. Internetworking Indonesia Journal, PO Box 397110 MIT Station, Cambridge, MA 02139, USA.. Co-Editors Thomas Hardjono, PhD (MIT Kerberos Consortium, MIT, USA). Budi Rahardjo, PhD (ITB, Indonesia). Kuncoro Wastuwibowo, MSc (PT. Telkom, Indonesia). Editorial Advisory Board Prof. Edy Tri Baskoro, PhD (ITB, Indonesia) Mark Baugher, MA (Cisco Systems, USA) Lakshminath Dondeti, PhD (Qualcomm, USA) Paul England, PhD (Microsoft Research, USA) Prof. Svein Knapskog, PhD (NTNU, Norway) Prof. Merlyna Lim, PhD (Arizona State University, USA). Prof. Bambang Parmanto, PhD (University of Pittsburgh, USA) Prof. Wishnu Prasetya, PhD (Utrecht University, The Netherlands) Graeme Proudler, PhD (HP Laboratories, UK) Prof. Jennifer Seberry, PhD (University of Wollongong, Australia) Prof. Willy Susilo, PhD (University of Wollongong, Australia) Prof. David Taniar, PhD (Monash University, Australia). Technical Editorial Board Sulfikar Amir, PhD (NTU, Singapore) Moch Arif Bijaksana, MSc (IT Telkom, Indonesia) Teddy Surya Gunawan, PhD (IIUM, Malaysia) Dwi Handoko, PhD (BPPT, Indonesia) Mira Kartiwi, PhD (IIUM, Malaysia) Bobby Nazief, PhD (UI, Indonesia) Anto Satriyo Nugroho, PhD (BPPT, Indonesia). Yanuar Nugroho, PhD (Manchester University, UK) Bernardi Pranggono, PhD (University of Leeds, UK) Bambang Prastowo, PhD (UGM, Indonesia) Bambang Riyanto, PhD (ITB, Indonesia) Andriyan Bayu Suksmono, PhD (ITB, Indonesia) Henri Uranus, PhD (UPH, Indonesia) Setiadi Yazid, PhD (UI, Indonesia). Manuscript Language: The Internetworking Indonesia Journal accepts and publishes papers in Bahasa Indonesia and English. Manuscript Submission: • Manuscripts should be submitted according to the IEEE Guide for authors, and will be refereed in the standard way. • Manuscript pages should not exceed 7 pages of the IEEE 2-column format. It should be submitted as a Microsoft-Word file, using the IIJ Template document which can be found at the www.InternetworkingIndonesia.org website. • Manuscripts submitted to the IIJ must not have been previously published or committed to another publisher under a copyright transfer agreement, and must not be under consideration by another journal. • Papers previously published at conferences can be submitted to the IIJ, but must be revised so that it has significant differences from the conference version. • Authors of accepted papers are responsible for the Camera Ready Copy formatted using the same IIJ Template format. • Authors are advised that no revisions of the manuscript can be made after acceptance by the Editor for publication. The benefits of this procedure are many, with speed and accuracy being the most obvious. • Please email your papers (or questions) to: [email protected] Submission Guidelines: Please review the descriptions below and identify the submission type best suited to your paper. • Research Papers: Research papers report on results emanating from research projects, both theoretical and practical in nature. • Short papers: Short research papers provide an introduction to new developments or advances regarding on-going work. • Policy Viewpoints: Policy Viewpoints explore competing perspectives in the Indonesian policy debate that are informed by academic research. • Teaching Innovation: Teaching Innovation papers explore creative uses of information technology tools and the Internet to improve learning and education in Indonesia. • Book Reviews: A review of a book, or other book-length document, such as a government report or foundation report..
(3) Vol. 3/No. 1 (2011). INTERNETWORKING INDONESIA JOURNAL. 1. Editors’ Introduction . W. to the Spring 2011 issue of the Internetworking Indonesia Journal. This regular issue of the journal brings four (4) papers from a diverse background, covering a range from biomedical signals recognition to CDMA networks. To our delight one of the papers is written in Bahasa Indonesia, something that is in-line with our aims of promoting the culture of writing good scientific papers in Indonesia. We feel that developing one’s ability to express ideas, concepts and research methods/results in Bahasa Indonesia is an important step towards developing the habit of good research reporting – a skill that is transferable later when writing papers in English. As such, we see the IIJ also as “bridging” journal that fills a gap. Many Indonesian researchers are already able to produce good scientific papers in English, and thus are able to submit their papers to international conferences (e.g. IEEE sponsored conferences) and have access to these international conferences and journals. However, there remains the need for a national-level journal in Indonesia, one to which researchers who are comfortable writing papers in Bahasa Indonesia are able to submit their papers. Another aim of the journal is to provide a publishing venue for graduate students who are completing their Masters (S2) or Doctoral (S3) studies. To that end we are delighted that one of the papers in the current issue of the journal was written by a Master’s degree student. We feel it is important for the coming generation of students to begin writing papers early in their careers and to obtain experience in submitting papers to journals. The first paper in the current issue of the IIJ focuses on biomedical signals recognition research. The paper describes the identification of electrooculography (EOG) signals related to eye movements, and proposes the use of wavelet transforms instead of the usual Fourier transforms. The paper describes the data acquisition environment used to conducts the research work, and suggests that researchers in this field look into the details of the energy and frequency bands distribution (from the eye movement signals) in order to obtain better interpretation of the EOG signals. ELCOME. The second paper addresses a relevant issue in the area of software engineering. It focuses on the topic of test case generation, in which an automated approach to generating testcases for a system is performed. The paper proposes the use of a three tier architecture containing several components, including a source code analyzer, an XML parser, a constraint analyzer and a test data generator. The approach employs the branch coverage criteria using the Generalized Optimization Meta heuristic (GOM) algorithm and code constraint graph (CCG) to efficiently maximize the coverage of all the branches in the test case. The work finds that test case generation is faster than with the simple genetic algorithm. This is due to the fact that the number of iterations for reaching the optimal solution is quick. Traffic jam reduction and avoidance is the focus of the third paper, in which a literature survey is conducted on technologies that address the problem of traffic jams in highly populated areas. It surveys technical solutions that have proposed and adopted in some countries, including China and in Europe. The overall conclusion of the paper is that a combination of technical systems and regulatory approaches are needed in order to address the needs that are specific to the city or location in question. Finally, the fourth paper – written in Bahasa Indonesia – looks into techniques to improve channel management in CDMA networks in order to provide a better success rate for SMS message transmissions and therefore better utilization of a given CDMA network. SMS transmissions experience high failures rates in the presence of a high volume of voice traffic. The paper, which is written by engineers and researchers at the TELKOM Research and Development Center (in Bandung, Indonesia), provides some research data that points to the need for CDMA operators to address channel management in anticipation of times of high voice traffic that may impact SMS message transmissions. Seeing that SMS messaging is today an important part of personal communications many developing nations, this topic is very relevant for the telecommunications industry in Indonesia.. The editors can be reached individually at the following email addresses. Thomas Hardjono is at [email protected], Budi Rahardjo is at [email protected], while Kuncoro Wastuwibowo is at [email protected].. ISSN: 1942-9703 / © 2011 IIJ. Thomas Hardjono Budi Rahardjo Kuncoro Wastuwibowo.
(4) 2. INTERNETWORKING INDONESIA JOURNAL. ISSN: 1942-9703 / © 2011 IIJ. Vol. 3/No. 1 (2011).
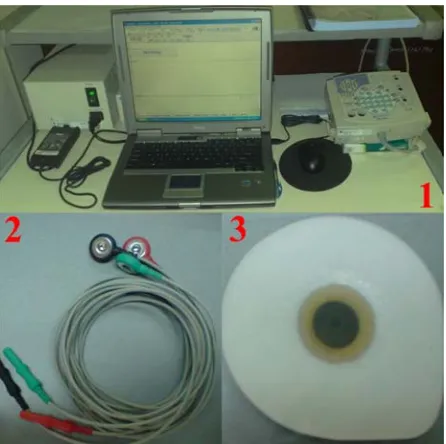
(5) INTERNETWORK N KING INDONE ESIA JOURNAL L. Vool.3/No.1 (2011). 3. Wavel W et App proach h on Frrequenncy Ennergy Distribu ution of o Elecctroocuulograpph Pottential to oward ds Direection W. W M. Bukharii W. Daud andd R. Sudirmaan Faculty F of Eleectrical Engin neering, Univversiti Teknoloogi Malaysia 81310 Skud dai, Johore, M Malaysia. Abbstract— Biom medical signals recognition activity has beeen stu udied by many y researchers. In I this study, we describe th he ideentification of Electro-oculog graphy (EOG)) signals of ey ye moovement potenttials by using wavelet w transforrm which givess a lot of informatiion than FFT T. The capabiility of wavellet traansform is to distribute the signal energy wiith the change of tim me in differen nt frequency bands. This will show th he chaaracteristic of the signals since s energy is i an importa ant phyysical variablee in signal an nalysis. The EOG E signals are a cap ptured using electrodes placeed on the foreh head around th he eyees to record thee eye movementts. The wavelet features are useed to d determine the characteristic c of eye movement waveform. Th his tecchnique is adop pted because it is i non-invasive,, inexpensive an nd acccurate. New technology enhancement has allowed a the EO OG siggnals to be ca aptured using the Neurofax EEG-9200. Th he reccorded data is composed of an a eye movemeent towards fou ur dirrections, i.e. upw ward, downwarrd, left and righ ht. The proposeed anaalysis for each h eyes signal is analyzed by y using Wavellet Transform (WT) by comparing the t energy distribution with th he gnal. A wavellet chaange of time and frequenccy of each sig scaalogram is plo otted to display y the differentt percentages of eneergy for each wavelet w coefficieent towards diffferent movemen nt. Froom the result, it is shown that the differeent EOG signa als exh hibit differencees in signals en nergy with theiir correspondin ng scaale such as leftt with scale 6 (8-16Hz), ( right with scale 8 (2( 4H Hz), downward with scale 9 (1-2Hz) and upw ward with scalee 7 (4--8Hz).. globe positive and the back w with globe neggative. This phenom menon was firsst observed byy Emil du Bois--Reymond in 1848 aand has been thhe foundation oof electrooculoography [1]. EO OG are taken uusing bipolar eelectrodes on thhe outside of the eyee. Exact electrrode placemennts vary, but thhe electrodes are gennerally placedd on the templees or on the ddistal ends of the forrehead. Whenn the eyes movve, a differenttial potential result will occur. Thhe magnitudess of the right and left eye movem ment can bee seen betw ween -75µV to 150µV respecttively. The polarity of movement ppotentials is dependdent on the eleectrode setup ssince the signaal is positive when tthe eyes are m moving towardd positive electtrode [1]. At presennt, EOG is ussed for the eevaluation of occulomotor abnorm malities suchh as nystaggmus, strabiismus, and suprannuclear occulom motor dysfuncttion is briefly eexplained by [2]. EO OG is a techniqque for measurring the restingg potential of the reetina. The reesulting signaal is called the electrooculoggram. The maain applications are in ophthhalmological diagnoosis and in recoording eye movvements [3]. T The EOG is a potentiial produced bby movement of the eye or eye lid. The generaation of the EOG signal can be undderstood by envisaaging dipoles loocated in the eyyes with the coornea having relativ ely positive pootential with reespect to the rettina [4].. IIndex Terms— —- Electro-oculogram, Eye Movement, M Sign nal Pottentials, Scalogram, Wavelet Traansform.. T. I. INTRODUCTION. The human eye is a spherrical structure with w a radius of 12mm. Thee signals thatt can be sen nsed from th he movement of the human eyes e can be kn nown as Electrroocuulography (EO OG). The EOG G is derived from f the Corneea Reetinal Potentiall (CRP) that iss generated wiithin the eyebaall by the metabo olically activ ve retinal ep pithelium. Th he prooduction of CRP comes fro om the hyper-p polarization an nd de--polarizations of the nervous cells in the reetina. EOG is th he eleectrical recordiing correspond ding to the eye movement. Th he eyee has a resting electrical po otential, with the front of th he. Fig. 1. Position off electrodes. EOG signal is picked up by a bi-chaannel signal This E acquis ition system consisting off the Horizonntal (H) and ment of the ellectrodes are Verticaal (V) channeels. The placem. ISSN: 194 42-9703 / © 20111 IIJ.
(6) INTER RNETWORKING G INDONESIA JOURNAL. 4. shoown in Figure 1. The EOG signals s are obtaained by placin ng two electrodes to o the right and d left of the outer o canthi (H H1, H2) to detect ho orizontal moveement and ano other pair abov ve andd below the ey ye (V1, V2) to o detect verticaal movement. A refference electrod de is placed on n the forehead (G). The overaall connnection is illu ustrated in Figu ure 2.. Fig. 2. (1) Data Acquisition n system. (2) Electrode E connecto or. (3) Disposablee Ag/AgCl bioelecttrode. N Numerous oth her techniques from the theorry of biomediccal siggnal processing g have been used u to obtain n representation ns andd extract the feeatures of interrest for classifiication purposees. Dinnesh [5] used the t EOG signaals for determin ning the angle of eyee gaze for con ntrolling a com mputer while Ay ysegul and Kaara [6]] used the EOG G signals for th he classification with Artificiial Neeural Network k (ANN), and Sudirman [7 7] used the ey ye moovement for the t classificatiion by using time frequenccy anaalysis. Study done d by the Bhander B [8] used the wavellet scaalogram decom mposition to determine d the most energy in speecific frequenccy bands of vertical v eye movement. m Theey fouund that 90% of o the signal en nergy (90%) iss concentrated in thee lower or high her scales and signal s denoisin ng.. II.. for thhe researcherss in signal processing. It has been successsfully implem mented in variious applicatioons such as transieent signal anallysis, communnication signalls and other signal processing appplications. Innstead of Fourrier analysis, waveleet analysis is sset up within tthe expansion of functions in term ms of a set of bbasic functionss. Different from Fourier, it expandds the functioon in terms off wavelets rathher than the trigonoometric polynoomials in Fouurier. It generaates wavelets in the form of transslation and diilation of a fixxed function called the mother waavelet. Waavelet functionns overcome the limitationss of Fourier methodds by employiing analyzing functions thatt are local in time annd frequency. It is a finite eenergy functionn and can be represeented on transiient signals. Inn signal processsing, wavelet analys is is used importantly in proocessing the noon-stationary signalss. The wavellet transform can be interrpreted as a decom mposition of the original signnal into set of independent frequenncy channels. It is essentiallyy the method oof processing data ffrom a conttinuous signaal into seriess of signal decom mpositions reprresented at diifferent frequeency ranges. This iss the use of thee mother wavellet. Inn signal processsing, wavelet analysis is moostly used in processsing non-statioonary signals. The wavelet trransform can be inteerpreted as a ddecomposition of the originaal signal into set of independent fr frequency comppositions. The wavelet has a vaniishing momentt localized both in frequenccy and time. Assum mption from tthe study donne by Magosso [18] has broughht us to this sollution. In both forms of wavelet analysis (continuous and discrette), the signal iis decomposedd into scaled annd translated versionns ab t of a single functiion t calledd the mother. . waveleet:. aab t . Waavelet transforrm is a powerrful tool in an nalyzing signaals beccause of its ab bility to extracct time and freequency domaain infformation. Thee wavelet transform could be b defined as an a exttension of th he classic Fou urier transform m, except thaat, insstead of working on a singlee scale (time or o frequency), it woorks on a multi-scale m bassis [10]. Waavelet function ns overcome the lim mitations of Fourier method ds by employin ng an analyzing function fu that are localized d in time an nd freequency. It has a finite energy e functio on and can be b reppresented on a transient signaals. In the previo ous studies as demonstrated by [11, 12, 13, 14, 15, 16, 17], wavelet analy ysis has develo oped excitemeent. t b a a . 1. (1). where a and b aree the scale aand translationn parameters respecttively, with aa, b andd a ≠ 0. Thee continuous waveleet transform ((CWT) of a ssignal s(t) L (the space oof the square inntegrable functtions) is defineed as: 2. C ab t . WAVELET T TRANSFORM. DAUD & S SUDIRMAN. . . . s (t ). t b dt a a . 1. (2). s ( t ), a ,b (t ) , where the symbol * mean complex conjugation and < > the inner product. The discrete wavvelet transform m (DWT) is obtaineed by discretizzing the param meters a and bb. In its most commoon form, the DWT employys a dyadic saampling with j. j. parameeters a and b bbased on powerrs of two: a =22 ; b = k2 , with j,,k Z. By subsstituting in Eqq. (1), we obtaiin the dyadic waveleets:. ISSN: 194 42-9703 / © 20111 IIJ.
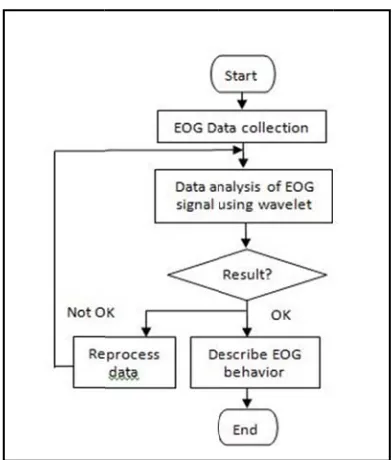
(7) INTERNETWORK N KING INDONE ESIA JOURNAL L. Vool.3/No.1 (2011). j ,k (t ) 2 j / 2 (2 j t k ). ). (3). Thhe DWT can bee written as. d j ,k . . . . s (t ),. s (t ) 2 j / 2 ( 2 j t k )dt. (4). j , k (t ) ,. By appropriaately selecting the mother wavelet w (t ) thhe colllection of functions fu {. . j,k(t) j,k 2 Z} forms an a. ortthonormal basiis for L . The correlateed DWT allow ws thee original sig gnal to be reconstructed r accurately an nd effficiently withou ut any redundaancy.. 5. plottedd as wide andd short rectanngles to indicaate that they localizze a wide tiime interval but a narrow w range of frequenncies in the daata. In contrast, rectaangles for coeffficients at higgh levels are plottedd thin and tall to indicate thaat they localize small time rangess but large freqquency ranges in the data. Thhe heights of the recctangles grow as a power oof 2 as the levvel increases. The baar shown on thhe scalogram pplot indicates the range of energyy for each scalle. This energyy is defined ass the sum of the sqquares of the detail coefficcient for eachh scale. The scalogrrams reveal thaat most of the energy of the ssignals in the data iss captured in thhe details coeffficient.. 2. A. Wavelet Energ gy Distribution n The orthonorm mality of the seet {. j, k. (t)j,k Z} allows th he. conncept of enerrgy within thee framework of the discreete waavelet decompo osition to be linked with th he usual notion ns derrived from the Fourier theory y. The energy series s associateed witth coefficient series s d. E j ,k d j ,k. j, k. is given g by. 2. (5). andd the overall en nergy at resolu ution j is. E j ,k . 2 M j 1. k 0. d j ,k. 2. III.. PROPO OSED WORK AND D METHODOLOGY. The syystem setting inncludes the EE EG data acquisiition system; Neuroffax EEG-91000 software [19] with EOG electrodes set and thhe sampling intterval is 1ms. The EEG dataa acquisition m is used to rrecord EOG ssignals from tthe subjects. system Indepeendent measureements can bee obtained from m both eyes, but as both eyes movve in the verticcal direction, itt is sufficient to meaasure the verticcal motion of oonly one eye ttogether with the hoorizontal motioon of both eyees. Ag/AgCl ellectrodes are chosenn as their half cell potential is closer to zerro compared to othher types suchh as silicon ruubber electrodees. Figure 3 below shows the ovverall workinggs for the propposed study. mize the noise This p rocess was donne in a quiet rooom to minim and heence get better recorded signaals as shown inn Figure 4.. (6). Heence, the total energy e associatted with the en ntire signal can be obtained as M. E tot j 1. 2 M j 1. k 0. 2. d j ,k .. (7). Energy coeffi ficients as comp puted by Eq. (7 7) have differeent d density oveer different frequency f ban nd loccalization and deppending on th he scale. Therrefore, in ordeer to study an nd com mpare the diffeerent movemen nt of energy at different scalees, it iis necessary to compensate fo or the halved tiime resolution at eacch scale due to the down n sampling op peration. These meethods have been b applied to the analysis of the EO OG siggnals. B. Wavelet Scalog gram W Wavelet scalo ograms (refer to Figure 6 and Figure 7) reppresent the tim me frequency localization property p of th he disscrete wavelet transform. In this t plot each detail d coefficieent is pplotted as a filled rectangle whose w color co orresponds to th he maagnitude of the coefficient. The location and size of th he recctangle are related to the tim me interval an nd the frequenccy rannge for this coefficient. c Co oefficients at low levels are a ISSN: 194 42-9703 / © 20111 IIJ. Fig. 3. Floow works of EOG G signal processingg.
(8) INTER RNETWORKING G INDONESIA JOURNAL. Subjects weree seated on a chair and su upervised by an a insstructor who gave instruction ns on how to move m their eyees. Thhe instruction composed of o four movements that are a upw ward, downwaard, left and rig ght. The record ding was done in fouur successive eye movemen nts for 10 sub bjects and eacch subbject repeated for three timess. Initially, EO OG was recordeed forr 20 to 30 seco onds for each eyes e movementt. Unfortunatelly, sinnce the subjeccts were show wing signs off tiredness, th he reccording duratio on was reduced d to 10 secondss which was freee froom artefacts ob bserved in longer traces by vissual inspection n.. DAUD & S SUDIRMAN. 200. 100. 0 A m pplitud ((uV ). 6. -100. -200. -300. -400. Vertical EOG Horizontal EO OG. 0. 100. 200. 300. 400. 500 600 Time (ms). 700. 800. 9000. 1000. Figure 5: Righht EOG signal plootted using MATLA AB. Figure 4: Vertical (pink) and Horizontal H (green) EOG signal displayed from data acquisition system m. The eyeball moved m to the deesired direction n and the centtre or static eye becomes the reference r poin nt. Furthermorre, subbjects were alsso asked to avo oid blinking, body b movemen nts or any disturban nces during th he recording to t minimize th he unw wanted artefaccts. EOG signaal captured waas then analyseed by using wavelet analysis frrom MATLAB B software an nd tooolbox applicatiion. Figure 5 is the real sig gnal of the rig ght moovement of EO OG signals by using MATLA AB. It shows th he bassic characteristtic of EOG pottentials.. It wass then uploadeed into a proggram that runns a wavelet scalogrram in order to present thhe signal in the wavelet coefficcient energy inn scale and spaace or time. T The signals is decom mposed down tto 10 level off details using Daubechies order 4 (db4) as a m mother wavelet. The db4 has been chosen becausse it has two vaanishing momeent, i.e. constaant and linear compoonent. The nuumbers of levvel decomposiition strictly dependd on the sample rate of originnal signal recorrded.. IV. RESULTS AND DISCUSSION Wheen it comes too the time freqquency analysiis in wavelet transfoorm, we are innterested in knnowing the distribution of signal energy of wavvelet details coefficient withh the change movement in of timee. Hence, we pplotted a scaloggram for each m order to identify thhe dominant sscales over thhe maximum waveleet energy coeffficient for thee signal. The sscalogram is used bbecause it reppresents the tim me frequency localization properrty of wavelett transform. IIn this plot, each details coefficcient is plotteed as a filledd rectangle w whose colors corresppond to the m magnitude of thhe coefficient. The bar on the scaalogram plot indicates the range of enerrgy for each level. T This energy is defined as thee sum of the sqquares of the detailss coefficient foor each scale. F Figure 6 and Fiigure 7 show the scaalogram of siggnals of four diifferent movem ments from a subjectt; left, right, doownward and uupward.. ISSN: 194 42-9703 / © 20111 IIJ.
(9) Vool.3/No.1 (2011). INTERNETWORK N KING INDONE ESIA JOURNAL L. i) Lefft eye Movemen nt. ii) Rigght eye Movem ment. Fig. 6. Scalogram m of horizontal eyee movements. ii) Downnward eye Movement. i) Upwaard eye Movem ment. Fig. 7. Scalogram m of vertical eye m movements. ISSN: 194 42-9703 / © 20111 IIJ. 7.
(10) 8. INTER RNETWORKIN NG INDONESIA A JOURNAL. ms reveal that highest h energy y of the signalss is The scalogram capptured in thee different scaale of detailss coefficient for diffferent EOG signals. s Frequ uency component extracted by dettails move from m high frequen ncies to low freequencies as sccale of wavelet coeffi ficient increasees from 1 to 10 0, with frequen ncy i in accordance a to the conntent being haalved at each increment sam mpling rate wh hich is 1000 Hzz (see Table I). A About 15 dataa for each eye movement hav ve been analyzzed by using wavelet scalogram in order to extract e the most m minant energy y details coeffficient and it frequencies. The T dom num mber of extraacted detail co oefficients fro om each levell is callculated and pllotted as shown n in Figure 8. From Figure 8, 8 it is nnoticed that the average perccentage for eacch movement data d is slightly differeent from their energy level. This means that t m are a associated d with differrent diffferent eye movements freequency bands.. The percentag ge of each detail d coefficieent of four eye e moovements is illustrated in Figure 8. Statistically, the dom minant energy y is: scale 6 forr left eye moveement; scale 7 for upw ward; scale 8 for right and scale s 9 for dow wnward. They are sum mmarized in Table II. D Dominant en nergy level means m the maximum m detaails coeefficient energ gy that can be derived by scalogram for eaach siggnal. We use th his parameter as a the benchmaark to classify the diffferent movemeent of EOG sig gnals.. DAUD & SUDIRMAN. SCALE. FR REQUENCY RA ANGE (Hz). 1. 250-500. 2. 125-250. 3. 62.5-125. 4. 331.25-62.5. 5. 115.6-31.3. 6. 7.8-15.6. 7. 3.9-7.8. 8. 1.9-3.9. 9. 0.9-1.9. 10. 0.5-1.0. Table 1: Frequeency Content 10 Level Decompoosition. EO G Sign als. Dominaant Energy S Scale. Aveerage Percen ntage (%). E Estimated Frrequency. Lefft. Scale 6. 880.0. 88-16 Hz. Righht. Scale 8. 998.2. 22-4 Hz. Upp. Scale 7. 999.2. 4-8 Hz. Dow wn Scale 9 995.4 1-2 Hz Table 2: Dom minant energy levvel for 15 EOG D Data. Fig. 8: Average percentages of energy levell for 15 data of vvertical and horiizontal eye moveements. ISSN: 194 42-9703 / © 20111 IIJ.
(11) INT TERNETWORK KING INDONES SIA JOURNAL. Vool.3/No.1 (2011). V. CONCLU USION AND FUT TURE RECOMME ENDATIONS This study haas classified each EOG siignals movem ment bassed on its esttimated frequeency using waavelet scalogrram deccomposition. This T is differen nt to previous studies in wh hich theey only focuseed on the overrall wavelet deecomposition and a nott specifically into i the detailss of each EOG G signals of eaach freequency bands. Hence, this paper p proposees and targets the ressearcher to loo ok into detailss of the energ gy and frequen ncy bannds distribution n within four eye e movement signals for bettter intterpretation off EOG signalls analysis by y using waveelet scaalogram. Resullt obtained ind dicates that eacch eye movem ment hass different freequency bands and could be integrated to dessign a supportt machine for paralyzed p peop ple to move th heir whheelchair by using eye movem ments.. 9. [13] S. G G. Mallat, 1989. A theory for multiiresolution signal decomposition: the wavelet representtation, IEEE Transs. Pattern Anal. M Mach. Intell. 11, 674 -693. Energy Distributioon in Time and [14] Auggust W. Rihaczekk, 1968. Signal E Freqquency. IEEE Trannsactions on Inforrmation Theory. 3669-374. [15] I. D Daubechies, 199 0. The Wavelett Transform. Tim me –frequency locaalization and signaal analysis, IEEE Trans. Inform. T Theory. 41, 961100 5. [16] J. J . Carr, J. M. Broown, 2001. Introdduction to BioMeddical Equipment Upper Saddle Rivver, New Jersey Techhnology, fourth edd. Prentice Hall. U Coluumbus Ohio. [17] Auggust W. Rihaczekk, 1968. Signal E Energy Distributioon in Time and Freqquency. IEEE Trannsactions on Inforrmation Theory. 3669-374. [18] E. M Magosso, M. Urs ino, A. Zaniboni,, E. Gardella “A Wavelet Based Eneergetic Approach ffor the Biomedicall Signals: Applicaation to the EEG and EOG”, Applied M Mathematics and C Computation 207 (22009) 42-62. Sudirman, A.C. Kooh, N.M. Safri, W W.B. Daud, N.H. M Mahmood, 2010. [19] R. S “ EE EG Different Freqquency Sound Ressponse Identificatioon using Neural Netw work and Fuzzyy Techniques” Proc. IEEE 6th. International Collloquium on Signall Processing and iits Application (CS SPA 2010).. ACKNOWLLEDGMENT Thhe authors are so indebted and a would lik ke to express our o thaankfulness to o the Biom medical Instru umentation and a Eleectronics Research Group (BMIE) at the Univerrsiti Teeknologi Malay ysia for their id deas and comm ments to impro ove thiis paper.. REFER RENCES J. Malmivuo, R. Plonsey, Bioelectromagnetis B sm: Principles and Application of Bioelectric B and Biomagnetic B Fieldss. New York: Oxfford University Press, New York, 1995 5,ch. 28. [2] K. Shinomiya, N. Itsuki, M. Ku ubo, H. Shiota, 20 008. Analyses off the o potential and cross-talk c at each electrode in Elecctrocharacteristics of oculogram. Thee Journal of Mediccal Investigation. Vol. V 55. 120-125. [3] F. Jagla, M. Jeergelova, I. Riecaansky, 2007. Sacccadic Eye Movem ment Related Potentials. Institute of Normal and Path hological Physiolo ogy, Center of Excellence for Cardiov vascular Research, Slovak Academy y of Sciences, Bratisslava, Slovakia. [4] R.B Knapp, H.. Lusted, 1993. Biological B Signal processing p in Virrtual Reality Appliccations, Proc. Virtual Reality and Persons with w Disabilities. [5] D. Kumar, E. Poole, P 2002. Classification of EOG for Human Computer Interface, Procceedings of the Seecond Joint EMB BS/BMES Conferen nce, Houston, TX, USA, U October 23-2 26. [6] G. Aysegul, K. Sadik, 2006. Classsification of electtro-oculogram sign nals n network. Exxpert System with Applications 31, 1991 using artificial neural 205. [7] R. Sudirman, W.M. W Bukhari, 2009. Classificatio on of Eye Movem ment Potentials Using g Time Frequency y Analysis, Proceeedings of the IAST TED International Conference C on App plied Simulation and a Modelling, ASM A 2009. 131-135. [8] A. Bhandari, V. V Khare, M. Trik kha, A. Anand. 2006. 2 Wavelet Baased Novel Techniqu ue for Signal Cond ditioning of Electro o-Oculogram Sign nals. Annual Indian Conference C INDIC CON. [9] R. K. Armen,, P. G. Joseph, Y. Minerva, E. K. Kristina, 20 006. Electrooculograam based system for computer con ntrol using a multtiple feature classificcation model. EM MBS Annual Interrnational Conferen nce, New York City, USA, Aug 30-Seept 3. [100] N. Hazarika, J. Z. Chen, C. Tsoi, A. Sergejew, 19 977. Classification n of I Trans. Sig gnal EEG Signals Using the Waveelet Transform. IEEE Processing. 51, Issue 1. 61-72. [11] D. Lee, A. Yamamoto, 1994. Wavelet Anaalysis: Theory And A H Packard Journal. Hewlet Packard Comp pany Applications, Hewlett CopyRight, 44-52. [122] I. Daubechies, 1988. Orthonom mal Bases of Compactly C Supported Wavelets, Comm munication on Purre and Applied Ma ath. 41, 909-996.. Wan n Mohd Bukhari Wan Daud is currrently pursuing his M Master of Electriical Engineering pprogram at the Univversiti Teknologi Malaysia Skudaii. His research interrests are Signal pprocessing especiaally in Wavelet Trannsforms, Biomediccal Instrumentatioon and Human Com mputer Interface. He can bee reached at [email protected].. [1]. ISSN: 194 42-9703 / © 20111 IIJ. B.S. (1994) and Rubiita Sudirman recceived both the B M.Scc. (1996) from Unniversity of Tulsa and Ph.D. from Univeersiti Teknologi Malaysia, all ddegrees are in Electr trical Engineeringg. Her current innterest includes mediccal electronics engineering, biom medical signal proceessing and speech recognition. She can be reached at [email protected]..
(12) 10. INTERNETWORKING INDONESIA JOURNAL. ISSN: 1942-9703 / © 2011 IIJ. Vol. 3/No. 1 (2011).
(13) Vol.3/No.1 (2011). INTERNETWORKING INDONESIA JOURNAL. 11. Test Case Generation using GOM Algorithm Selvakumar Subramanian and Ramaraj Natarajan. Abstract—Software testing involves appropriate validation and verification of a software component developed during the software lifecycle. Usually testing costs often account to high budget in the software development process. In order to minimize the testing costs, researchers and practitioners automate the testing process rather than carry out manual testing. Test Case Generation is the process of automatically generating a collection of test cases which are applied to a system under test. This paper utilizes branch coverage criteria using the Generalized Optimization Meta heuristic (GOM) algorithm and code constraint graph (CCG) to efficiently maximize the coverage of all the branches. The experimental results show that the proposed test generation technique is effective in generating tests for an application at large. Index Terms—Test case generation, branch evolutionary algorithm, Code Constraint Graph. coverage,. I. INTRODUCTION Testing is the process of exercising a software component using a selected set of test cases, with the intent of revealing defects. Testers need to detect these defects before the software becomes operational. Automating the testing process is a relevant issue since it will help reduce analysis costs by enabling a more systematic approach to testing [1]. A good test case is one that has a high probability of revealing a yet undetected defect. It requires the tester to consider the goal for each test case, that is, which specific type of defect is to be detected by the test case. Test Case Generation (TCG) is the process of automatically generating a collection of test cases which are applied to a system under test [28]. White-box TCG is usually performed by means of symbolic execution, i.e., instead of executing the program on normal values (e.g., numbers), the program is executed on symbolic values representing arbitrary values [9]. Test cases should be developed for both valid and invalid input conditions. That is, a tester must not assume that the software under test will always be provided with valid inputs. Inputs may be incorrect for several reasons. For example, software. Selvakumar. S. is with the Department of Information Technology, Thiagarajar College of Engineering, Madurai, India (Mobile: +919789916648; e-mail: [email protected]). Ramaraj N is with the Department of Computer Science &Engineering, G.K.M College of Engineering & Technology, Chennai, India (e-mail: [email protected]).. users may have misunderstandings, or lack of information about the nature of the inputs. A test case must contain the expected output or result and the results of the tests should be inspected meticulously. Branch coverage testing criterion encounters all the branches in a program i.e., the predicate of an ‘if’ statement should be evaluated to both true and false. The stronger criteria of condition, multiple-condition and path coverage are often infeasible to achieve for programs of more than moderate complexity, and thus branch coverage has been recognized as the basic measure for testing. A small number of test-data techniques have already been automated: random, static and dynamic, analysis-oriented, goal-oriented and structural or path-oriented test-data generators. Random generator is the simplest method of generation techniques, creates large amounts of test data; it could actually be used to generate input values for any type of program. Ultimately, a data type such as integer, string, or heap is just a stream of bits. However, because no information exists about the testing objectives, the generators often fail to find data that satisfy the stated objectives of the testing process. Since it merely relies on probability it has quite low chances in finding semantically small faults, and thus accomplishing high coverage. A semantically small fault is such a fault that is only revealed by a small percentage of the program input. Static and dynamic generators execute a program symbolically by means of variable substitution techniques instead of actual values. This technique requires plenty of computer resources. It also puts a lot of restrictions on the program. Symbolic execution also implies that a symbolic evaluator for the particular language is built which indeed requires a great amount of work. XML is now being used to replace large relational databases. Therefore, performance testing of XQuery implementations on very large documents is important [4]. Analysis-oriented generators have the ability to generate high quality test-data, but rely upon their designer with a great insight into the domain of operation, and hence are not readily extrapolate to arbitrary software systems. Goal-oriented generators provide guidance towards certain set of paths. Instead of letting the generator generate input that traverses from the entry to the exit of a program, it generates input that traverses a given unspecific path [11]. Because of this, it is sufficient for the generator to find input for any path. Two methods using this technique have been found: the chaining approach and the assertion-oriented approach. The latter is an interesting extension of the chaining approach. Typical for the chaining approach is the use of data dependence to find solutions to branch predicates. The characteristic of chaining is to identify a chain of nodes that are vital to the execution of. ISSN: 1942-9703 / © 2011 IIJ.
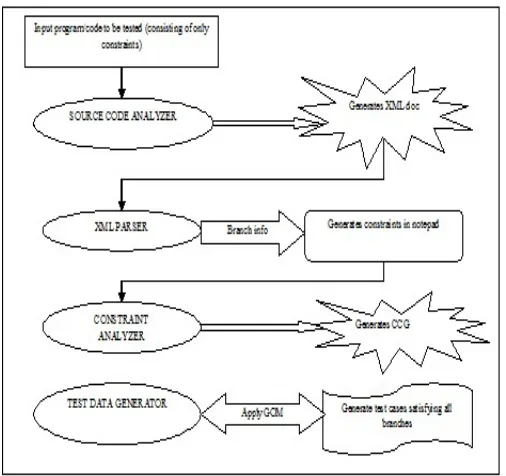
(14) 12. INTERNETWORKING INDONESIA JOURNAL. the goal node. This chain is built up iteratively during execution. Since this method uses the find-any-path concept it is hard to predict the coverage given as a set of goals. Assertion-oriented testing truly utilizes the power of goaloriented generation. Certain conditions, called assertions are automatically inserted in the code. When an assertion is executed it is supposed to hold, otherwise there is an error either in the program or in the assertion. But they have serious problems associated with failing to find the global minima. The search space tends to ‘lack features’ and consists of large ‘flat’ areas which provide no information on the location or the direction of the true local minima. Although a number of different goal-oriented approaches and algorithms exist, it is difficult to judge exactly which approach represents the current state of the art. Structural or Path-oriented generation identifies the path for which the test data is to be generated. Unfortunately, if the path is infeasible that would cause the generator to fail to find an input that will traverse the path. Even though it has the merit of very thoroughly testing a specific path, it has two severe disadvantages. The first is that the number of paths is exponential to the number of branches. The second is that many paths are impossible to exercise due to relationships between the data. Branch coverage criterion measures which decision outcomes of an ‘if’ statement have been tested. Determining the number of branches in a method is also easy. The total number of decision outcomes in a method is hence equal to the entry branch in the method plus the number of branches that need to be covered. The rest of this paper is organized as follows. Section 2 discusses research related to the related work. Section 3 presents the details of the proposed approach. Section 4 describes an experimental study of the proposed criterion and observations. Section 5 presents conclusions and future work.. SELVAKUMAR & RAMARAJ. documents and the generation of packets for testing communications protocols [6]. Recent research has shown how to integrate covering-array techniques such as pairwise testing into Grammar-based test generation tools [6]. Their work proposed two case studies showing how to use grammars and covering arrays for automated software testing. Valentin Dallmeier et al. [7] combined systematic test case generation and typestate mining, static typestate verifier fed with enriched models report significantly more true positives, and significantly fewer false positives than the earlier proposed models. [8] proposed an automatic test generation solution using dynamic symbolic execution, uses distance in control-dependency graph to guide path exploration towards the change. [8] is effective in generating change-exposing inputs for real-world programs. [9] proposed a symbolic execution mechanism, by developing a fully Constraint Logic Programming based framework for test case generation of an OO imperative language. Rafael Caballero et al. [10] presented a general framework for generating SQL query test cases using Constraint Logic Programming. [11] presented an automated approach to generate unit tests that detect these mutations for object-oriented classes, the resulting test suite is optimized towards finding defects rather than covering code and the state change caused by mutations induces oracles that precisely detect the mutants. [12] proposed an approach for automated test case generation based on techniques from constraint programming. [13] proposed a scalable toolset using Alloy to automatically generate test cases satisfying T-wise from SPL models. [13] defines strategies to split T-wise combinations into solvable subsets. III. OVERVIEW OF THE APPROACH. II. RELATED WORK The work of M.F Bashir, and S.H.K. Banuri, [1] extends the paradigm of the test data generation system to incorporate both specifications and model based testing which helps to perform the reclassification of the code, specification or model based techniques. Several attempts have been made to develop a system to generate test data automatically. The existing such system does not guarantee to generate test data in only feasible paths. Praveen Ranjan Srivastava et al. [2] proposed a method to generate feasible test data, using Genetic Algorithm. It is often desired that test data in the form of test sequences within a test suite can be automatically generated to achieve required test coverage. The work of Sushil K. Prasad et al. [3] proposes Genetic algorithm to test data generation for optimizing software testing. Ana Barbosa et al. [5] proposed a test case generation approach to modelbased testing of graphical user interfaces from task models. [5] shows how task mutations can be generated automatically, enabling a broader range of user behaviors to be considered. More recently, Grammar-based test generation has been applied to many other testing problems, including the generation of eXtensible Markup Language (XML). A. Framework The block diagram of this proposed approach is depicted as in Fig.1. It consists of a three-tier architecture containing the following four blocks: Source code analyzer, XML parser, Constraint analyzer and Test data generator. Initially, a sample code consisting of only ‘if-else’ constraints is taken as input. As the name ‘constraint’ specifies, the input code that is to be tested should never contain or be allowed any loops such as ‘while’ or ‘for’ loops. The source code analyzer block analyses the input code and generates an XML document which separates the constraints and their outcomes and also neglecting the statements if any, present. The XML parser block initiates the XML document and creates a notepad file containing the constraints similar to those present in the XML document, given as the input file to the algorithm employed i.e., the evolutionary meta-heuristic algorithm. The primary portion of the third block which is the constraint analyzer takes the notepad file generated earlier as input and generates a graph called the Code Constraint Graph (CCG). This graph indicates the program flow of the source code as to which branches are present and which are to be tested. The CCG is no longer used because it just shows the control flow of the input source code. The secondary portion of the third. ISSN: 1942-9703 / © 2011 IIJ.
(15) Vol.3/No.1 (2011). INTERNETWORKING INDONESIA JOURNAL. block called the test data generator block implements the evolutionary algorithm namely the Generalized Optimization Meta-Heuristic (GOM) algorithm, which takes the notepad file to be checked against the constraints separated. The test data generator block first generates a random set of integers which may range from positive to negative. The set may contain an approximate number of 40-50 random integers. For each of the random set of integers, a fitness formula is evaluated in order to advance to the next population. After calculating the fitness for each of the random set of integers, fitness values are assigned to them. The chromosome with the optimal fitness is chosen as the base chromosome for the next generation of members. Each chromosome contains 24 bits. So the 24 members of the next population are generated from the base chromosome by flipping each bit of it. Those newly generated members are then calculated by the given fitness functions. Then the chromosomes are ranked according to their fitness values, from worst to the best. The optimal chromosomes of the next and the previous population are compared. The population that has a comparatively lesser optimal chromosome is deleted and the other one is kept as the base chromosome for the generation of the members of the next population. Cross over and mutation operations are applied to them if necessary.. 13. are equal, then the program returns a scalene triangle. So in this algorithm the above procedure of ranking and cross-over mutation operations are repeated three times, i.e., each for three sides of a triangle A, B, C. The generated members of the first population contain the chromosomes each with three genes that indicate the three variables used in that program. Every chromosome is then passed to the notepad file and checked against the constraints. When the chromosomes passed satisfy the particular constraints, a counter variable is incremented so as to count the number of branches satisfied by them. This procedure is repeated for each chromosome of the first population. After completing all the members of the first population, the same operations are performed for each pair of genes and then by applying cross over and mutation operations. The above procedure is repeated till the maximum number of branches is satisfied by the branch coverage criterion. The GOM algorithm generates three genes in each chromosome, as the number of variables involved in the source code is three. Before the generation of the appropriate genes in a chromosome, the program module is first parsed and all the ‘if-else’ branches involved are separated in a notepad file in order to easily give input to the GOM algorithm.. Fig. 2. Module of triangle classification.. Fig. 1. Proposed Framework for test case generation. B. Motivational Example Consider the triangle classification program in Fig. 2, which accepts three variables say A, B and C each for the three sides of a triangle. The triangle classification accepts three integers as the three sides of a triangle, and decides which type of triangle it based upon the length of these three slides. The four possible results are: scalene, isosceles, equilateral and not a triangle. If all the three sides are equal, the program returns an equilateral triangle. If any two sides are equal, the program returns an isosceles triangle. If none. C. Formulation of branch coverage The proposed approach in this paper utilizes branch coverage criteria using a Generalized Optimization Meta heuristic (GOM) algorithm and code constraint graph (CCG). The process of generating test cases using GOM algorithm and CCG graphs is as follows; assume the input that is to be checked against the constraints in the source code to range I as: {I1, I2,…,In,}. Define and identify the test constraint set C as: {C1, C2,…,Cm}. For each and every input I, the test cases (Tc) are generated so that those inputs must satisfy the appropriate constraints encountered in the constraint set and this process is repeated until the maximum branch coverage is attained as output for the given input set. The amount of branch coverage (Tbc) criterion can be expressed mathematically as: bc. FITNESS = 100 – Tbc Where BC - number of branches covered SC - number of statements covered MC - number of methods covered. ISSN: 1942-9703 / © 2011 IIJ.
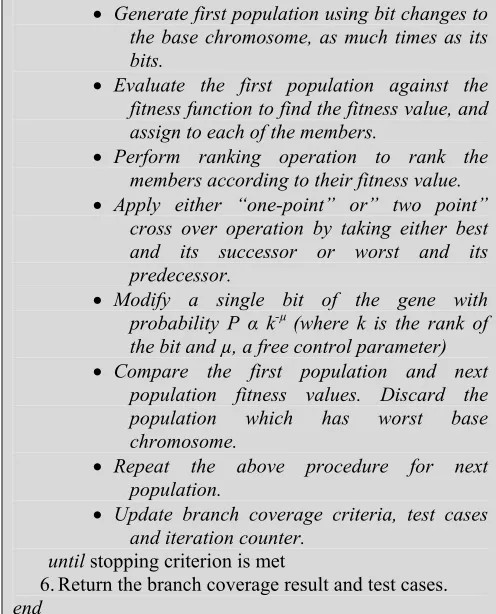
(16) 14. INTERNETWORKING INDONESIA JOURNAL. B – Total number of branches S – total number of statements M – total number of methods The steps to be employed are as follows: A sample input code containing ‘if-else’ constraints is taken as input. The constraints present in the source code are separated by reading line by line and the unnecessary statements, header files, braces and new lines are removed. The GOM algorithm is employed after generating a random set of integers say, up to 40-50 iterations. The test cases are generated by the GOM algorithm indicating which branches are covered by appropriate chromosomes, each containing three genes. The percentage of branch coverage by the chromosomes is obtained by applying the relevant formulas regarding the branch coverage. The highest percentage of coverage by the chromosomes is returned as the best solution. D. Proposed pseudo code of the algorithm Fig. 3 depicts the pseudo code of a Generalized Optimization Meta-Heuristic (GOM) Procedure TDGen Input: Program: code/program under test Output: CCG: A code constraint graph, which shows the control flow of the source code. Test cases: A set of test cases that is generated using GOM algorithm. begin 1. A sample code consisting of “if-else” conditions is taken as input. 2. The source code analyzer generates an XML document by analyzing the constraints in the source code and separates them in that document. 3. The XML parser goes through the XML document created and creates a notepad file containing only constraints so as to easily give as input against the GOM algorithm. 4. The constraint analyzer accepts the notepad as input and generates a tree called Code Constraint Graph (CCG) so that it shows a program flow of the source code with constraints as which branches are present and that are to be tested. 5. For each entry of the requirements. Initialize randomly the population of S species (bits) that are used to encode D program variables. loop For each of the S bits of the species, find the fitness value. Find the base chromosome that has the best fitness among the generated members.. SELVAKUMAR & RAMARAJ. Generate first population using bit changes to the base chromosome, as much times as its bits. Evaluate the first population against the fitness function to find the fitness value, and assign to each of the members. Perform ranking operation to rank the members according to their fitness value. Apply either “one-point” or” two point” cross over operation by taking either best and its successor or worst and its predecessor. Modify a single bit of the gene with probability P α k-µ (where k is the rank of the bit and µ, a free control parameter) Compare the first population and next population fitness values. Discard the population which has worst base chromosome. Repeat the above procedure for next population. Update branch coverage criteria, test cases and iteration counter. until stopping criterion is met 6. Return the branch coverage result and test cases. end Fig. 3 Generalized Optimization Meta-Heuristic (GOM) pseudo code. Separation of constraints from the source code: The source code itself cannot be tested since it has irrelevant codes such as printing statements, other logical statements, etc. So it is necessary to separate the constraints alone from the source code, in this case the branches with their appropriate outcomes i.e., children. The methodology used to separate the branches alone from the source code consists of reading each and every line of the source code until a branch or constraint is encountered. A better way to implement this methodology is to read the source code and place them in an XML document. As seen in Fig. 1, the source code analyzer block performs this operation. As the branches are separated in that XML document, the unnecessary new lines, braces and other header files are removed so that only the constraints are filtered. The generated XML document is parsed and the appropriate operations are performed so that the unnecessary codes are removed. As seen in Fig.1, the XML parser block performs this operation. The filtered branches are placed in a notepad file, given as input to the GOM algorithm. In the notepad, an @ symbol is referenced before each branch so that a constraint is encountered. If any children’s are present in a branch, the @ symbol is incremented and if the line comes outside the ‘if-else’ branch, the @ symbol is appropriately decremented. The generated filtered branches and/or constraints from the source code are visualized as in Fig. 4 as:. ISSN: 1942-9703 / © 2011 IIJ.
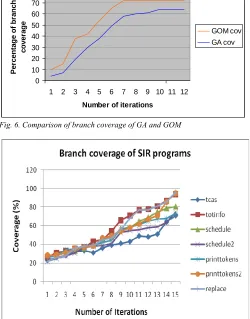
(17) Vol.3/No.1 (2011). INTERNETWORKING INDONESIA JOURNAL. Fig. 4 Sample constraint generation. Generation of Code Constraint Graph (CCG): The Code Constraint Graph can be generated from the notepad file created as in Fig.3 to show the control flow of the source code consisting of constraints. As in fig. 1, the constraint analyzer block performs this operation of generating the CCG. The sample CCG generated from the triangle classification module can be visualized as in fig. 5 as shown below:. Fig. 5. CCG generation. Generating test cases using proposed evolutionary algorithm: The proposed Generalized Optimization Meta Heuristic (GOM) algorithm is a type of an evolutionary algorithm (EA) that makes use of evolutionary [16, 17] strategies (ES) and evolutionary programming (EP). The main idea behind the EAs is to evolve a population of individuals (candidate solutions for the problem) through competition, mating and mutation [18], so that the average quality of the population is systematically increased in the direction of the solution of the problem at hand. The evolutionary process of the candidate solutions is stochastic and “guided” by the setting of adjustable parameters. In an analogy with a natural ecosystem, in a EA different organisms (solutions) coexist and compete. The more adapted to the design space will be more prone to reproduce and generate descendants. On the other hand, the worst individuals will have fewer or no offspring. In an optimization problem, the fitness [19, 20] of each. 15. individual is proportional to the value of the objective (cost) function, also called fitness function. In a GOM algorithm, each bit is considered a species and a string of S bits is taken as the initial population of the species. The string consisting of S bits then encodes the D program variables to be represented in a binary format of 0’s and 1’s. In a variation of the canonical GOM described above, the bits are ranked separately for each substring that encodes each program variable, and N bits, one for each variable are flipped at each iteration of the algorithm. First, the GOM algorithm generates the random integers of up to 40-50 numbers. From the generated random numbers, each and every two pair of integers is taken into account. The second number of the pair is taken and the bits of that number are ranked according to their priority. The highest and the lowest bits are taken as an average to obtain a result. In the first number of the pair the shifting operation is performed, as many times as the result of averaging. The same procedure is repeated for the second number and the modified first and second numbers are kept aside. Then these numbers undergo appropriate cross over and mutation operations. The cross over method used here is the “two point” cross over. The mutation operation is then performed with respect to the probability P α k-µ, where k is the rank of the bit and µ, a free control parameter. These optimized integers are then checked against the notepad file generated earlier. When the chromosomes satisfy a particular branch, a counter variable is incremented which indicates the number of branches that are satisfied by a single chromosome. In this case, a single chromosome consists of three genes since the number of variables encountered in the triangle classification is three namely A, B, C. The above procedure is repeated till the chromosomes in all populations by means of branch coverage criteria cover a maximum number of branches. The general representation of two-point cross over can be represented as: The two point crossover operator takes two vectors (a1,… , an) and (b1,… , bn) and yields two vectors (a1,… , ai, bi+1,… , bj, aj+1, ……, an) and (b1,… , bi, ai+1,… , aj, bj+1, ……, bn), where 1≤ i < j ≤ n-1 and i and j are randomly chosen. This means that both vectors are split at the same two positions and assembled with swapped middle parts. An example of a mutation operation performed is, Before: 1 1 0 1 1 0 1 0 0 1 1 0 1 1 1 0, After: 1 1 0 1 1 0 0 0 0 1 1 0 1 1 1 0, a change of bit in the gene takes place at bit position 6. IV. THE EXPERIMENT A. Subject Programs, Faulty Versions, and Test Case Pools To examine the efficacy of our approach, the proposed approach was evaluated using real-world programs. In this section, we report the empirical evaluation results. We compared the GOM Coverage with the GA Coverage. In the experiments, the Siemens suite programs (Table 1), similar to those used by Dawei Qi et al. [8] and Rothermel et al. [15] were used to validate the performance of the proposed approach. Each program was hand-instrumented to record all the coverage information. Each program has a variety of. ISSN: 1942-9703 / © 2011 IIJ.
(18) INTERNETWORKING INDONESIA JOURNAL. versions, each containing one fault. Each program also has a large universe of inputs. We obtained the subject programs from the Software-artifact Infrastructure Repository at UNL [14].. Name. TABLE I SIEMENS SUITE SUBJECT PROGRAMS Lines of Faulty Test Program code version pool size count Description. tcas. 162. 41. 1608. Altitude separation. totinfo. 346. 23. 1052. Information measure. schedule. 299. 9. 2650. Priority scheduler. schedule2. 287. 10. 2710. Priority scheduler. printtokens. 378. 7. 4130. Lexical analyzer. printtokens2. 366. 10. 4115. Lexical analyzer. replace. 514. 32. 5542. Pattern replacement. Space. 9127. 38. 13,585. Array definition language interpreter. 80 70 60 50 40. GOM cov GA cov. 30 20 10 0 1. B. Experimental Results and Observations To examine the efficacy of our approach, we evaluated our approach using real-world programs. In this section, we report our empirical evaluation results. The obtained results of branch coverage criteria can be depicted by a graph as in Fig. 6 showing the convergence of coverage. The number of iterations is scaled along the X-axis and the percentage of branch coverage is scaled along the Y-axis. As compared to the simple genetic algorithm, GOM algorithm converges faster in less number of iterations. The maximum branch coverage obtained by applying the proposed algorithm is nearly 71%. As seen in Fig. 6, the applied GOM algorithm converges at a faster rate than the simple genetic algorithm i.e., at iteration 70 (number 7), the GOM reaches the maximum branch coverage of 71% and it is consistent in the further numbers of iterations, whereas the genetic algorithm reaches the maximum branch coverage of 64% only at iteration 100 (number 10).. SELVAKUMAR & RAMARAJ. Branch coverage. Percentage of branch coverage. 16. 2. 3. 4. 5. 6. 7. 8. 9 10 11 12. Number of iterations. Fig. 6. Comparison of branch coverage of GA and GOM. Fig. 5. Branch coverage of SIR objects. Fig. 7 shows the Branch coverage of the SIR objects. In terms of numbers, the vast majority of all test cases have at least one assertion. Although the achieved score is quite high, the search based approach offers potential for optimization. While the coverage based impact measurement guides the search towards assertions, in the experimental of SIR programs, for certain cases GOM is fair in coverage. V. CONCLUSIONS AND FUTURE WORK The GOM algorithm implemented gives a suitable way for automatic test case generation. The ease of test case generation is faster than with the simple genetic algorithm since the number of iterations for reaching the optimal solution is quick. The separation of constraints from the source code and then exporting them to a separate notepad file makes the implementation of this algorithm further easier. The code constraint graph (CCG) generated allows understanding the control flow of the source code to depict the amount of statements, branches and methods present and also which are covered. The cross-over and mutation operations are optional, since the algorithm has the capability to converge well without performing those operations. In terms of future work, we can extend our method by improving the fitness function to. ISSN: 1942-9703 / © 2011 IIJ.
(19) INTERNETWORKING INDONESIA JOURNAL. Vol.3/No.1 (2011). deduce a better result above the maximum amount of coverage obtained. ACKNOWLEDGMENT. 17. [19] P. Thevenhod-Fosse, H. Waeselynck, STATEMATE: applied to statistical software testing, Proceedings of the 1998 International Symposium on Software Testing and Analysis, 1998. [20] J.M. Voas, L. Morell, K.W. Miller, Predicting where faults can hide from testing, IEEE Software 8 (2) (1991) 41–48.. We thank Dr. Gregg Rothermel, Dept. of Computer Science, University of Nebraska, for providing the Siemens Suite of programs. REFERENCES [1] [2] [3]. [4] [5] [6]. [7]. [8] [9]. [10]. [11] [12]. [13]. [14] [15]. [16] [17] [18]. Bashir, M.F, Banuri, S.H.K., "Automated model based software Test Data Generation System", Proc. 4th International Conference on Emerging Technologies, pages 275-279, Oct.2008. Praveen Ranjan Srivastava, Priyanka Gupta, Yogita Arrawatia, Suman Yadav, Use of genetic algorithm in generation of feasible test data ACM SIGSOFT Software Engineering Notes, Vol. 34,Issue 2, March 2009 Sushil K. Prasad, Susmi Routray, Reema Khurana and Sartaj Sahni, “Optimization of Software Testing Using Genetic Algorithm” Third International Conference Information Systems, Technology and Management, pages 350-351, March 2009 Daniel Homan, David Ly-Gagnon, Paul Strooper, and Hong-Yi Wang, Grammar-Based Test Generation with YouGen, Software Practice And Experience, 1:1-20, 2009. A. Barbosa, A. Paiva and J.C. Campos, Test case generation from mutated task models, ACM Symposium on Engineering Interactive Computing Systems, 2011. Daniel Hoffman, Hong-Yi Wang, Mitch Chang, David Ly-Gagnon, Lewis Sobotkiewicz, Paul Strooper, Two case studies in grammar-based test generation, Journal of Systems and Software, Volume 83 Issue 12, December, 2010. Valentin Dallmeier, Nikolai Knopp, Christoph Mallon, Sebastian Hack, Andreas Zeller, "Generating test cases for specification mining", Proceedings of the 19th international symposium on Software testing and analysis ACM, NY, USA 2010. Dawei Qi, Abhik Roychoudhury, Zhenkai Liang, Test Generation to Expose Changes in Evolving Programs, 25th IEEE/ACM International Conference on Automated Software Engineering (ASE), September 2010. Miguel G´Omez-Zamalloa1, Elvira Albert1, Germ´ An Puebla, Test Case Generation for Object-Oriented", Imperative Languages in CLP, Journal of Theory and Practice of Logic Programming, Volume 10 Issue 4-6, July 2010. Rafael Caballero, Yolanda García-Ruiz, Fernando Sáenz-Pérez, " Applying Constraint Logic Programming to SQL Test Case Generation", Proceedings of 10th International Symposium, FLOPS 2010, Sendai, Japan, April 1921, 2010. Gordon Fraser, Andreas Zeller, "Mutation-driven Generation of Unit Tests and Oracles" Proceedings of the 19th international ACM symposium on Software testing and analysis, NY, USA, 2010. François Degrave, Tom Schrijvers and Wim Vanhoof, "Towards a Framework for Constraint-Based Test Case Generation", Logic-Based Program Synthesis And Transformation, Lecture Notes in Computer Science, 2010, Volume 6037, 2010. Perrouin, G., Sen, S., Klein, J., Baudry, B., le Traon, Y., "Automated and Scalable T-wise Test Case Generation Strategies for Software Product Lines" , Proceedings of the 2010 Third International Conference on Software Testing, Verification and Validation, Paris, pages 459 - 468, 6-10, April 2010. Software infrastructure repository (SIR) http://www.cse.unl.edu/~galileo/sir. Gregg Rothermel,M. J. Harrold, J. Ostrin, and C. Hong. An empirical study of the effects of minimization on the fault detection capabilities of test suites. International Conference on Software Maintenance, pages 34–43, November 1998. S. Horwitz. Tool support for improving test coverage. In Proceedings of ESOP 2002: European Symposium on Programming, 2002. P. McMinn, M. Holcombe. The State Problem for Evolutionary Testing, GECCO, 2003, pp. 2488–2498. C.C. Michael, G. McGraw, M. Schatz. Generating Software Test Data by Evolution, IEEE transactions on software engineering 27 (12) (2001) 1085–1110.. Selvakumar. S is completing his Ph.D research work in Computer Science & Engineering from the Anna University. He received the Masters Degree in Computer Science & Engineering from Madurai Kamaraj University in 1996. He received the Master of Business Administration from the same University. He has over 15 years experience in various institutions and Organizations. Currently he is an Assistant Professor in the Department of Information Technology, Thiagarajar College of Engineering. He has long been interested in Software Engineering. His research interests include Software Testing, Software Quality Engineering, Software Project Management, Software Metrics and Data mining, Data Base Systems. He also had a carrier as a developer for realtime, business-critical systems. Thus he has experience both with the practical problems of software development and the theoretical underpinnings of Software Engineering and Computer Science. He has presented a number of papers in international journals and in various other journals. He has carried out various sponsored Short Term Training Programs and worked on various Projects. He is a Senior Member in the Computer Society of India, Member in the Institute of Engineers and the Indian society of Technical Education. Ramaraj. N received bachelor degree in Electrical and Electronics Engineering from Madurai Kamaraj University, Madurai, Tamil Nadu, in the year 1976. Received Masters Degree in Power System Engineering from the Madurai Kamaraj University, Madurai, Tamil Nadu, in the year 1980. Received PhD degree from Madurai Kamaraj University, Madurai, Tamil Nadu in the year 1992 in Computer Applications. He is the Principal of GKM Engineering College, Chennai, Tamil Nadu, India. He has more than 25 years of teaching experience and has presented a number of papers in international journals (20) and in various other journals (35). His area of interest is Artificial Intelligence, Software Engineering, Software Testing and Distributed Computing. He is a Member in the Institute of Engineers and the Indian society of Technical Education.. ISSN: 1942-9703 / © 2011 IIJ.
(20) 18. INTERNETWORKING INDONESIA JOURNAL. ISSN: 1942-9703 / © 2011 IIJ. Vol. 3/No. 1 (2011).
(21) INTERNETWORKING INDONESIA JOURNAL. Vol.3/No.1 (2011). 19. A Review of Existing Traffic Jam Reduction and Avoidance Technologies Benny Hardjono Universitas Pelita Harapan, Indonesia Abstract—Traffic congestion has become a growing problem in many countries since the innovation of engines, and consequently, the mass production of commuter vehicles in the 19th century. A number of solutions have been sought to reduce its impact. Through a literature survey, this paper attempts to categorize a number of current approaches and identify the strengths and weaknesses of each solution or a combination of such solutions, in order to build a good background study. From this survey it has become clear that for success any solution most likely will have to integrate technologies from the different categories. For example, technical solutions must be combined with good traffic rules and regulations. Public education and the announcement of new regulations for commuters must be performed in stages and repetitively to increase public awareness. Index Terms—traffic jam avoidance, congestion, integrated and intelligent system.. C. I. INTRODUCTION. URRENTLY there are numerous problems associated with traffic jams. Aside from the delays that a traffic congestion may cause, it can also affect people psychologically (in terms of stress) as well as physically (causing tiredness, accidents, noise pollution and breathing problems due to air pollution). Traffic jams can be caused by obvious factors, such as the overflow of vehicles during busy hours or at special events, accidents, slow vehicles obstructing fast lanes, etc. and also by not so obvious reasons like (i.e. ripple effect which causes phantom traffic jams [1]). Many researchers have offered various approaches to tackle the traffic jam problem. The cost to reduce its impact has also been growing, which makes many developing countries lag behind in their effort to overcome it. For example, in 2003 to 2004 alone Great Britain [2] has spent 242 million pounds to start its Making Better Use (MBU) program, which is part of its Highway Agency program. This program includes (but not limited to) the installation of automated incident detection and warning system, CCTV cameras, advanced road side message signs, spot improvements on needed areas (such as improving layouts of lanes and junctions and signaling at various junctions), finding novel approaches to traffic management Benny Hardjono is with the Universitas Pelita Harapan, at the Tanggerang campus, Indonesia (e-mail: benny.hardjono@ uph.edu).. and the management information systems necessary to support the agency's work, as well as research and development of a national traffic control center. Each approach can use one particular technology or a combination of them. A couple of common technologies used in many relatively advanced countries are ETC (Electronic Toll Collection) which was started in 1986 in Norway, and VICS (Vehicle Information and Communication System) which was started in the 1990s in Japan [3]. ETC allows drivers to pass a toll gate without stopping for payment and is installed in many cars. The VICS system [16] is a service using FM broadcast and optical beacons on the roadside to deliver traffic jam information to drivers so that their car navigation systems can display congested areas/roads on the map and navigate them avoiding the congested areas. Both systems can reduce the possibility of traffic jams, but requires supporting devices on the roads and on each vehicle. The ETC method not only requires a device on each vehicle, but it also assumes that each vehicle owner abides by the regulation; otherwise the automatic bank-account deduction mechanism will not work. Additionally, there is the extra cost incurred when the authorities want to persecute negligent vehicle owners. Similarly in the VICS system, although VICS is useful there could be a time lag between the disseminated information and the real situation faced by the driver. This is because VICS collects all traffic jam information to one location (e.g., a central server), and disseminates it after processing. Also, if all cars in a certain road receive the same information and change their route in the same way according to the information, then the selected route will be congested quickly. Additionally, VICS requires many devices to be installed on the roadside for monitoring traffic conditions, and thus it is costly to deploy the VICS system on small roads (which can be used as alternative routes during a traffic jam). The cost is even higher when considering coverage for a large metropolitan city. II. RESEARCH & REVIEW METHOD This paper attempts to categorize a number of current approaches, as well as identify the strengths and weaknesses of each solution or a combination of solutions. The aim is to build a good background study, before proposing new ideas. The method used is through a literature survey. The survey. ISSN: 1942-9703 / © 2011 IIJ.
Figure


+7


Related documents
Figure 29: Convergence of onshore directed wave induced transport (blue) and offshore directed tidal and subtidal current induced transport (red) over Curlew Shoal induces
National Conference on Technical Vocational Education, Training and Skills Development: A Roadmap for Empowerment (Dec. 2008): Ministry of Human Resource Development, Department
○ If BP elevated, think primary aldosteronism, Cushing’s, renal artery stenosis, ○ If BP normal, think hypomagnesemia, severe hypoK, Bartter’s, NaHCO3,
Such agreements are often defined by service level agreements (SLAs), which indicate the quality of service that the provider will guarantee, or peering contracts, which define
In this section we introduce primitive recursive set theory with infinity (PRSω), which will be the default base theory for the rest of this thesis (occasionally exten- ded by
The UCEAP Scottish Parliament Program offer University of California students the unique opportunity of expanding their political knowledge and experience by
The methane emissions for years 1999-2015 in all 16 voivodeships of Poland were calculated according to the methodology used by the Nation- al Centre for Emissions Management
This method of determining the Final Price will apply only if Bank informs potentially interested parties (including, but not limited to, Parent) that Bank intends to enter into
