Method Development and Validation of Related Substances by HPLC for Analysis of Valacyclovir Hcl in valacyclovir Hcl Tablet Formulations
10
0
0
Full text
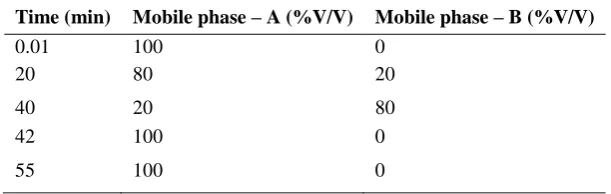
(2) 193 B.Bhagyalaxmi et al / Int. J. of Pharmacy and Analytical Research Vol-3(2) 2014 [192-201]. Related substances Impurity –A: 2-amino –1,9-dihydro-6H-purine-6-one (guanine) Impurity –B: 2-amino –9-[(2-Hydroxyethoxy) methyl]-1, 9-dihydro-6H-purine-6-one Impurity –C: 2-[(2-amino-6-oxo-1, 6-dihydro-9H-purine-9-yl) methoxy] ehylN-methyl- L-valinate Impurity–P: 2-[[2-[[[[9-[[2-[[(2S)-2-amino-3-methyl-1-methylenebutyl] oxy] ethoxy] methyl]-6-oxo-6,9dihydro-]H-purin-2-yl]amino]methyl]amino]-6-oxo-1,6-dihydro-9H-purine-9yl]methoxy]ethyl L-valinate. EXPERIMENTAL SECTION Chromatographic conditions Column Flow Rate Wave Length Injection Volume Column Temperature Run Type. : Zorbax SB Phenyl, 4.6 X 250mm, 5µm : 1.0 ml/min : 254nm : 20µl : 30 0C : 55 min. Method for impurity testing (Related substance) was done by injecting standard, blank and Impurities- A, B, C and P into the chromatogram at conditions of Zorbax SB phenyl, 4.6 X 250mm, 5m, flow rate at 1.0 ml/minutes, injection volume of 20land maintaining the temperature at 30oC for run time of 55 min. Detection was measured at 254 nm. Preparation of standard Solutions Accurately weigh and transfer about 58 mg of valacyclovir HCl W.S into a 100ml of V.F, add 2ml of diluent – A, sonicated. Add 60 ml of diluent – B and sonicated to dissolve. Dilute to volume with diluent – B and mix well. Diluted 5 ml of above solution to 100 ml with diluent – B. Further dilute 5ml of above solution to 25 ml with diluent – B. Preparation of Sample Solution Weigh and powder not less than 10 tablets. Accurately weigh transfer tablet powder equivalent to about 100 mg of valacyclovir in to a 100 ml V.F. Add about 2ml of diluent – A And sonicated. Add 60ml of diluent – B and sonicated for 30 min with intermittent shaking (maintain the sonicator temperature between 20 – 25 0 C). Dilute to volume with diluent - B and mix well. Filter the solution through 0.45-µ. Preparation of impurities Accurately weighed and transferred about 2.5 mg of impurities (A, B, C and P) into the 50ml of volumetric flask, add 10ml of diluent A, sonicated to dissolve. Dilute to volume with diluent B and mix well. Dilute 0.5ml of above solution to 25ml with 10ml of diluent A made up to volume with diluent B.. Preparation of mobile Phase A: Mix 3 ml of Tri Flouro acetic acid with 1000 ml of water. Adjust the pH of the solution to 4.0 with Triethyl Amine and degas. Preparation of mobile Phase B Mix 3 ml of Tri Flouro acetic acid with 1000 ml solvent mixture. (Degased mixture of Acetonitrile and Methanol the ratio of 50:50 v/v.) Diluent A: 2 % v/v of methanolic Hcl. Diluent B: Mixture of Trifloro acetic acid, Water and Methanol in the ratio of 3.800:200 v/v/ Gradient Programme: Separately injected equal volumes (20µl) of the blank, placebo preparation, standard preparation and sample preparation in to the chromatographic system. Table 1. Gradient Programme. Time (min) 0.01 20. Mobile phase – A (%V/V) 100 80. Mobile phase – B (%V/V) 0 20. 40 42. 20 100. 80 0. 55. 100. 0. www.ijpar.com.
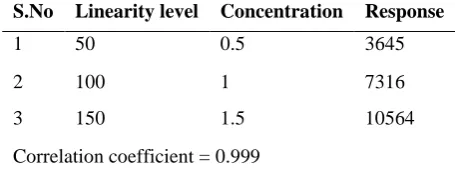
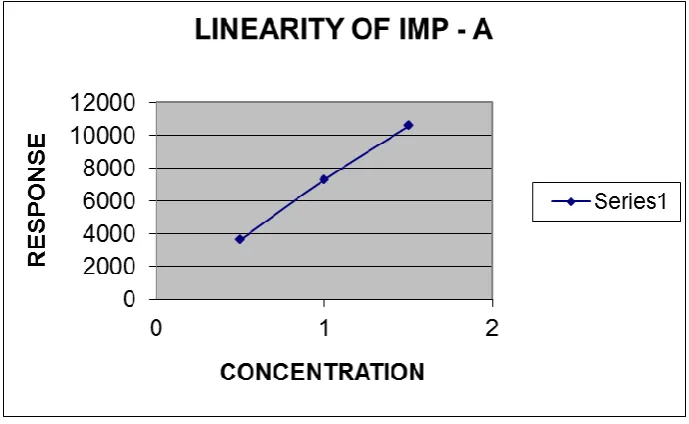
(3) 194 B.Bhagyalaxmi et al / Int. J. of Pharmacy and Analytical Research Vol-3(2) 2014 [192-201]. concentration and injected chromatographic system in duplicate.. Method Validation Specificity Diluent as blank solution was injected into chromatographic system and founded no interference.(6-8). Placebo preparation was prepared by taking the placebo equivalent to about the weight in portion of test preparation and injected in to the HPLC system. into. Accuracy Accuracy of the test method was carried out by spiking known amounts of impurities at three concentration levels to the placebo in the range of 50 – 150% of target concentration in triplicate.(911). Linearity Linearity was performed by preparing minimum levels of all impurities (A, B, C, P) and drug substances into the range of 50 – 150 % of target. RESULTS AND DISCUSSION % W/W Impurity – A present in Valacyclovir HCl: 7316. 50. 5. X 29424. 5. x. 100. x. 100. x. 100. 705.2. 93.6. x. 25. 284. 324.3. x. x. 500. 100. 100 =0.0520% 360.8. % W/W Impurity – B present in Valacyclovir HCl: 217463. 31. 50. 5. x 29424. 5. x. 100. X. 100 x 100. 705.2. x. 100. 25. 93.6. x 283.6. x 500. 324.3 x. 100. 100 =1.546% 360.8. %W/W Impurity – C present in Valacyclovir HCl: 20230. 50. 5. x 29424. 5. x 100. 100. x 100. 705.2. x 25. 93.6. x. x. 283.6. 500. 324.3 X. 100. 100 =0.143% 360.8. %W/W Impurity – P present in Valacyclovir HCl: 8844. 50 X. 29424. 5 X. 100. 5 X. 100. 100 X. 25. the. 705.2 X. 283.6. 93.6 X. 500. 324.3 X. 100. X 100. =0.062%. 360.8. Specificity Observation: No interference was observed. Acceptance criteria: Interference due to blank & placebo solution should not be more than 2.0% linearity: Linearity of impurity – A: Table 2. Linearity of impurity -A in Related substances method development S.No. Linearity level. Concentration. Response. 1. 50. 0.5. 3645. 2. 100. 1. 7316. 3. 150. 1.5. 10564. Correlation coefficient = 0.999. www.ijpar.com.
(4) 195 B.Bhagyalaxmi et al / Int. J. of Pharmacy and Analytical Research Vol-3(2) 2014 [192-201]. Graph -1 Linearity of impurity-A in Related substances method development. Linearity of impurity – B: Table No–3 -Linearity of impurity - B in Related substances method development. Sl.No. Linearity level. Concentration. Response. 1. 50. 0.5. 103532. 2. 100. 1. 217463. 3. 150. 1.5. 321095. Correlation coefficient =1.00 Graph No 2 -Linearity of impurity - B in Related substances method development. www.ijpar.com.
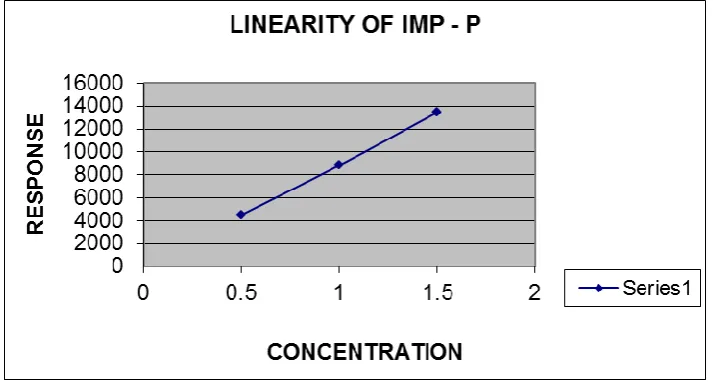
(5) 196 B.Bhagyalaxmi et al / Int. J. of Pharmacy and Analytical Research Vol-3(2) 2014 [192-201]. Linearity of impurity – C: Table No –4 - Linearity of impurity - C in Related substances method development S.No. Linearity level. Concentration. Response. 1. 50. 0.5. 12150. 2. 100. 1. 20230. 3. 150. 1.5. 33490. Correlation coefficient =0.99 Graph No –3 - Linearity of impurity - C in Related substances. RESPONSE. LINEARITY OF IMP - C 40000 35000 30000 25000 20000 15000 10000 5000 0. Series1. 0. 0.5. 1. 1.5. 2. CONCENTRATION Linearity of Impurity –P Table No– 5-Linearity of impurity-P in Related substances method development S.No Linearity level Concentration 1 50 0.5 2 100 1 3 150 1.5 Correlation coefficient =0.999. Response 4522 8844 13476. Graph No–4 -Linearity of impurity -P in Related substances method development. www.ijpar.com.
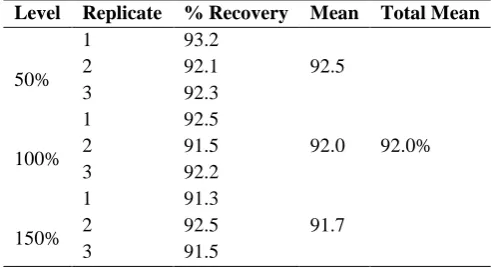
(6) 197 B.Bhagyalaxmi et al / Int. J. of Pharmacy and Analytical Research Vol-3(2) 2014 [192-201]. Accuracy: Accuracy of impurity – A Table No –6 - Accuracy of impurity - A in Related substances Level 50%. 100%. 150%. Replicate 1 2 3 1 2 3 1 2 3. % Recovery 90.1 90.5 91.3 92.3 93.2 91.5 92.7 93.2 91.8. Mean 90.6. Total Mean. 92.3. 91.8%. 92.5. Accuracy of impurity – B Table No –7- Accuracy of impurity- B in Related substances method development. Level 50%. 100%. 150%. Replicate 1 2 3 1 2 3 1 2 3. % Recovery 91.8 92.6 91.3 93.1 92.6 91.5 93.2 92.6 91.2. Mean 91.9. Total Mean. 92.4. 92.2%. 92.3. Accuracy of impurity – C Table No– 8-Accuracy of impurity-C in Related substances method development. Level 50%. 100%. 150%. Replicate 1 2 3 1 2 3 1 2 3. % Recovery 93.2 92.1 92.3 92.5 91.5 92.2 91.3 92.5 91.5. Mean. Total Mean. 92.5. 92.0. 91.7. www.ijpar.com. 92.0%.
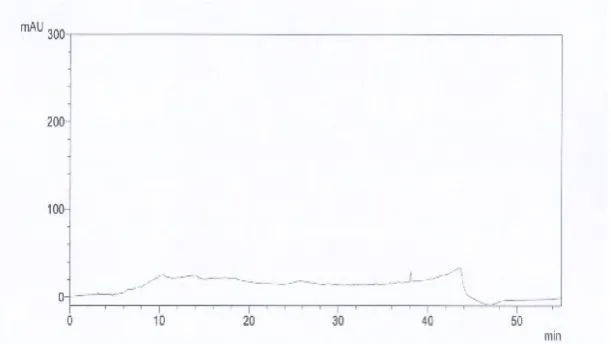
(7) 198 B.Bhagyalaxmi et al / Int. J. of Pharmacy and Analytical Research Vol-3(2) 2014 [192-201]. Accuracy of impurity – P Table No– 9-Accuracy of impurity-P in Related substances method development Level 50%. 100%. 150%. Replicate 1 2 3 1 2 3 1 2 3. % Recovery 92.5 91.3 92.5 91.3 92.5 93.1 91.6 91.5 91.3. Mean. Total Mean. 92.1. 92.3. 91.9%. 91.4. Acceptance criteria The % recovery should be between 80.0%-102.0 Fig.No –1 Chromatogram of standard in Related substances method development. Fig.No- 2– Chromatogram of blank in Related substances method development. www.ijpar.com.
(8) 199 B.Bhagyalaxmi et al / Int. J. of Pharmacy and Analytical Research Vol-3(2) 2014 [192-201]. Fig.No-3– Chromatogram of placebo in Related substances method development. Fig.No- 4–Chromatogram of impurity-A in Related substances method development. Fig.No -5 Chromatogram of impurity - B in Related substances method development. www.ijpar.com.
(9) 200 B.Bhagyalaxmi et al / Int. J. of Pharmacy and Analytical Research Vol-3(2) 2014 [192-201]. Fig.No-6– Chromatogram of impurity - C in Related substances method development. Fig.No- 7– Chromatogram of impurity - P in Related substances method development. Fig.No–8 Chromatogram of spiked sample in Related substances method development. The percent of impurity – A present in valacyclovir HCl is 0.0520 %, impurity B is 1.546 %, impurity. – C is 0.143 % and impurity – P is 0.062 % calculated . According to Pharma Europa 2006 the. www.ijpar.com.
(10) 201 B.Bhagyalaxmi et al / Int. J. of Pharmacy and Analytical Research Vol-3(2) 2014 [192-201]. percent of impurity present in valacyclovir HCl is within the limits. The result of specificity shows that there is no interference due to blank and placebo and it is not more than 2.0%.. Conclusion By taking into account of the factors such as economy and rapidity the present method can also be a good choice for the analysis of Valacyclovir Hcl. The developed method was found to be specific, precise, linear, accurate. LOQ values for .. all the known impurities were below reporting thresholds.. Acknowledgement We wish to express our sincere thanks to the Managements of Hetero drugs limited, Hyderabad, India for their support and encouragement. Cooperation from colleagues and of Research & Development and Analytical Research & Development of Hetero drugs limited, is appreciated. REFERENCES [1] Anonymous, 2006. Monograph, Valacyclovir hydrocloride, PHARMEUROPA Volume 18, No 2, April 2006, Directorate for the Quality of medicines of the council of Europe (EDQM), Printed in France by Aubin, Liguge, 309 – 314. [2] Taylor and Francis 2003. Abstract, Journal of liquid chromatography and Related Technologies, volume26, Number11/2003, 1755-1787. [3] Taylor and Francis 2005. Abstract, Journal of liquid chromatography and Related Technologies, volume 28, Number 5/2005,751-762. [4] Willard, H 1988. Injectors of HPLC, Instrumental methods of Analysis, 7 th Ed, Worth publishing co, 59 [5] Wang M.L. and Cona P, 2004. Journal of chromatography, vol 59, 251 – 254 [6] Satinder Ahuja 2005. Introduction, HPLC Method development, USP Dissolution testing, Hand book Pharmaceutical analysis By HPLC, Volume 6,1st Edn, Elsvier academic Press, pp. 1 – 9, 197 – 198,201 – 203, 209 – 210,336 – 380, 363 – 364. [7] Sharma, B.K.2006. Ultra violet and Visible Spectroscopy, principle, Instrumental methods of chemical analysis, 25th Ed, GOEL Publishing house, pp. S- 71 – 72, 82 – 86, 93. [8] Simpon, R.C 1987. Columns, J. chromatograph, No 400, pp. 297 [9] ICH: Q2A, Text on validation of analytical procedure (October 1994). [10] ICH: Q2B, Analytical Validation – Methodology (November 1996). [11] ICH Q2 (R1), Validation of Analytical Procedures Text and Methodology (November 2005). *******************************. www.ijpar.com.
(11)
Figure
+3
Related documents
The companies Berlin Partner GmbH and ZukunftsAgentur Branden- burg GmbH (Brandenburg Economic Development Board) support with a large range of services, from recruiting
• Taxpayers subject to the provisions of Title II of the Income Tax Law (ITL) which have declared taxable income of $644,599,005 or more in the immediately preceding tax
This model posits four types of health beliefs that affect an individual’s health behavior, in this case, the decision to seek mental health services: perceived
Most companies recruit for full-time and internship positions, but some indicate Co-Op as a recruiting priority, while not attending Professional Practice
In the previous sections, we dis- cuss the expectation that a neural network exploiting the fractional convolution should perform slightly worse than a pure binary (1-bit weights
Political Parties approved by CNE to stand in at least some constituencies PLD – Partido de Liberdade e Desenvolvimento – Party of Freedom and Development ECOLOGISTA – MT –
College Mathematics (3 Credits) Biology (6 Credits) Arts and Humanities 3 Arts and Humanities 3 TOTAL 35 20 8.00 **Total up RED # ** Excess credits 0.00 8.00 Analyzing and
