FINANCIAL PERFORMANCE ANALYSIS OF STATE OWNED AND PRIVATE ENTERPRISES IN PHARMACEUTICAL INDUSTY LISTED IN INDONESIA
STOCK EXCHANGE IN PERIOD YEAR 2012 - 2016
Ade Banani1
Faculty of Economics and Business, Universitas Jenderal Soedirman, Indonesia email: a.banani@yahoo.com
Indah Riyasari2
Faculty of Economics and Business, Universitas Jenderal Soedirman, Indonesia email: indahriya@gmail.com
Ekaningtyas Widiastuti3
Faculty of Economics and Business, Universitas Jenderal Soedirman, Indonesia email: eka.tyas@gmail.com
Received: January 14, 2019 Accepted: February 20, 2019 Published: April 04, 2019
To link to this article DOI: http://dx.doi.org/10.25170/jebi.v3i1.50
ABSTRACT
This study compares the financial performance between state owned and private enterprises in the pharmaceutical sub sector. The proxies for ratio analysis are current ratio, return on equity, debt equity ratio, and total asset turnover. By using independent sample t-test, the result shows that there was no significant difference between the financial performance of state owned and private enterprises on profitability ratio and activity ratio. Meanwhile, there was significant difference in the financial performance of state owned and private enterprises for liquidity ratio and leverage ratios. In addition, the result of the analysis illustrates that the performance of state owned enterprises were better than private enterprises in the pharmaceutical sub sector.
Keywords: Activity Ratio, Financial Performance, Leverage Ratio, Liquidity Ratio, Profitability Ratio
______________________ Published Online: April 2019
Online E-ISSN 2549-5860 | Print P-ISSN 2579-3128
Faculty of Economics and Business Atma Jaya Catholic University of Indonesia, 2019
2019 Published by Atma Jaya Catholic University. This is an open access article at www.jebi-atmajaya.com Peer-review under responsibility of the Team Editor Journal of Economics and Business
Journal Of Economics & Business
1. INTRODUCTION
Competition among companies is increasingly tighter when entering an era of free trade, because companies are expected to boost the competitiveness of companies in order to be better in managing its company to deal with this condition. Therefore, the company should be able to develop a business strategy so it can maintain it’s existence. Companies are required to be able to run their business effectively and efficiently in an economic condition that is growing very rapidly.
A manufacturing company is a company engaged in the processing industry that manages raw materials into semi-finished goods or finished goods. The manufacturing industry in Indonesia is divided into several sub sectors, such as chemical, pharmaceutical, electronic, food and drink, textile and garment, etc. The researchers in this study chose the sub sector of pharmaceutical as an object of research. A pharmaceutical company is a company that manufactures medicinal products related to health. Indonesia is one of the countries with the fastest growth in the pharmaceutical market in the world.
Pharmaceutical companies listed in Indonesia Stock Exchange (IDX) can be divided into state owned (BUMN) Badan Usaha Milik Negara and private enterprises (BUMS) Badan Usaha MIlik Swasta. Under the laws of the Republic of Indonesia number 19 in 2003, State-owned companies are business entities that all or most of the capital is State-owned by the state through its investment directly derived from the wealth of the countries already separated.
Private owned enterprises (BUMS), namely a business entity where the capital comes from private parties which are owned by a few people or a person. BUMS aims to develop business and capital as well as open jobs. The private-owned enterprises also have important roles that are not much different from the State-owned enterprises, namely to contribute in income funds in the form of taxes and help the Government in reducing unemployment.
Financial analysis that includes financial ratio analysis, analysis of the weaknesses and strengths in the field of financial will be helpful in assessing the achievements of the past and management in the future. Financial analysis can be known as the strengths and weaknesses that are owned by business enterprises.
A study conducted by Setiawan (2014) was a research that compares the financial performance of state owned and private enterprise in the telecommunication sector. This study suggested that the four variables: current ratio, debt to equity ratio, net profit margin and return on equity showed there was no difference in the financial performance between state owned (BUMN) and private enterprise (BUMS) listed on the Indonesia Stock Exchange period year 2009 - 2013.
Another study conducted by Auliannis (2014) who studied the financial performance comparison between state owned and private enterprise in the mining sector. The result of the research showed that only total asset turnover have no significant difference between state owned (BUMN) and private enterprise (BUMS) listed in Indonesia Stock Exchange.
Based on the explanation above, the researchers conducted research entitled “Financial Performance Analysis of State Owned Enterprises (BUMN) and Private Enterprises (BUMS) in Manufacturing Sector Listed in Indonesia Stock Exchange In The Period Year 2012 – 2016”.
2. LITERATURE REVIEW
2.1 Financial Performance
as reflected in the financial record and reports. The analyst attempts to measure the firm’s liquidity, profitability, and other indicators that the business is conducted in a rational and normal way; ensuring enough returns to the shareholders to maintain at least its market value (Pawar and Nayak, 2013). Financial performance is a general measurement of the organization`s overall financial health which can reflect the firm’s ability to generate new resources from day to day operations over a period of time (Boldeanu and Gheorghe, 2007).
2.2 Financial Statement
The principal financial statements of a corporation are the balance sheet, income statement, and statement of cash flow (Gibson, 2011:45). A company’s financial statements are an extremely important source of information about the business, the statements should indicate where the company is now, where it has been, and provide useful clues about where it is going. Without the kind of information provided by financial statements, it is almost impossible to evaluate a company (Schall and Haley,1991:558).
According to Dufera (2010), financial statements analysis is the process of critical evaluation of the financial information contained in the financial statements in order to understand and make decision regarding the operations of the firm. In general, the extent and depth of financial statement analysis is determined by user requirements; an analyst who is about to make a decision whether to invest in a firm is interested in its future performance. The technique involves the calculation of a number of ratio indicators which attempt to express the relationships which exist between key financial variables which appear principally in the published financial statements. The values for individual ratios are then compared with an appropriate standard to ascertain whether they are satisfactory or otherwise.
2.3 Financial Ratio Analysis
One of the tools in financial statement analysis is financial ratio analysis. As financial statements are usually lengthy, it will be more efficient and strategic to just pick up the figures that matter and plug them in pre-defined formulas developed through time by finance and accounting scholars (Tugas, 2012). The ratio analysis is an effective management tool for proper decision making that will improve your knowledge of financial results and trends over time. Ratio is used to relate one piece of financial data to another, as comparing ratio put two pieces of data on an equivalent base (Ranjan, 2016). According to Scott et al (1999:95) financial ratios help us identify some of the financial strengths and weaknesses of a company. The ratios give us two ways of making meaningful comparisons of a firm’s financial data: (1) examine the ratios across time to identify any trends: and (2) compare the firm’s ratios with those of other firms.
1. Liquidity Ratio
The liquidity of a firm is measured by its ability to satisfy its short-term obligations as they come due.
2. Profitability Ratio
Profitability ratios designate a company's overall efficiency and performance. It measures how the company uses its assets and control of its expenses to generate an acceptable rate of return.
3. Leverage Ratio
Leverage ratio is one of several financial measurements that look at how much capital comes in the form of debt (loans), to meet its financial obligations.
4. Activity Ratio
2.4 Hypothesis
H1 :There are differences in the liquidity ratio between state owned and private enterprises.
H2 :There are differences in the profitability ratio between state owned and private enterprises.
H3 :There are differences in the leverage ratio between state owned and private enterprises.
H4 :There are differences in the activity ratio between State Owned and Private Enterprises.
3. METHODS
This study used secondary data in which the population and sampling method are the financial statement of the companies and purposive sampling technique. The data in this study is a time series data set obtained from several publication by Indonesia Stock Exchange (IDX) and website of each company. The data were collected by conducting literature study and documentation.
3.1 Empirical Model
The data analysis techniques used in this study were the descriptive statistics and Independent Sample t-test. In order to support the test, this study also conducted the test on the normality using Kolmogrov-Smirnov. Homogeneity test to test the differences between the two groups, it is necessary to test the homogeneity of variance in advance, whether the variances are equal or unequal. Mann-Whitney Test, which is one of the non-parametric test, is a very strong test to test whether independens groups are derived from the sampe population.
The Independent Sample t-test formula is as follows :
T test for equal variance using pooled variance, formula is:
𝑡 = 𝑋̅ 1− 𝑋̅ 2
√(𝑛1− 1)𝑠12+ (𝑛2− 1)𝑠22
𝑛1+ 𝑛2− 2 (
1
𝑛1+
1 𝑛2)
T test for unequal variance using separated variance,
𝑡 = 𝑋̅ 1− 𝑋̅ 2
√𝑠12 𝑛1+𝑠2
2 𝑛2
Where :
𝑋̅ 1 = average of financial ratio
𝑠22 =variability of private owned enterprise
n = number of sample
4. RESULTS AND DISCUSSION
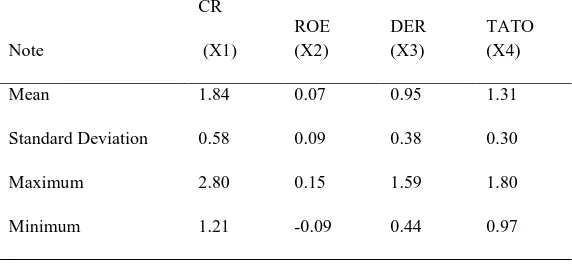
4.1 Descriptive Statistics
Based on Table 1, it shows that only in return on equity that there is great fluctuation in state owned enterprises, because the standard deviation is bigger than the value of mean.
Based on Table 2, it shows that there is no great fluctuation in private enterprises, because the standard deviation is smaller than the value of mean.
4.2 Normality Test
Based on Table 3, it shows that the probability value > 0.05. It concludes that the data has been normal distributed.
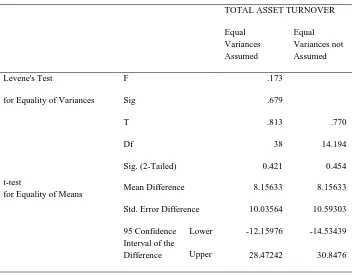
4.3 Independent Sample t-test
The result in homogeneity test indicate that the liquidity and leverage ratio used the equal variance not assumed because 𝐹𝐶𝑜𝑢𝑛𝑡>𝐹𝑇𝑎𝑏𝑙𝑒, and the profitability and activity ratio used equal variance assumed because 𝐹𝐶𝑜𝑢𝑛𝑡<𝐹𝑇𝑎𝑏𝑙𝑒.
The result of Independent sample t-test shows that there is significant differences in liquidity and leverage ratio, because the probability < 0.05, 0.000 and 0.001. Meanwhile in profitability and activity ratio there is no significant differences, because probability > 0.05, 0195 and 0.454.
5. CONCLUSION
Based on the result of the analysis in this research, it can be concluded that :
1. Financial performance of state owned and private enterprises in terms of liquidity ratio during period year 2012 - 2016 was significantly different. Based on the result of analysis the value of mean current ratio of private enterprises was 396%, which is greater than state owned enterprises was 184 %, It shows that the private enterprises more liquid than state owned enterprises.
2. Financial performance of state owned and private enterprises in terms of profitability ratio during period year 2012 - 2016 has no significant differences. Based on the result of the analysis, the value of mean of private enterprises 22% is greater than state owned enterprises 7%, it means that the private enterprises are more effective and efficient than state owned enterprises in the use of company’s equity to generate revenue.
3. Financial performance of state owned and private enterprises in terms of leverage ratio during period year 2012-2016 was significantly different. Based on the result of analysis, state owned enterprises show that the value of mean of 95% is greater than private enterprises which was 35%. This means that the private enterprises is better at paying their long term obligations.
total asset turnover during five years is under 150%. The result analysis shows that state owned enterprises are more efficient in optimizing assets to generate revenue compared with private enterprises, because the value of mean of state owned enterprises 131% is greater than private enterprises 123%.
5.1 Limitation
The study was limited by only using four independent variables which are liquidity ratio with current ratio as a proxy, profitability ratio with return on equity as a proxy, leverage ratio with debt equity ratio as a proxy, and activity ratio with total asset turnover as a proxy, so this financial performance analysis of the companies are only one aspect. For further researchers may add other proxies such as cash ratio for liquidity ratio, return on assets for profitability, net profit margin to leverage ratio, and inventory turnover for activity ratio. In addition, in helping comparison analysis, the researchers are able to optimize an analysis and comparison of financial performance much more in depth about the condition of the company or use the other methods of analysis of financial performance, such as EVA and MVA, so as to provide a different alternative in comparing financial performance between state owned enterprises and private enterprises. Moreover, researchers can add to the research period and samples of the company with a balanced amount in same sector.
REFERENCES
Auliannisa Nadia. 2014 .Comparative Analysis of Financial Performance pf State Owned Enteprises (BUMN) and Private Owned Enterprises (BUMS) in Mining Sectors Listed on The Indonesia Stock Exchange. (Thesis). Universitas Jenderal Soedirman. Purwokerto.
Bhunia Amalendu, Mukhuti Somnath Sri, and Roy Gautam Sri. 2011. Financial performance Analysis- A Case Study. Journal of Social Sciences, 3(3). ISSN : 2041-3246
Boldeanu, D.M. and Gheorghe, M.M. 2007. Performance Indicators in Multidimensional Analysis. Journal of Accounting and Management Information Systems, Supplement/2007, pg, pp.733-747.
Dufera Abdi. 2010. Financial Performance Evaluation ( A case Study of Awash International BANK (AIB)). Mekelle University
Gibson Charles H. 2011. Financial Statement Analysis. 12nd edition. Canada. South-Western Cengange Learning.
Ranjan, Weerakoon. 2016 .The Financial Performance Analysis of Nike Inc : with Special Reference Year 2015 Annual Report. Europian Journal of Business and Management. Vol 8,No 18.
Schall Lawrwnce D,and Haley Charles W. 1991. Introduction to Financial Management. 6th edition. Singapore: McGraw-Hill,Inc.
Scott. F David et al. 1999. Basic Financial Management. 8th edition. Prentice Hall,Inc:United States of America
Setiawan Heri. 2014. Perbandingan kinerja Keuangan Perusahaan Telekomunikasi Milik Pemerintah (BUMN) dan Milik Swasta yang Terdaftar di Bursa Efek Indonesia. Jurnal Ekonomi dan Bisnis (JENIUS). Vol 4 No 3
Tugas. C Florenz. 2012. A Comparative Analysis of the Financial Ratios of Listed Firms Belonging to the Education Subsector in the Philippines for the Years 200-20115. International Journal of Business and Social Science. Vol 3 No 21.
APPENDIX
List of Tables
Table 1: Descriptive Statistic of State Owned Enterprises
Note
CR
(X1)
ROE (X2)
DER (X3)
TATO (X4)
Mean 1.84 0.07 0.95 1.31
Standard Deviation 0.58 0.09 0.38 0.30
Maximum 2.80 0.15 1.59 1.80
Minimum 1.21 -0.09 0.44 0.97
Table 2: Descriptive Statistic of Private enterprises
Note
CR
(X1)
ROE (X2)
DER (X3)
TATO (X4)
Mean 3.96 0.22 0.35 1.23
Standard Deviation 2.16 0.15 0.16 0.27
Maximum 10.25 0.49 0.78 1.71
Table 3: Normality Test of State Owned and Private Enterprises
One-Sample Kolmogorov-Smirnov Test
N
Normal
Parameters Most Extreme Differences
Mean Std. Deviati on Absolut e Positi ve Negativ e Kolo mgrov -Smirn ov Z Asymp. Sig. (2-tailed) CR
BUMN 10
183.96
5 57.849 0.223 0.223 -0.139 0.705 0.703
BUMS 30
396.42
8 215.746 0.236 0.236 -0.130 1.294 0.070 ROE
BUMN 10 6.702 8.512 0.247 0.163 -0.247 0.781 0.576
BUMS 30 21.590 14.734 0.210 0.210 -0.130 1.152 0.141
DER
BUMN 10 95.309 37.643 0.130 0.130 -0.087 0.410 0.996
BUMS 30 35.200 16.433 0.138 0.138 -0.118 0.754 0.620
TAT
O BUMN 10
131.15
0 29.725 0.169 0.169 -0.134 0.534 0.938
BUMS 30
122.99
4 26.750 0.186 0.120 -0.186 1.019 0.250
Table 4: Result Independent Sample T-test for Current Ratio
CURRENT RATIO Equal Variances Assumed Equal Variances not Assumed
Levene's Test F 3.986
for Equality of Variances Sig 0.053
t-test
for Equality of Means
T -3.053 -4.892
Df 38 37.272
Sig. (2-Tailed) .004 .000
Mean Difference -212.4626 -212.4626
Std. Error Difference 69.5843 43.43033
95 Confidence Interval of the Difference
Lower -353.32866 -71.59654
Table 5: Independent Sample T-test for Return On Equity
RETURN ON EQUITY
Equal Variances Assumed
Equal Variances not Assumed
Levene's Test F 1.692
for Equality of Variances Sig 0.21
t-test
for Equality of Means
T -1.321 -2.276
Df 38 30.751
Sig. (2-Tailed) .195 .03
Mean Difference -22.407 -22.407
Std. Error Difference 16.967 9.846
95 Confidence Interval of the Difference
Lower -56.757 -42.496
Upper 11.942 -2.317
Table 6: Independent Sample T-test for Debt Equity Ratio
DEBT EQUITY RATIO
Equal Variances Assumed
Equal Variances not Assumed
Levene's Test F 15.732
for Equality of Variances Sig .000
t-test
for Equality of Means
T 7.073 4.896
Df 38 10.167
Sig. (2-Tailed) .000 .001
Mean Difference 60.10900 60.10900
Std. Error Difference 8.48947 12.27592
95 Confidence Interval of the Difference
Lower 42.90476 32.81734
Table 7: Independent Sample T-test for Total Asset Turnover
TOTAL ASSET TURNOVER
Equal Variances Assumed
Equal Variances not Assumed
Levene's Test F .173
for Equality of Variances Sig .679
t-test
for Equality of Means
T .813 .770
Df 38 14.194
Sig. (2-Tailed) 0.421 0.454
Mean Difference 8.15633 8.15633
Std. Error Difference 10.03564 10.59303
95 Confidence Interval of the Difference
Lower -12.15976 -14.53439