EXPERIMENTAL MODELS AND INSTRUMENTAL SURVEYS
FOR RISK ASSESSMENT IN HYGIENE AND EPIDEMIOLOGY
UDC 637.2.07: 543.423.1
DOI: 10.21668/health.risk/2017.2.14.eng
WORKING OUT PROCEDURES FOR ANALYZING TOXIC ELEMENTS CONTENT IN OIL PRODUCTS AND OIL RAW MATERIALS USING ATOMIC-EMISSION SPECTROMETRY WITH INDUCTIVE-BOUND PLASMA TO ASSESS
PRODUCTS SAFETY
L.S. Ivashkevich, T.V. Kovshova, O.N. Vashkova, Yu.N. Velentei
Scientific-practical Hygiene Center, 8 Akademicheskaya Str., Minsk, 220012, Republic of Belarus
Our goal was to work out a procedure aimed at determining low concentrations of toxic elements in oil products using atomic-emission spectrometry to assess products safety.
We performed a comparative examination of various mineralization techniques, studied extraction condi-tions impacts, as well as autoclave and microwave mineralization impacts on the results of toxic elements deter-mination in oil raw materials and oil products. We detected that complete mineralization enabled achieving the least results inaccuracy in comparison with acid extraction.
We developed parameters for atomic-emission analysis of determining Fe, Cu, Ni, Pb, and Cd, in oil raw ma-terials and oil products. We defined a wave length for each element and background correction; we also deter-mined a device parameters (generator power, sample feeding speed, spraying speed), chose a cleft width and an analysis regime for data calculation.
Basing on the conducted research we created a high-precision procedure for determining low concentra-tions of such toxic elements, as Pb, Cd, As, Hg, Cu, Fe, and Ni, with atomic-emission spectrometry technique. Standard deviation in the procedure repeatability amounts to 1.4–4.3 %. Standard deviation in the procedure reproducibility amounts to 10.1–11.8 %. maximum expanded uncertainty in measuring concentrations of Cd, Pb, and As, amounts to 30.6 %; Hg, 23 %; Cu, Fe, ands Ni, 21 %; Pb, 33 %.
Application of the created procedure will help to enhance control over quality and safety of food products and to lower alimentary morbidity.
Key words: toxic elements, atomic-emission spectrometry, oil raw materials, oil products, sample prepara-tion, precision, food products safety.
Emissions from industrial enterprises and city transport contaminate the environment and as a result toxic elements penetrate food
products. Toxic elements can also get into food products during production processes or if storage conditions are unsafe. When they
__________________________
Ivashkevich L.S., Kovshova T.V., Vashkova O.N., Velentei Yu.N., 2017
Liudmila St. Ivashkevich – Candidate of Technical Sciences, Head of chromatographic research laboratory; analysis of food chemical structure, spectrometer research (e-mail: [email protected]; tel.: +375 17 284-08-67).
Tatiana V. Kovshova – scientific officer at chromatographic research laboratory; analysis of food chemi-cal structure (e-mail: [email protected]; tel.: +375 17 284-08-67).
Olga N. Vashkova – scientific officer at chromatographic research laboratory; analysis of food chemi-cal structure (e-mail: [email protected]; tel.: +375 17 284-08-67).
enter a human body in excessive quantities it exerts negative impacts on the immune sys-tem; it can also cause substantial metabolic and functional disorders.
According to the Customs Union's Tech-nical Regulations No. 021/2011 "On food products safety", four most widely spread and most dangerous toxicants, namely Pb, As, Cd, and Hg, are determined in all kinds of food raw materials and food products, including oil and fat ones. Apart from these four elements, Cu and Fe contents in vegetable oils, spreads, and rendered animal fats, are to conform to fixed standards as these elements influence oxidative processes activation. Ni contents are standardized in products which are the result of vegetable oil and animal fats processing (margarines, cooking fats, and mayonnaise) as Ni is a part of a catalyst used in products hy-drogenation.
Food safety assessment includes control over toxic elements contents. Occurrence of such elements as Pb, As, Cd, Hg, Fe, and Cu, in oil products and oil raw materials is always analyzed; these elements can get into finished products either from raw materials or during production processes. Colorimetric, polaro-graphic, or spectrometric techniques are used to perform such analysis [1, 6, 7].
Atomic-emission spectrometry has a number of advantages over other techniques as it has low detection limits, and calibrating graphs linearity within a wide range of con-centrations, and it allows to simultaneously determine a great number of elements.
Samples preparation has a great influence on the validity of the obtained results. Tech-niques applied in oil products samples prepara-tion can be divided into two groups: acid ex-traction and complete mineralization. Nowa-days there are several regulations which fix standards for oil products analysis and which envisage complete mineralization of samples; they are ISO 8294: 1994, ISO 15774: 2000, ISO 12193: 2004, ISO 10540-2: 2003. And there is a standard which fixes acid extraction, namely State Standard 26929-94. Literature sources [8, 11–14] state that results of mineral elements content examination in food products differ
depending on a sample preparation technique. This difference is determined both by a chemi-cal element essence, and its quantitative con-tents in food products.
Our research goal was to create a proce-dure for determining low concentrations of tox-ic elements in oil products using atomtox-ic- atomic-emission spectrometry with inductively bound plasma to assess food products safety.
To achieve the stated goal, we solved a number of tasks; we worked out atomic-emission analysis parameters and created sam-ples preparation conditions for toxic elements analysis.
Data and methods. Our research objects were samples of refined and unrefined flower-seed oil, margarine, mayonnaise, sun-flower seeds, poppy seeds, and fish oil.
Food products samples which were used in comparative examination of various miner-alization techniques didn't contain any addi-tives.
Native oil raw materials and oil products, and also products with known introduced toxic elements content were used as examination samples for metrological research. Toxic ele-ments were introduced in quantities corre-sponding to their maximum permissible con-centrations in food products. CONOSTAN oil standards (the USA) with the known toxic el-ements contents were used for sunflower-seed oil; standard Pb, Cd, As, Hg, Cu, Ni, and Fe solutions were used for other samples.
We used concentrated nitric acid (67%, «for trace analysis» class, Fluka), hydrogen peroxide (36%, puriss.), hydrochloric acid (36 %, puriss.), deionized water, which was re-ceived with the use of Direct-Q3 water deionizer (Millipore Corporation, the USA), and standard samples of Pb, Cd, As, Hg, Cu, Ni, and Fe so-lutions in our work.
Acid extraction techniques and complete mineralization techniques were applied in sam-ples preparation.
Results and discussion. Oil products mineralization techniques can be divided into two groups, namely acid extraction and com-plete mineralization; the latter means samples decomposition in mineral acids when analyti-cal autoclaves are applied under thermal treatment or microwave radiation.
Extraction samples preparation has an advantage as it allows to obtained mineralized samples with high analyte content taking a substantial sample weight into account; it is also not necessary to use specialized equip-ment for mineralization.
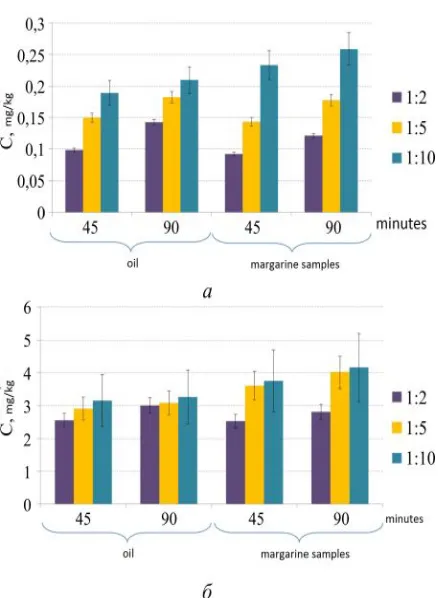
We changed extraction time and solid and liquid phase ratio to study influence ex-erted by acid extraction conditions on the analysis results. Extraction was performed in a heatproof flask containing a sample, boiling centers and hydrochloric acid solution diluted 1:1 in volume. The flask content was boiled for 45 or 90 minutes. We applied the follow-ing ratios of a sample and acid-extractive mixture: 20 g and 40 ml (1:2); 8 g and 40 ml (1:5); 4 g and 40 ml (1:10).
As we can see in Figure 1, decrease in a ratio of a sample to an extracting agent volume leads to increase in extracted elements quanti-ty. It becomes most apparent when Cu is ex-tracted. Extracted Cu quantity varies 1.5-2.6 times depending on an examined sample and "sample - extracting agent" ratio. Fe quantity varies not so greatly, 1.1-1.5 times.
Increase in extraction time from 45 to 90 minutes also results in growing quantity of an element extracted out of a sample. Cu quantity grows by 10-40%; Fe quantity, by about 10%.
So, the obtained data allow us to conclude that decrease in a ratio of a sample weight to a sample volume and increase in extraction time leads to growth in the quantity of elements ex-tracted out of a sample. We should note that de-crease in a ratio of a sample weight to an extract-ing agent volume also results in greater errors in measurement. Maximum error for ratio 1:2 amounts to 3% for Cu and 8% for Fe; it is equal to 10 and 25% correspondingly when ratio is 1:10.
The performed examinations enables de-termining the most suitable conditions of ex-traction sample preparation which allow to
Figure 1. Influence exerted by acid extraction conditions
on the results of determining Cu (а) and Fe (б) in oil and margarine samples
extract maximum quantity of elements; these conditions include sample weight being equal to 4 g and acid extraction ratio being 1:10; op-timal extraction time is 1.5 hours.
Acid extraction can be applied only when treating vegetable oil, butter, food fats, and margarine. Besides, this sample preparation technique is not suitable for determining high-ly volatile elements, notabhigh-ly, Hg.
Complete decomposition performed in closed vessels allows to avoid possible losses of highly volatile elements.
autoclave sample preparation we applied two mineralization regimes with different time and temperature. The first regime which was a longer one was accomplished in three stages with a gradient reaction mixture temperature rise during 30 minutes and heating under a cer-tain temperature: 160 °С for 1 hour, 180 °С for 1 hour, 200 °С for 2 hours. The second regime had two stages: 160 °С for 1 hour, 180 °С for 2 hours. The research revealed that mineralization regime had no influence on the results of mineral elements (Cu and Fe) determination in sunflow-er-seed oil. Difference between the results amounted to only 1-3%.
We performed microwave mineralization of oil products samples applying a multi-stage pro-gram under controlled growing pressure and temperature conditions for each product type. Microwave sample preparation examination en-abled determining the most efficient microwave mineralization regime for all oil products sam-ples.
We compared various mineralization tech-niques, including autoclave and microwave one, as well as acid extraction. When acid extraction was performed, we applied conditions which allowed to obtain the maximum quantities of extracted elements. We applied the following program for microwave decomposition: control over the process as per pressure, control pressure value P was equal to 160 psi (1,103 MPa), de-composition time was 25 minutes. Autoclave mineralization process included two stages: 160 °С for 1 hour, 180 °С for 2 hours.
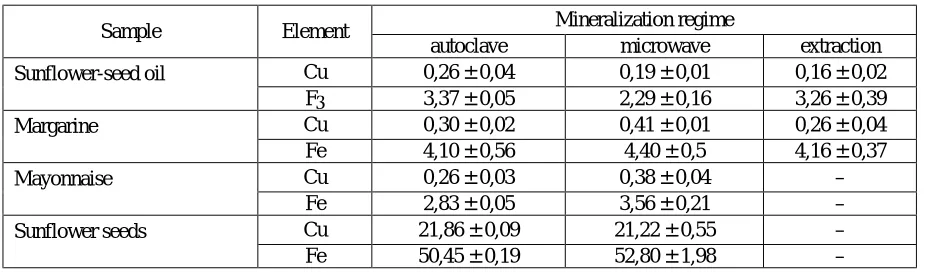
Table 1 summarizes the comparative characteristics of influence exerted by various mineralization techniques on the results of de-termining Cu and Fe in oil products. Data comparison reveals that the created minerali-zation parameters allowed to obtain identical information on Fe quantity both at complete and incomplete samples mineralization. Cu content determined in the samples after extrac-tion varies from 62 to 87% of the content ob-tained after complete mineralization. It can be related to low Cu concentrations in oil prod-ucts, much lower than Fe concentrations; or it can be related to peculiarities which extraction of this element has.
In relation to that we considered a possi-bility to apply autoclave sample preparation or preparation in a microwave mineralizer to per-form atomic-emission analysis of toxic ele-ments.
The greatest sample volume was used in complete mineralization and it led to relatively low concentrations of an analyzed element in a mineralized solution. This problem can be solved either via mineralizing agent concen-trating, or via application of analysis tech-niques and devices with low detection limits.
Choice of a wave length, sample feeding speed, spraying speed, data acquisition regime, as well as application of an ultra-sound sprayer instead of a pneumatic one allow to obtain a considerable growth in elements detection sen-sitivity.
T a b l e 1
Cu and Fe content in oil products after different sample preparation techniques, mg/kg
Sample Element Mineralization regime
autoclave microwave extraction
Sunflower-seed oil Cu 0,26 ± 0,04 0,19 ± 0,01 0,16 ± 0,02
Fе 3,37 ± 0,05 2,29 ± 0,16 3,26 ± 0,39
Margarine Cu 0,30 ± 0,02 0,41 ± 0,01 0,26 ± 0,04
Fe 4,10 ± 0,56 4,40 ± 0,5 4,16 ± 0,37
Mayonnaise Cu 0,26 ± 0,03 0,38 ± 0,04 –
Fe 2,83 ± 0,05 3,56 ± 0,21 –
Sunflower seeds Cu 21,86 ± 0,09 21,22 ± 0,55 –
To obtain lower detection limits of an atomic-emission spectrometer, we used the fol-lowing device parameters:
– generator capacity was 1000 – 1100 Wt; – plasma gas flow rate was 12 l/min; – gas flow rate in a sheath was 0.2 l/min; – assist gas rate was 0 l/min;
– sprayer was 0.8 l/min at 2.8 bar;
– sample feeding speed, l/min, was 0.84 l/min;
– photomultiplier amplification was 100. Measurements were performed at the fol-lowing wave lengths, nm: Pb – 220.353; As – 193,.695; Сd – 228.802; Hg – 194.163; Cu – 324.754; Fe – 259.940; Ni – 221.647.
As a rule, detection limits for mineralized samples are much higher than for water solu-tions which is related to a matrix influence ex-erted by a mineralizing agent [4, 5]. Basic noises occur in plasma [9]. Changes occurring in a spraying system or a sample feeding sys-tem also contribute considerably into matrix noises. When acid concentrations or dissolved substance contents vary it leads to changes in spraying efficiency and, consequently, to changes in sensitivity. It is noted in the paper [8] that perchloric acid or hydrochloric acid are the best analytical media for atomic-emission measuring. However, food products mineralization or biological substrates miner-alization is usually performed with nitric acid with its final concentration in a mineralized solution being equal to 25–30 %. It is also stat-ed in the paper, that growth in nitric acid con-centration to 30% results in 30% decrease in Mg and Al emission signal intensity in compar-ison with 5%-concentrated nitric acid.
We determined detection limits for each ex-amined elements via its tenfold measuring in the control solution.
A conventional way to introduce a solution into inductively bound plasma is to apply a pneumatic sprayer. An ultra-sound sprayer allows to obtain significantly lower detection limits for a spectrometer. A liquid sample is pumped into a piezoelectric detector where it is transformed into a dense thick spray. Gas flow in a sprayer takes this spray through a heating tube where evapora-tion takes place and the liquid is further con-densed with a thermoelectric cooler and is taken
out via drainage. As a result, a dry highly concen-trated spray is in a sprayer and it is sprayed in plasma. It allows to get 5-10 times better elements detection limits.
Detection limits for Pb and As were ob-tained with the use of an ultrasound sprayer; for Cu, Fe, Ni, and Cd, with a pneumatic sprayer.
Table 2 contains data on an approximate content of Pb, As, Cu, Cd, Fe, Ni, and Hg, in solutions after complete mineralization of samples containing toxic elements at the level set forth in the regulations, at a device detec-tion level, and the obtained elements detecdetec-tion limits.
As we can see from Table 2, detection limits obtained under real life conditions differ from those declared by a manufacturer. Spectral and matrix influences which occurred when samples with a complicated structure were analyzed led to substantial rise of determined contents bottom boundary and made it more difficult to determine elements correctly in complex biological samples. Difference for Cu amounted to 2.45; for As and Cd, to 4.6-4.8. The greatest discrepancy between the measured detection limit and a declared one was revealed for Pb, and it makes it obvious that a device parameters need to be adjusted in case one performs separate measuring of this element.
If we compare device detection limits with a pneumatic sprayer for Hg and permissible Hg content in a solution (Table 2), we can see that to it is necessary to apply hydride generation to de-tect this element.
The technique is based on Hg recovery with Na borohydride as per reaction scheme
Hg2+ + BH4- + H+ → B2H6 + H2 + Hg. B2H6 is then hydrolyzed into boric acid. Research on influence exerted by differ-ent acids on efficiency of determining hydride-forming elements revealed that 2M hydrochlo-ric acid solution was the most suitable medium for Hg detecting [2, 3, 15].
T a b l e 2 Toxic elements content in a mineralized solution after acid extraction and detection limits
Element Content in a mineralized solution*, µg/dm3
Device detection limit, µg/dm3
Detection limit, µg/dm3
Sprayer Hydride
add-on de-vice pneumatic ultrasound
Pb 4 – 40 1,5 0,2 – 1,91
As 4–40 1,5 0,2 0,2 0,92
Cu 4–16 0,2 0,05 – 0,49
Cd 1–20 0,15 0,02 – 0,72
Fe 60–200 0,2 0,05 – 5,11
Ni 28 0,3 0,06 – 1,78
Hg 0,1–12 0,4 – 0,03 –
Note: * sample weight is equal to 1 g and a mineralizing agent volume is equal to 25 ml.
We used 0.6% borohydride solution in 0.05 М NaOH as a borohydride solution.
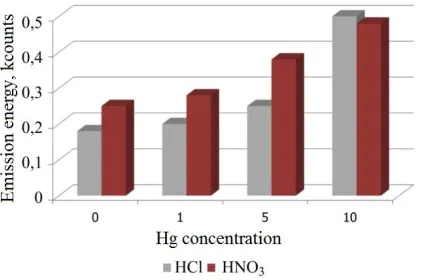
Figure 2 shows dependence between en-ergy emission (signal intensity) and Hg con-tent in standard samples in 3н HCl and 3н HNO3 medium. As we can see from Figure 2, Hg emission energy value in nitric acid solu-tion is insignificantly higher than emission of this element in hydrochloric acid solution and it proves that it is quite possible to use nitric acid solutions directly for introducing into a hydride add-on device.
Figure 2. Emission energy dependence on Hg content in standard samples
in 3н HCl and 3 н HNO3 medium
Precision and correctness parameters were determined during metrological certification of the technique. Precision parameters
(repeata-bility and laboratory reproduci(repeata-bility) were de-termined in conformity with STB ISO 5725-2, cl. 7. To assess correctness parameter, we used the results of checking significance of discrepan-cy from recovery rate unit (STB ISO 5725-4, cl. 4). Recovery rate for toxic elements as per this technique was studied in laboratories under re-peatability conditions via analyzing samples with the known toxic elements admixture.
Metrologic calculations revealed that stand-ard deviation in the repeatability for the exam-ined toxic elements with the use of the created conditions amounts to 1-8%; standard deviation in the reproducibility for these elements lies within 2-22% range.
We detected dependence of maximum ex-tended uncertainty (U) on concentrations of toxic elements in oil raw materials and oil products.
Maximum extended uncertainty within the range of the measured Pb, Cd, Hg, Cu, Fe, and Ni concentrations in oil raw materials and oil products is within 4-15%; it amounts to 33% in case of Pb.
References
1. Amelin V.G., Lavrukhina O.I. Obespechenie bezopasnosti pishchevykh produktov sredstvami khimicheskogo analiza [Providing food products safety by chemical analysis techniques]. Zhurnal analit-icheskoi khimii, 2017, no. 1, pp. 3–49 (in Russian).
2. Gladyshev V.P. Analiticheskaya khimiya rtuti [Analytical chemistry of copper]. Moscow, Nauka Publ., 1974, 528 p. (in Russian).
3. Lakota V.N., Makarevich V.I., Arkhutik S.S. Opredelenie mysh'yaka, rtuti i selena metodom atomno-emissionnoi spektrometrii s induktivno-svyazannoi plazmoi [Determining arsenic, mercury, and selenium via atomic emission spectrometry with inductively bound plasma]. Zhurnal analiticheskoi khimii, 1999, vol. 54, no. 3, pp. 285–287 (in Russian).
4. Osipov K.B., Seregina I.F., Bol'shov M.A. Ustranenie matrichnykh nespektral'nykh pomekh pri elementnom analize biologicheskikh zhidkostei na kvadrupol'nom mass-spektrometre s induktivno-svyazannoi plazmoi [Elimination of matrix non-spectral interferences in elemental analysis of biological fluids using inductively coupled plasma quadrupole mass spectrometer]. Analitika i kontrol', 2014, vol. 18, no. 2, pp. 150–163 (in Russian).
5. Tsygankova A.R., Makashova G.V., Shelpakova I.R. Zavisimost' intensivnosti spektral'nykh linii elementov ot moshchnosti ISP-plazmy i raskhoda argona [Dependence of elements' spectral lines intensity on inductively bound plasma capacity and argon flow]. Metody i ob"ekty khimicheskogo analiza, 2012, vol. 7, no. 3, pp. 138–142 (in Russian).
6. Acar O. Evaluation of cadmium, lead, copper, iron and zinc in Turkish dietary vegetable oils and olives using electrothermal and flame atomic absorption spectrometry // Grasas y Aceites. 2012. vol 63, no. 4, pp. 383–393.
7. Taylor A., [et.al.]. Atomic spectrometry update: review of advances in the analysis of clinical and biological materials, foods and beverages. JAAS: Journal of Analytical Atomic Spectrometry, 2016, vol 31, no. 3, pp. 554–596.
8. Chan G.C-Y., Hieftje G.M. Fundamental characteristics of plasma-related matrix-effect cross-over points in inductively coupled plasma-atomic emission spertrometry. J. Anal. At. Spectrom, 2009, vol. 24, pp. 439–450.
9. Todolí J.L., [et.al.]. Elemental matrix effects in ICP-AES. J. Anal. At. Spectrom. 2002, vol. 17, pp. 142–169.
10.Fuh Сhwan-bor, Lin Huei-Ia, Tsai Hweiyan. Determination of Lead, Cadmium, Chromium, and Arsenic in 13 Herbs of Tocolysis Formulation Using Atomic Absorption Spectrometry. Journal of Food and Drug Analysis, 2003, vol. 11, no. 1, pp. 39–45.
11.García-Rey R.M., R. Quiles-Zafra, Luque de Castro M.D. New methods for acceleration of meat sample preparation prior to determination of the metal content by atomic absorption spectrometry. Anal. Bioanal. Chem, 2003, no. 377, pp. 316–321.
12.Ivanenko N.V. Biomonitoring of 20 trace elements in blood and urine of occupationally ex-posed works by sector field inductively coupled plasma mass spectrometry. Talanta, 2013, vol. 116, pp. 764–769.
13.Juranovic I., Breinhoelder P., Steffan I. Determination of trace elements in pumpkin seed oils and pumpkin seeds by ICP-AES. Anal. At. Spectrom, 2003, vol. 18, pp. 54–58.
14.Tasan M., Umit G., Demirci M. Effects of storage and industrial oilseed extraction methods on the quality and stability characteristics of crude sunflower oil. Grasas y aceites, 2011, vol. 62, no. 4, pp. 389–398.
15.Thompson Р., Walton S.J. Simultaneous determination of trаce Concentrations of Arsenic, An-timony, Bismuth, selenium and tellurium in aqueous solution by introduction of the gaseous hydrides into an inductively coupled plasma source for emission spectrometry. Analyst, 1978, vol. 103, pp. 568– 579.