Employment Dynamics
Jessica Helfand, Akbar Sadeghi, and
David Talan
Employment dynamics: small and large
firms over the business cycle
The use of the dynamic-sizing approach to measuring
employment growth by size of firm provides information useful
in the debate on small firm versus large firm job creation
Jessica Helfand, Akbar Sadeghi, and David Talan are economists in the Office of Employ-ment and Unemploy-ment Statistics, Bureau of Labor Statistics. E-mail:
[email protected] [email protected] [email protected]
W
ho creates the most jobs: small businesses or large businesses? This subject has been widely dis-cussed among economists and researchers and is often a topic of political debates citing the important role of small businesses in creating jobs. The small-firm versus large-firm issue is twofold: do small firms create most of the new jobs, or is the share of small firms’ net job gains greater than their base share of employ- ment? Economists argue that the answer de-pends on which methodology is used.1 Newstatistics from the Business Employment Dynamics (BED) program of the U.S. Bureau of Labor Statistics (BLS) provide data with which to analyze many of the size class meth- odological issues, and are a valuable data re-source with which to answer these questions. In September 2003, the BLS began pub-lishing the quarterly BED data series. Since the initial release of the data, the BLS devel-oped two additions: the BED statistics by in- dustry (published in May 2004) and statis-tics by firm size class (published in December 2005). These new series provide much need-ed quarterly data with which to observe and understand the dynamics of the job market. When the quarterly net employment change is decomposed into gross job gains and gross job losses, and when gross job gains are fur- ther divided into business openings and ex-pansions and gross job losses into business
closings and contractions, the resulting busi- ness employment statistics reveal the under-lying dynamics of the job market.
The latest publication of BED data by firm size was a challenge for the BLS. Initial re- search showed that the specific methodolo-gy used to measure employment changes by size class from a longitudinal database is im- portant because alternative methods gener-ate sharply different results.2 The evaluation
of alternative methods led to the selection of “dynamic sizing” as the Bureau’s employ- ment sizing method. Dynamic or momen-tary sizing, as suggested by Per Davidsson, is based on the allocation of a firm’s employ-ment gain or loss during a quarter to each respective size class in which the change oc-curred.3 The BLS is the first statistical agency
to use this approach in measuring employ-ment growth by size of firm.
This article analyzes quarterly data on gross job gains and gross job losses by size class from the second quarter of 1990 through the third quarter of 2005.4 First, the
article briefly explains the concepts, defini-tions, and record linkage methodology used by the BLS to generate estimates of these data. Second, an overview is presented of the methodological issues that the BLS faced in selecting the final method for classifica- tion of firms by size class. Finally, the dis-cussion focuses on an analysis of the BED size class time series, with special attention on the role and contribution of various size
classes to gross job gains, gross job losses, and net change in employment over the course of business cycles in the U.S. economy.
Concepts and methodology
The BED statistics are based on the idea of “gross job flows,” a new approach in understanding changes in the job mar-ket. The concepts of gross job flows emerged through the use of U.S. business establishments’ microdata.5
Research- ers used data sources such as the Census Bureau’s longi- tudinal database on manufacturing and State unemploy-ment insurance files in creating a rich body of literature on this subject.6
Data on gross job gains and gross job losses reflect ad-justments made by businesses in reaction to changing economic events and conditions. The quarterly statistics on gross job gains and gross job losses are derived from the BLS Quarterly Census of Employment and Wag-es (QCEW) program. The QCEW microrecords are linked across quarters to create a longitudinal history for each es- tablishment, making up the Longitudinal Database. Re-cords are matched by their unique identifiers, including State codes, unemployment insurance numbers, and re-porting unit numbers. The objective is to link continuous records and to avoid generating spurious business births and deaths in the event of situations such as changes of ownership, mergers, acquisitions, spin-offs, and other cor-porate restructuring.
Once the tabulation of these data is complete, estab-lishments can then be aggregated by an employer’s Federal tax identification number, known as the Employer Identi-fication Number (EIN), to measure BED data elements by firm. This article focuses on data elements tabulated at the firm level.
BED data elements including employment levels and counts of establishments at opening, expanding, closing and contracting businesses are constructed from the Lon-gitudinal Database. During the tabulation process, the employment reported in the third month of each consec- utive quarter is used to measure the over-the-quarter em-ployment change. Gross job gains are equal to the sum of employment at opening firms and the net change in em-ployment at expanding firms. Similarly, gross job losses are the sum of prior quarter employment at currently clos- ing firms and the net change in employment at contract-ing firms.7 The net employment growth for all firms can
be measured in two ways: the difference between total em-
ployment in the current and previous quarters, or the dif-ference between gross job gains and gross job losses in the current quarter.8
Four size class methodologies under consideration. There are many ways that firms can be classified into size class-es for a longitudinal analysis of employment growth. The BLS considered four specific classification methodolo- gies: quarterly base-sizing, annual base-sizing, mean-siz- ing, and dynamic-sizing, and ultimately decided on dy-namic-sizing as the preferred method. These methods and the criteria for selection are discussed in a 2006 article by Shail Butani and others.9
Employment growth is measured as the change in firm size from quarter to quarter. The dynamic-sizing method-ology allocates a firm’s quarterly employment gain or loss to each respective size class in which the change occurred. Firms are initially assigned to a size class based on their employment in the previous quarter and over-the-quar- ter employment changes are distributed to the appropri-ate size category when that size class threshold has been crossed. For example, if a firm grows from 3 employees to 13 employees, the growth of 10 would be allocated as fol-lows: size class 1 to 4 employees would be credited with the growth of 1 employee (the growth from 3 to 4), size class 5 to 9 employees would be credited with the growth of 5 employees (the growth from 4 to 9), and size class 10 to 19 employees would be credited with the growth of 4 employees (the growth from 9 to 13). The methodology of dynamic-sizing was initially proposed by Per Davidsson in two research papers in 1996 and 1998.10
Dynamic-sizing is based on a measurement process which assumes continuous linear employment growth or loss from quarter to quarter, with the growth or loss allo- cated into the appropriate size class at the moment it oc- curred. In the example of a firm growing from 3 employ-ees in June to 13 employees in September, this growth of 10 employees can be linearly modeled as the growth of 1 employee every 9 days (13 weeks from one quarter to the next quarter, 7 days per week, and 10 employee growth over these 91 days). If a firm’s employment change could be measured on a daily basis, and if this employment change occurred linearly within the quarter, then the sta- tistics from this measurement process would be equiva-lent to the statistics from dynamic-sizing with quarterly point-in-time employment data.
Firm as a unit of analysis. While the other BED data se-ries use the establishment as the unit of analysis, the size class data are based on the firm level. An establishment is
defined as an economic unit that produces goods or ser-vices, usually at a single physical location, and engages in one or predominantly one activity. A firm is a business, either corporate or otherwise, and may consist of one or more establishments.
There are valid arguments for choosing either the firm or the establishment as the unit of analysis for produc-ing size class tabulations. If employment changes are the result of decisions made at corporate headquarters, then the firm is the appropriate unit for analyzing the expan- sion and contraction of businesses. Conversely, if employ-ment changes are the result of individual establishment decisions based upon local labor market conditions, then the establishment is the appropriate unit to analyze busi-ness expansions and contractions. The truth obviously lies somewhere between these two extremes—employment changes at individual establishments are affected by both corporate decisions and by local factors. The BLS believes that firm-level measurement of size classes is more con- sistent with the role of corporations as the economic deci-sionmakers than with each individual establishment. The EIN is the firm-level identifier used to create the BED size class statistics.
Small businesses and the number of size classes. What is a small business? Economic literature is full of referenc-es to small businesses. However, there is not a consensus among economists as to what constitutes a small business. Depending on the scope of the research and the availabil-ity of data, various sizes for small businesses are defined, analyses made, and policies recommended. The U.S. Small Business Administration (SBA) defines a small business for research purposes as an independent business hav-ing fewer than 500 employees; however, the SBA’s Office of Size Standards also has industry specific definitions of small businesses for government purposes.11
Additional-ly, there are other national and statewide advocacy groups in the private sector whose functions are to support and promote the concerns of very small firms, typically fewer than five employees.12
These “micro businesses” are less af- fected by economic downturns and act as “shock absorb-ers” in the economy.13
The BED data are based on the nine size classes desig-nated by the Office of Management and Budget as official size class standards for use by Federal agencies in indus-trial and occupational classifications. However, the BLS also has created two additional size categories to make analysis more compatible with existing size class conven- tions: a category of 100 or more employees, and a catego-ry of 500 or more employees. Data on size classes may be
combined to create broader categories; in the absence of a single definition for small or large firms, data users are able to create categories of interest for study.
BED data series: June 1990–September 2005
Frm size class. From June 1990 to September 2005, the private sector has experienced gross job gains averaging 6.6 million jobs each quarter. Which size class is respon-sible for the most gains?Firms with fewer than 100 employees contributed an average of 61.4 percent of gross job gains, while firms with fewer than 500 employees contributed 77.2 percent of to-tal gross job gains. Over this same period, private sector average quarterly gross job losses totaled 6.3 million, of which firms with fewer than 100 employees had a 62.3-percent share and firms with fewer than 500 employees had a 77.8-percent share.14 (See table 1.)
Gross job gains and gross job losses combined yield an average quarterly net gain of 324,000 jobs. Firms with fewer than 100 employees contributed 45.0 percent of the average quarterly net growth, while firms with fewer than 500 employees contributed 63.7 percent. These data show that within this time series, firms with fewer than 500 employees have, on average, contributed the most to net job gains. The share of these firms in total job creation is greater than their share of total employment: on average over this time series, firms with fewer than 500 employees have contained 56.7 percent of economywide employment but have contributed 63.7 percent of net employment gains. (See tables 1 and 2). These numbers are consistent with the conclusions of many studies.15
The larger contri-bution of small firms to job growth is evident in both net and gross job gains. This fact coupled with the absence of the regression-to-the-mean fallacy in the dynamic-sizing methodology may settle many controversies surrounding the role of small size businesses in job creation.16
Expansions, openings, contractions, and closings. The data have shown that, on average, expanding firms have created about 83 percent of total gross job gains per quarter while opening firms accounted for the remaining 17 percent. The very large firms, those with 1,000 or more employees, accounted for 21.3 percent of gross job gains from expan-sions, the highest share among the nine size classes. The next largest share belonged to size class 20 to 49 employ- ees, with 15.2 percent of the gross job gains from expan-sions. These two size groups also had the largest average quarterly shares of gross job losses from contractions, 20.6
percent and 15.3 percent respectively. (See table 1.) Firm openings and closings occurred mostly in small- er size classes. In size class 1 to 4 employees, the aver-age quarterly share of gross job gains from openings was 51.2 percent, and of gross job losses from closings was 48.6 percent. This share, unlike expansions and contrac-tions, diminishes as firm size increases.
Size class dynamics. The distribution of firms among the nine size classes is a compelling topic. As one would ex-pect over this time series, the number of firms in each of the size classes has increased across the board. (See ta-ble 3.) However, the percent share of firms in each class has increased for two dissimilar classes: firms with 1 to 4 employees and firms with 250 to 499 employees. Firms with 1 to 4 employees have represented more than half of total firms in the private sector. From first quarter 1990 to first quarter 2005, the share of firms in this size class has grown from 52.6 percent to 54.4 percent. The share of size class 5 to 9 employees fell the most, from 21.4 percent to 20.3 percent. Size classes 10 to 19, 20 to 49, and 50 to 99 employees fell as well, by 0.4 percent,
0.2 percent, and 0.1 percent, respectively. While there were some fluctuations over the business cycle, for firms in classes 100 to 249, 500 to 999, and 1,000 or more em-ployees shares were unchanged from their 1990 levels.17
(See table 3.)
When dividing firms into two size categories, 1 to 99 employees and 100 or more employees, the series shows small 0.1 percent fluctuations, but has held constant over the last 4 years. Size classes 1 to 499 employees and 500 or more employees show no change in firm share distri-bution throughout the series.
Even though the count of firms shows only a mod-est shift, with the addition of about 18 million employees from 1990 to 2005, the distribution of employees shows a more pronounced shift among the size classes.
Table 2 presents the distribution of employment by size class at the end of the first quarter each year from 1990 to 2005. The employment share of firms with 500 or more employees rose from 41.4 percent of total em-ployment in 1990 to 44.2 percent in 2005. Thus, the share of employment in firms with fewer than 500 employees has declined from 58.6 percent in 1990 to 55.8 percent
1 5 10 20 50 100 250 500 1,000
to to to to to to to to to
4 9 19 49 99 249 499 999 more
Level (in thousands)
Gross job gains ... 6,581 945 761 788 943 602 647 391 319 1,185 At expanding firms ... 5,487 385 586 661 834 554 611 375 309 1,171 At opening firms ... 1,094 560 175 128 109 48 35 16 10 14
Gross job losses ... 6,257 911 740 763 906 574 610 367 298 1,088 At contracting firms ... 5,181 388 574 638 795 520 566 346 285 1,070 At closing firms ... 1,076 523 166 125 112 53 44 20 14 19
Net change ... 324 34 21 25 37 28 37 24 21 97
Share (percent)1
Gross job gains ... 100.0 14.4 11.6 12.0 14.3 9.1 9.8 5.9 4.8 18.0 Expansions ... 100.0 7.0 10.7 12.0 15.2 10.1 11.1 6.8 5.6 21.3 Openings ... 100.0 51.2 16.0 11.7 9.9 4.4 3.2 1.4 .9 1.3
Gross job losses ... 100.0 14.6 11.8 12.2 14.5 9.2 9.7 5.9 4.8 17.4 Contractions ... 100.0 7.5 11.1 12.3 15.3 10.0 10.9 6.7 5.5 20.6 Closings ... 100.0 48.6 15.4 11.7 10.4 5.0 4.1 1.9 1.3 1.7
Net change ... 100.0 10.5 6.6 7.8 11.3 8.7 11.3 7.4 6.4 29.9 Cumulative share of net
change ...… — 10.5 17.1 24.9 36.2 45.0 56.3 63.7 70.1 100.0
1 Share measures the percent of the category represented by each firm size class.
Category
Size class (number of employees)
Average quarterly level and percentage share of gross job gains and losses by firm size, second quarter
1990 through third quarter 2005
Table 1.
Total
in 2005. While shares fluctuate across the time series, the smallest six size classes show a net decline. Size class 250 to 499 employees has remained steady at 7.2 per- cent of employment, while size class 500 to 999 employ-ees has gained 0.3 percent. The largest gain occured in size class 1,000 or more employees, which has gained 2.5 percent of employment. These trends may demonstrate that while large firms are gaining a higher share of to-tal employment, small firms are growing and gradually shifting to the large size group.
When comparing the change in employment shares over time, similar results occur when large firms are de-fined at both the 100 and 500 employee levels. From first quarter 1990 to first quarter 2005, firms with 500 or more employees experienced an increase of 2.8 per-centage points in the share of total private employment, while the change for firms with 100 or more employees was 2.5 percentage points. The similar changes in em-ployment shares for both boundaries may suggest that rapidly growing firms continue their growth and settle in
1 5 10 20 50 100 250 500 1,000 1 100 1 500 to to to to to to to to to to or to or
4 9 19 49 99 249 499 999 more 99 more 499 more
Level (in thousands)
1990 ... 89,278 4,809 5,951 7,255 10,354 7,870 9,593 6,461 5,826 31,158 36,239 53,038 52,293 36,985 1991 ... 87,356 4,827 5,895 7,108 10,007 7,514 9,152 6,087 5,685 31,081 35,351 52,006 50,590 36,766 1992 ... 87,024 4,872 5,914 7,094 9,935 7,412 9,053 6,075 5,626 31,042 35,228 51,796 50,356 36,668 1993 ... 88,530 4,963 5,995 7,171 10,048 7,532 9,265 6,221 5,826 31,510 35,709 52,821 51,195 37,335 1994 ... 91,214 5,026 6,093 7,338 10,384 7,748 9,662 6,518 6,021 32,425 36,588 54,626 52,769 38,445 1995 ... 94,561 5,099 6,182 7,508 10,688 8,083 10,068 6,816 6,295 33,823 37,559 57,002 54,443 40,118 1996 ... 96,531 5,139 6,227 7,580 10,863 8,254 10,318 7,017 6,576 34,558 38,062 58,469 55,397 41,134 1997 ... 99,401 5,221 6,304 7,718 11,124 8,420 10,605 7,251 6,893 35,864 38,788 60,613 56,644 42,757 1998 ... 102,204 5,244 6,316 7,782 11,236 8,548 10,851 7,466 7,146 37,615 39,127 63,078 57,443 44,761 1999 ... 104,637 5,296 6,400 7,891 11,417 8,703 11,030 7,589 7,351 38,959 39,707 64,930 58,326 46,311 2000 ... 107,672 5,299 6,446 8,051 11,677 8,941 11,286 7,942 7,557 40,473 40,414 67,258 59,642 48,030 2001 ... 108,561 5,345 6,445 8,066 11,696 8,928 11,419 7,927 7,636 41,100 40,480 68,082 59,825 48,736 2002 ... 105,810 5,377 6,468 8,036 11,591 8,685 11,051 7,591 7,271 39,742 40,156 65,654 58,797 47,013 2003 ... 105,097 5,459 6,506 8,055 11,520 8,618 10,955 7,509 7,131 39,345 40,158 64,939 58,621 46,476 2004 ... 105,915 5,528 6,591 8,141 11,661 8,731 11,028 7,614 7,200 39,421 40,652 65,263 59,294 46,621 2005 ... 107,902 5,606 6,613 8,204 11,801 8,873 11,310 7,813 7,334 40,349 41,096 66,806 60,219 47,683
Share (percent)
1990 ... 100.0 5.4 6.7 8.1 11.6 8.8 10.7 7.2 6.5 34.9 40.6 59.4 58.6 41.4 1991 ... 100.0 5.5 6.7 8.1 11.5 8.6 10.5 7.0 6.5 35.6 40.5 59.5 57.9 42.1 1992 ... 100.0 5.6 6.8 8.2 11.4 8.5 10.4 7.0 6.5 35.7 40.5 59.5 57.9 42.1 1993 ... 100.0 5.6 6.8 8.1 11.4 8.5 10.5 7.0 6.6 35.6 40.3 59.7 57.8 42.2 1994 ... 100.0 5.5 6.7 8.0 11.4 8.5 10.6 7.1 6.6 35.5 40.1 59.9 57.9 42.1 1995 ... 100.0 5.4 6.5 7.9 11.3 8.5 10.6 7.2 6.7 35.8 39.7 60.3 57.6 42.4 1996 ... 100.0 5.3 6.5 7.9 11.3 8.6 10.7 7.3 6.8 35.8 39.4 60.6 57.4 42.6 1997 ... 100.0 5.3 6.3 7.8 11.2 8.5 10.7 7.3 6.9 36.1 39.0 61.0 57.0 43.0 1998 ... 100.0 5.1 6.2 7.6 11.0 8.4 10.6 7.3 7.0 36.8 38.3 61.7 56.2 43.8 1999 ... 100.0 5.1 6.1 7.5 10.9 8.3 10.5 7.3 7.0 37.2 37.9 62.1 55.7 44.3 2000 ... 100.0 4.9 6.0 7.5 10.8 8.3 10.5 7.4 7.0 37.6 37.5 62.5 55.4 44.6 2001 ... 100.0 4.9 5.9 7.4 10.8 8.2 10.5 7.3 7.0 37.9 37.3 62.7 55.1 44.9 2002 ... 100.0 5.1 6.1 7.6 11.0 8.2 10.4 7.2 6.9 37.6 38.0 62.0 55.6 44.4 2003 ... 100.0 5.2 6.2 7.7 11.0 8.2 10.4 7.1 6.8 37.4 38.2 61.8 55.8 44.2 2004 ... 100.0 5.2 6.2 7.7 11.0 8.2 10.4 7.2 6.8 37.2 38.4 61.6 56.0 44.0 2005 ... 100.0 5.2 6.1 7.6 10.9 8.2 10.5 7.2 6.8 37.4 38.1 61.9 55.8 44.2
March of year
Number of employees
Distribution of employment by size class, March 1990 through March 2005
Table 2.
Total, private
the size class of firms with 500 or more employees. (See table 2.)
The gradual increase in the relative employment share of large size firms may be caused by the net effect of sever-al factors. While some firms grow large enough over time to become members of size class 500 or more employees, there is a constant addition of employment from open-ing businesses in the smaller size classes. Size classes 1 to 4, 5 to 9, and 10 to 19 employees are the only classes to have generated net gains from openings and closings over this time series. In the third quarter of 2005, employment
gains at opening firms in all size classes constituted 16.5 percent of total gross job gains and 5.6 percent of net employment growth. (See table 1.)
Additionally, it is possible that a number of firms that grow rapidly over time may move into higher size class-es, but may not surpass the 500 employee mark. These growing firms do not affect the employment share of large firms with 500 or more employees. These two fac- tors can help to explain the inner workings of this grad-ual employment shift.
Although the general trend shows an increasing share
1 5 10 20 50 100 250 500 1,000 1 100 1 500 to to to to to to to to or to to or or
4 9 19 49 99 249 499 999 more 99 more 499 more
Level (in thousands)
1990 ... 4,226.6 2,222.8 906.3 540.4 343.7 114.6 63.6 18.8 8.5 7.9 4,127.9 98.7 4,210.2 16.3 1991 ... 4,206.6 2,242.0 898.3 530.0 332.5 109.5 60.6 17.7 8.2 7.8 4,112.3 94.4 4,190.6 16.1 1992 ... 4,226.3 2,264.0 901.4 528.9 330.1 108.0 60.1 17.7 8.2 7.8 4,132.5 93.8 4,210.3 16.0 1993 ... 4,300.1 2,312.4 913.5 534.7 334.0 109.6 61.4 18.1 8.4 8.0 4,204.2 95.9 4,283.7 16.4 1994 ... 4,377.3 2,344.6 927.8 547.2 345.0 112.7 64.1 18.9 8.7 8.3 4,277.3 100.0 4,360.3 17.0 1995 ... 4,460.2 2,383.0 940.9 559.6 354.8 117.6 66.7 19.8 9.1 8.8 4,355.9 104.4 4,442.3 17.9 1996 ... 4,508.1 2,408.6 947.2 564.7 360.3 120.2 68.4 20.4 9.5 8.9 4,400.9 107.2 4,489.7 18.4 1997 ... 4,590.7 2,454.3 959.1 575.3 369.0 122.5 70.3 21.0 10.0 9.2 4,480.2 110.4 4,571.5 19.1 1998 ... 4,621.0 2,470.0 960.9 579.6 372.9 124.3 71.8 21.6 10.4 9.6 4,507.6 113.4 4,601.1 19.9 1999 ... 4,685.4 2,503.6 973.3 587.6 379.0 126.6 72.9 22.0 10.7 9.8 4,570.0 115.4 4,665.0 20.5 2000 ... 4,719.3 2,504.4 979.8 599.0 387.4 130.0 74.7 23.0 11.0 10.1 4,600.5 118.8 4,698.2 21.1 2001 ... 4,752.1 2,535.0 979.5 599.9 387.9 130.0 75.5 23.0 11.1 10.1 4,632.4 119.7 4,730.9 21.2 2002 ... 4,761.0 2,552.8 983.5 597.9 384.7 126.7 73.1 22.0 10.5 9.8 4,645.6 115.5 4,740.7 20.3 2003 ... 4,811.3 2,599.6 989.3 599.9 382.8 125.6 72.4 21.8 10.3 9.7 4,697.1 114.2 4,791.3 20.0 2004 ... 4,876.5 2,639.0 1,002.0 605.8 387.4 127.2 72.9 22.1 10.4 9.6 4,761.5 115.0 4,856.4 20.0 2005 ... 4,942.0 2,687.1 1,005.7 610.4 391.9 129.3 74.7 22.7 10.6 9.7 4,824.3 117.7 4,921.7 20.3 Share (percent)
1990 ... 100.0 52.6 21.4 12.8 8.1 2.7 1.5 0.4 0.2 0.2 97.7 2.3 99.6 0.4 1991 ... 100.0 53.3 21.4 12.6 7.9 2.6 1.4 .4 .2 .2 97.8 2.2 99.6 .4 1992 ... 100.0 53.6 21.3 12.5 7.8 2.6 1.4 .4 .2 .2 97.8 2.2 99.6 .4 1993 ... 100.0 53.8 21.2 12.4 7.8 2.5 1.4 .4 .2 .2 97.8 2.2 99.6 .4 1994 ... 100.0 53.6 21.2 12.5 7.9 2.6 1.5 .4 .2 .2 97.7 2.3 99.6 .4 1995 ... 100.0 53.4 21.1 12.5 8.0 2.6 1.5 .4 .2 .2 97.7 2.3 99.6 .4 1996 ... 100.0 53.4 21.0 12.5 8.0 2.7 1.5 .5 .2 .2 97.6 2.4 99.6 .4 1997 ... 100.0 53.5 20.9 12.5 8.0 2.7 1.5 .5 .2 .2 97.6 2.4 99.6 .4 1998 ... 100.0 53.5 20.8 12.5 8.1 2.7 1.6 .5 .2 .2 97.5 2.5 99.6 .4 1999 ... 100.0 53.4 20.8 12.5 8.1 2.7 1.6 .5 .2 .2 97.5 2.5 99.6 .4 2000 ... 100.0 53.1 20.8 12.7 8.2 2.8 1.6 .5 .2 .2 97.5 2.5 99.6 .4 2001 ... 100.0 53.3 20.6 12.6 8.2 2.7 1.6 .5 .2 .2 97.5 2.5 99.6 .4 2002 ... 100.0 53.6 20.7 12.6 8.1 2.7 1.5 .5 .2 .2 97.6 2.4 99.6 .4 2003 ... 100.0 54.0 20.6 12.5 8.0 2.6 1.5 .5 .2 .2 97.6 2.4 99.6 .4 2004 ... 100.0 54.1 20.5 12.4 7.9 2.6 1.5 .5 .2 .2 97.6 2.4 99.6 .4 2005 ... 100.0 54.4 20.3 12.4 7.9 2.6 1.5 .5 .2 .2 97.6 2.4 99.6 .4
March of year
Number of employees
Distribution of firms by size class, March 1990 through March 2005
Table 3.
Total, private
of employment for the larger size classes, this trend may be halted or temporarily disrupted by the relative shares of gross job gains and gross job losses in small and large firms throughout the business cycle. (See tables 2 and 3.) For example, during the recession of 2001, on average, large firms, those with 500 or more employees, contrib- uted 59.1 percent of net job losses; their share of employ-ment began to drop and continued to do so until 2004. The employment share of large firms still has not yet reached its pre-recession level. In contrast, during the 1990–91 re-cession, small firms, those with fewer than 500 employees, contributed an overwhelming 80.3 percent of net losses. As a result, the employment share of large firms remained unchanged in 1992 and continued to grow slowly until 2001.
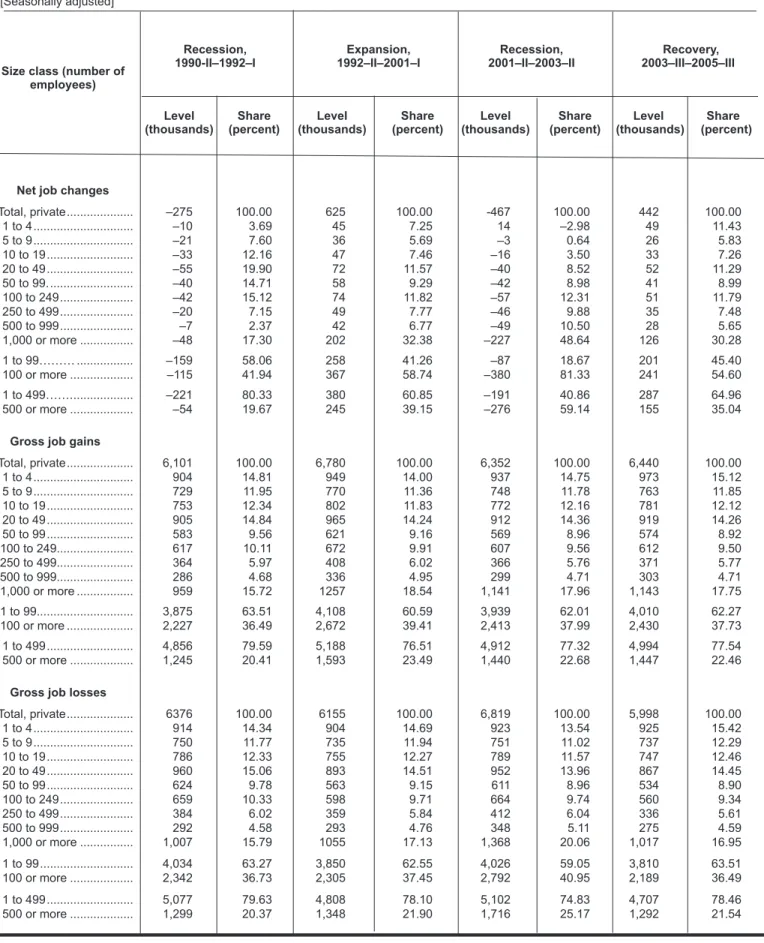
Gross job gains and losses and business cycles. Do gross job gains and gross job losses by firm size have business cycle properties? To answer this question, we divided the time series into four distinct periods:
• 1990–II to 1992–I: the quarters of net job loss associated with the 1990–91 recession;
• 1992–II to 2001–I: the recovery and expansion period after the early 1990–91 recession; • 2001–II to 2003–II: the quarters of net job loss associated with the 2001 recession; and
• 2003–III to 2005–III: the current recovery period. If employers react similarly during various phases of the business cycle, regardless of firm size, then the aver- age quarterly shares of gross job gains and gross job loss-es would be expected to remain steady across size classes. Table 4 and chart 1 show that firms of different size class-es do indeed behave differently throughout these periods. Moreover, a single class may not exhibit the same behav-ior during more than one recession or expansion. In fact, firms with 1 to 499 employees and those with 500 or more employees have had opposite impacts on the job market during these two recessions.
Gross job gains for firms with 500 or more employ-ees reached the prerecession level in the second quarter of 1993, nine quarters after the official end of the 1991 re- cession and started on an upward trend. These firms con-tributed, on average, 23.5 percent of gross job gains per quarter during mid-1990s expansion period. This share decreased slightly to 22.7 percent during the 2001 reces-sion, and fell to 22.5 percent during the recovery period. (See table 4 and chart 1.) As of the third quarter of 2005, 15 quarters after the official end of the 2001 recession,
gross job gains of these firms still have not recovered from the 2001 recession, where gains still remain significantly lower than the pre-recession level.
For small firms, those with 1 to 499 employees, gross job gains reached levels seen before the 1991 recession in the third quarter of 1993, only one quarter after the large firms. Again, as with the large firms, gross job gains of small firms have not yet recovered to pre-2001 levels.
In contrast, the gross job losses of both small and large firms are currently at a level comparable to historical lows. For large firms, the average quarterly share of gross job losses began at 21.9 percent during the 1990s expansion, and rose to 25.2 percent during the 2001 recession. The average share of gross job losses has since dropped to 21.5 percent. (See table 4 and chart 1.)
These figures show that the increase in gross job losses for firms with 500 or more employees contributed greatly to net job losses during the recent employment contrac-tion, far more than in the 1990–91 recession. While these larger firms have contributed significantly to the current employment expansion, present net gains do not appear to be attributable to a rise in gross job gains, but rather to a fall in the level of gross job losses.
Firms with 500 or more employees were responsible for an average share of 59.1 percent of net jobs lost per quarter during the 2001 recession and those job-declining quar-ters immediately following. This is in sharp contrast to the 39.2-percent share of net growth this size group experi-enced during the expansionary period following the 1990 recession. Firms with fewer than 500 employees contrib- uted 40.9 percent of the net losses during the latest em- ployment downturn and 60.8 percent of net job gains dur-ing the preceding expansion.18 (See table 4 and chart 1.)
This low level of gross job losses combined with middling levels of gross job gains make the present recovery one of less job losses rather than one of more job creation. Recovery and rates of gross job gains and losses. During a typical economic downturn, employers minimize their workforce in order to adjust for the lower levels of ag-gregate demand. When the recession is over and demand returns to pre-recession levels, laid-off workers are often called back to work and job gains activities improve. One should expect that in the course of the recession gross job gains fall and gross job losses rise, causing a net loss in to- tal employment. In the post recession period, if employ-ees are called back or hiring is resumed in the affected companies, gross job gains rise and gross job losses fall, leading to net employment gains.
Average quarterly level and share of net job change and gross job gains and losses during economic recessions and expansion
Size class (number of employees)
Level Share Level Share Level Share Level Share (thousands) (percent) (thousands) (percent) (thousands) (percent) (thousands) (percent)
Recession, Expansion, Recession, Recovery, 1990-II–1992–I 1992–II–2001–I 2001–II–2003–II 2003–III–2005–III
Table 4.
Net job changes
Total, private ... –275 100.00 625 100.00 -467 100.00 442 100.00 1 to 4 ... –10 3.69 45 7.25 14 –2.98 49 11.43 5 to 9 ... –21 7.60 36 5.69 –3 0.64 26 5.83 10 to 19 ... –33 12.16 47 7.46 –16 3.50 33 7.26 20 to 49 ... –55 19.90 72 11.57 –40 8.52 52 11.29 50 to 99. ... –40 14.71 58 9.29 –42 8.98 41 8.99 100 to 249 ... –42 15.12 74 11.82 –57 12.31 51 11.79 250 to 499 ... –20 7.15 49 7.77 –46 9.88 35 7.48 500 to 999 ... –7 2.37 42 6.77 –49 10.50 28 5.65 1,000 or more ... –48 17.30 202 32.38 –227 48.64 126 30.28 1 to 99……… ... –159 58.06 258 41.26 –87 18.67 201 45.40 100 or more ... –115 41.94 367 58.74 –380 81.33 241 54.60 1 to 499……. ... –221 80.33 380 60.85 –191 40.86 287 64.96 500 or more ... –54 19.67 245 39.15 –276 59.14 155 35.04
Gross job gains
Total, private ... 6,101 100.00 6,780 100.00 6,352 100.00 6,440 100.00 1 to 4 ... 904 14.81 949 14.00 937 14.75 973 15.12 5 to 9 ... 729 11.95 770 11.36 748 11.78 763 11.85 10 to 19 ... 753 12.34 802 11.83 772 12.16 781 12.12 20 to 49 ... 905 14.84 965 14.24 912 14.36 919 14.26 50 to 99 ... 583 9.56 621 9.16 569 8.96 574 8.92 100 to 249... 617 10.11 672 9.91 607 9.56 612 9.50 250 to 499... 364 5.97 408 6.02 366 5.76 371 5.77 500 to 999... 286 4.68 336 4.95 299 4.71 303 4.71 1,000 or more ... 959 15.72 1257 18.54 1,141 17.96 1,143 17.75 1 to 99... 3,875 63.51 4,108 60.59 3,939 62.01 4,010 62.27 100 or more ... 2,227 36.49 2,672 39.41 2,413 37.99 2,430 37.73 1 to 499 ... 4,856 79.59 5,188 76.51 4,912 77.32 4,994 77.54 500 or more ... 1,245 20.41 1,593 23.49 1,440 22.68 1,447 22.46
Gross job losses
Total, private ... 6376 100.00 6155 100.00 6,819 100.00 5,998 100.00 1 to 4 ... 914 14.34 904 14.69 923 13.54 925 15.42 5 to 9 ... 750 11.77 735 11.94 751 11.02 737 12.29 10 to 19 ... 786 12.33 755 12.27 789 11.57 747 12.46 20 to 49 ... 960 15.06 893 14.51 952 13.96 867 14.45 50 to 99 ... 624 9.78 563 9.15 611 8.96 534 8.90 100 to 249 ... 659 10.33 598 9.71 664 9.74 560 9.34 250 to 499 ... 384 6.02 359 5.84 412 6.04 336 5.61 500 to 999 ... 292 4.58 293 4.76 348 5.11 275 4.59 1,000 or more ... 1,007 15.79 1055 17.13 1,368 20.06 1,017 16.95 1 to 99 ... 4,034 63.27 3,850 62.55 4,026 59.05 3,810 63.51 100 or more ... 2,342 36.73 2,305 37.45 2,792 40.95 2,189 36.49 1 to 499 ... 5,077 79.63 4,808 78.10 5,102 74.83 4,707 78.46 500 or more ... 1,299 20.37 1,348 21.90 1,716 25.17 1,292 21.54
regime was not followed. Gross job gains fell at the onset of the downturn while gross job losses increased dramati- cally, resulting in a net loss in employment. After the offi-cial end of the recession during the fourth quarter of 2001, gross job gains rose for one quarter and then resumed a downward trend, lasting until the third quarter of 2003. Gross job losses, however, peaked in the middle of the re- cession, the third quarter of 2001, returned to pre-reces-sion levels in the first quarter of 2002, and then continued to fall until the fourth quarter of 2002. The improvement in the job market, therefore, was initiated by a slowdown in the pace of gross job losses, not by a stream of gross job gains. This phenomenon—the fall of gross job gains rates and a historically low level of gross job loss rates—is evi- dent in all size classes and continues up to the third quar- ter of 2005, the latest quarter for which data were avail-able.19 (See chart 2.) For example, the rate of gross job
gains in firms with 500 or more employees was 3.6 per-cent in the fourth quarter of 2000, and fell to 3.3 percent by the third quarter of 2005. Gross job losses however, fell from 3.3 percent to 2.7 percent over the same peri-od. Firms with fewer than 500 employees showed similar
changes, with the rate of gross job gains falling from 8.7 percent to 8.3 percent and the rate of gross job losses fall-ing from 8.5 percent to 7.8 percent. In both of these size classes, drops in the rate of gross job losses exceeded de-clines in the rate of gross job gains, causing a positive net change in total employment. Therefore the current recov- ery of the labor market has been mainly the result of de-creased gross job losses, rather than increased gross job gains.
In other words, these net employment gains appear to be predominantly from fewer layoffs, plant closings and other la-bor force reducing events, and to a lesser extent from greater business openings and expansions that the economy typi-cally experiences during an economic recovery.
Additionally, note that the rates of gross job gains of these two size classes peaked at different points preced-ing the 2001 recession. (See chart 2.) The rate of gross job gains in firms with 1 to 499 employees (small firms) peaked in 2001, while the rate for firms with 500 or more employees (large firms) peaked far earlier, in 1998. As the BED size class data series continues over time, it will be interesting to see if this early reaction of large firms to an 20
15
5 0 25 30 35
Expansion2
second quarter 1992–
first quarter 2001
Recession3
second quarter 2001– second quarter 2003
Recovery4
third quarter 2003– third quarter 2005
Percent 50
Recession1
second quarter 1990–
first quarter 1992
Average quarterly share of net change for firms with 1 to 499 employees and firms with 500
or more employees during the business cycle, 1990–2005
10
35 30 25 20 15 10 5 0 40 50
Percent 40
Business cycle period
1 Quarters of net job loss associated with the 1990–91 recession. 2 Recovery and expansion period.
3 Quarters of net job loss associated with the 2001 recession. 4 Current recovery period.
1 to 499 employees 500 or more employees
Gross job gains and gross job losses as a percent of employment in private sector firms, June
1990–March 2005, seasonally adjusted
Chart 2.
Firms with less than 500 employees
Firms with 500 or more employees
Percent Percent
Percent Percent
11
10
9
8
7
11
10
9
8
7
1990 1992 1994 1996 1998 2000 2002 2004 2006
5
4
3
2
5
4
3
2
1990 1992 1994 1996 1998 2000 2002 2004 2006
Gross job gains
Gross job losses
Gross job losses
Gross job gains
economic downturn constitutes a pattern and if it could perhaps be used as a leading indicator of what lies ahead in the job market.
Job reallocation rate and size of firm. The job reallocation rate is the sum of the rate of gross job gains and the rate of gross job losses. This figure may be used as a measure of job turnover, the “churning” beneath the surface of the job market. Data on job reallocation rates by firm size re-veal two facts. First, the average job reallocation rates for each class are inversely related to the size of the firms. This means the larger firms have lower turnover rates. (See chart 3.)
Second, job reallocation rates for all size classes are de-clining. The rates for all size classes have been relatively flat throughout the 1990s expansion period and are now on a decline during the current recovery. These low post recession job reallocation rates stem mainly from a fall in the rate of gross job losses.
IN SUM, THE FOLLOWING FINDINGS
result from analy-sis of BLS firm size class data:
• Small firms, those with 1 to 499 employees, create about 64 percent of new jobs.
• The share of growth of small firms is larger than their base share of employment. This growth, howev-er, causes small firms to become large, increasing the employment share of large firms over time.
• Firms of different size classes behave differently throughout the phases of the business cycle. The con-tribution of large firms to the net job gains during the current economic recovery appears to have come from a fall in the level of gross job losses, rather than increased job creation. The share of gross job gains for this group has not yet reached its pre-recession levels.
• The bulk of net job losses in the 1991 recession oc- curred in small firms, while large firms have gener-ated the majority of job losses during the economic slowdown of 2001.
Average job allocation rates by firm size, second quarter 1990 through third quarter 2005
Rate Rate
1 to 4 5 to 9 10 to 19 20 to 49 50 to 99 Chart 3.
40 35 30 25
15 10 20
5 0 40
35 30 25
15 10 20
5 0
100 to 249 250 to 499 500 to 999 1,000 or more
NOTES
1 Steven J. Davis, John C. Haltiwanger, and Scott Schuh, Job Cre-ation and Job Destruction, (Cambridge, MIT Press, 1966), Chapter 4.
2
Cordelia Okolie, “Why size class methodology matters in analy-ses of net and gross job flows,” Monthly Labor Review, July 2004, pp. 3–12.
3 Per Davidsson, “Methodological Concerns in the Estimation of
Job Creation in Different Firm Size Classes” Jönköping Internation-al Business School (1996 Working Paper) on the Internet at: http://
www.ihh.hj.se/eng/research/publications/wp/1996–1%20Davids-son.pdf (accessed June 2005); and Per Davidsson, Leif Lindmark,
and Christer Olofsson, “The Extent of Overestimation of Small Firm Job Creation—An Empirical Examination of the Regression Bias,” Small Business Economics, 1998, pp. 87–100.
4
Prior to third quarter 1992, Multiple Worksite Report process-ing had not become fully operational. Because the BED data series is
based at the establishment level, data is published beginning at this point, where firms composed of multiple establishments could submit data for each establishment. However, because this size class analy-sis is based at the firm level, these breakouts are not necessary. For the purpose of this research, the data series has been expanded back to second quarter 1990 in order to demonstrate the differences between the 1990 and 2000 recessions. Due to the improvements in reporting, caution should be used when comparing data collected before and af-ter September 1992.
5 For more details on gross job flows, see Davis, Haltiwanger, and Schuh, Job Creation and Job Destruction ; John M. Abowd, John Halti- wanger, and Julie Lane, “Integrated Longitudinal Employer-Employ-ee Data for the United States,” American Economic Review: Papers and Proceedings, May 2004, pp. 224–29; Timothy R. Pivetz, Michael A. Searson, and James R. Spletzer, “Measuring job and establishment flows with BLS longitudinal microdata,” Monthly Labor Review, April
2001, pp. 13–20.
6
Timothy Dunne, Mark J. Roberts, and Larry Samuelson, “Pat-terns of Firm Entry and Exit in U.S. Manufacturing Industries,” Rand Journal of Economics, winter 1988, pp. 495–515; Timothy Dunne, Mark J. Roberts, and Larry Samuelson, “Plant Turnover and Gross Employ-ment Flows in the U.S. Manufacturing Sector,” Journal of Labor Eco-nomics, January 1989, pp. 48–71; Davis, Haltiwanger, and Schuh, Job Creation and Destruction; James R. Spletzer, “The Contribution of Establishment Births and Deaths to Employment Growth,” Jour-nal of Business and Economic Statistics, January 2000, pp. 113–26; and Christopher L. Foote “Trend Employment Growth and the Bunch-ing of Job Creation and Destruction,” Quarterly Journal of Economics, August 1988, pp. 809–34.
7
It is important to note that gross job gain and gross job loss sta-tistics measure the sum of firm level net employment changes, and do not measure the flow of individual workers into and out of the unit. For example, if a firm increases employment from 50 workers to 60 workers, these 10 additional jobs are classified as gross job gains. This addition of 10 jobs during the quarter may have occurred with the ad- dition of 10 new hires, or through any combination of hires and sep-arations. Counts of hires and separations are published monthly by the Job Openings and Labor Turnover Survey (JOLTS) program at
the BLS.
8 For more on BED concept and methodology, see James R. Spletzer,
R. Jason Faberman, Akbar Sadeghi, David M. Talan, and Richard L. Clayton, “Business Employment Dynamics,” Monthly Labor Review, April 2004, pp. 29–42.
9 Shail J. Butani, Richard L. Clayton, Vinod Kapani, James R.
Spletzer, David M. Talan, and George S. Werking, Jr., “Business Em-ployment Dynamics: tabulation by employer size” Monthly Labor Re-view, February 2006, pp. 3–22.
10 Davidsson, “Methodological Concerns in the Estimation of Job
Creation in Different Firm Size Classes”; and Davidsson, Lindmark, and Olofsson, “The Extent of Overestimation of Small Firm Job Cre-ation—An Empirical Examination of the Regression Bias.”
11 See Guide to SBA’s Definitions of Small Business, on the Internet
at http://www.sba.gov/size/indexguide.html.
12 Organizations include National Association for the
Self-Em-ployed (www.nase.org); Micro Business Development (www.mi-crobusiness.org); Micro-Business USA (www.microbusinessusa.org);
Micro Business Cooperative Extension (http://fcs.okstate.edu/micro-biz/).
13
Derek Leebeart, “How Small Businesses Contribute to U.S. Eco-nomic Expansion.” E-Journal USA: Economic Perspective, January 2006.
14 Long-term average share is used in this analysis. The shares of
size classes in gross job gains, gross job losses, and net change in em-ployment are highly seasonal and cyclical. For example, the net change share for firms with 500 or more employees was 14.3 in the second quarter of 2005, but rose to 48.1 percent in the third quarter of 2005.
15 D. Birch, The Job Generation Process, Final Report to Economic Development Administration, Program on Neighborhood and Regional Change (Cambridge, MIT
Press, 1979); J. Baldwin and G. Picot, “Em- ployment Generation by Small Producers in the Canadian Manufac-turing Sector,” Small Business Economics , 1995, pp. 317–31; and P. Da-vidsson, L. Lindmark, and C. Olofsson, “The trend toward smaller scale during the 1980’s: empirical evidence from Sweden,” paper pre-sented at ICSB’s 40th World Conference, Sydney, June 1995.
16 For a detailed discussion on small firm job creation debate, see
Per Davidsson, “Methodological Concerns in the Estimation of Job Creation in Different Firm Size Classes.”
17 Please note that these figures are not seasonally adjusted and are
compared on an annual basis.
18 For more information on comparing these two recessions, see
Shail Butani, George Werking, and Vinod Kapani, “Employment dy-namics of individual companies versus multicorporations,” Month-ly Labor Review, December 2005, pp. 3–15; and Jason R. Faberman, “Gross Job Flows over the Past Two Business Cycles: Not all ‘Recover-ies’ are Created Equal,” BLS Working Paper, 2004.
19
Gross job gains and gross job losses for any size class are ex-pressed as rates by dividing their levels by the average of employment in the current and previous quarters. This provides a symmetric growth rate. The rates are calculated for the components of gross job gains and gross job losses and then summed to form their respective totals. These rates can be added and subtracted just as their levels can. For instance, the difference between the gross job gains rate and the gross job losses rate is the net growth rate.