Financial Aid in Canada?
Prepared for:
Canadian Association of Student Financial Aid Administrators (CASFAA)
By
Sean
Junor
and
Alex
Usher
About CASFAA
The Canadian Association of Student Financial Aid Administrators (CASFAA) is a national professional association that represents financial aid administrators at Canada's universities, colleges and technical institutes. As a professional association, CASFAA serves as a liaison between our members and the federal government, service providers, financial institutions and various other stakeholders in student financial aid; advocates on behalf of members by providing input on student financial assistance programs and policies; and provides professional development opportunities for members, including our annual conference.
About the Educational Policy Institute
The Educational Policy Institute is a non‐profit research center focused in issues of educational opportunity, especially for our most needy populations. Based in Virginia Beach with offices in Toronto and Melbourne, EPI conducts program evaluation, policy analysis, and conducts professional development opportunities for educational professionals throughout the education continuum. Visit the EPI website at www.educationalpolicy.org.
About the Authors
SEAN JUNOR is the Manager of Knowledge Mobilization at the Educational Policy Institute. Prior to joining the Institute, he was the Senior Policy and Research Officer for the Canada Millennium Scholarship Foundation. He is a native of Saskatoon, Saskatchewan, and a graduate of the University of Saskatchewan. ([email protected])
ALEX USHER is the Vice‐President of the Educational Policy Institute. Prior to joining the Institute, he was the Director of Research and Program Development for the Canada Millennium Scholarship Foundation, where he was in charge of Canada’s largest‐ever research project on access to post‐secondary education. He is a native of Winnipeg, Manitoba, and graduate of McGill University and Carleton University. ([email protected])
Suggested Citation:
Junor, Sean, & Usher, Alex (2007). The End of Need‐Based Student Financial Aid in Canada? Toronto, ON: Educational Policy Institute.
Table of Contents
About CASFAA ... 2
About the Educational Policy Institute ... 2
About the Authors ... 2
Table of Contents ... 3
Data Limitations and Observations ... 4
Chapter 1: Introduction ... 5
Chapter 2: Student Aid in Canada 1993‐1994 to 2003‐2004 ... 7
2.1 Introduction ... 7
2.2 Alberta ... 8
2.3 British Columbia ... 10
2.4 Manitoba ... 13
2.5 New Brunswick ... 15
2.6 Newfoundland and Labrador ... 18
2.7 Nova Scotia ... 20
2.8 Ontario ... 22
2.9 Prince Edward Island ... 25
2.10 Québec ... 27
2.11 Saskatchewan ... 30
Chapter 3: Student Aid Policy and Program Changes Since 2004 ... 34
3.1 Introduction ... 34
3.2 Government of Canada and Canada Millennium Scholarship Foundation ... 34
3.3 Alberta ... 37
3.4 British Columbia ... 38
3.5 Manitoba ... 40
3.6 New Brunswick ... 41
3.7 Newfoundland and Labrador ... 41
3.8 Nova Scotia ... 42
3.9 Ontario ... 43
3.10 Prince Edward Island ... 45
3.11 Québec ... 45
3.12 Saskatchewan ... 46
Chapter 4 Summary and Conclusions ... 47
Bibliography ... 51
Data Limitations and Observations
In order to keep monetary comparisons constant over time, this paper converts all figures in Chapter 2 into June 2005 real dollars.
In each provincial summary, we begin by displaying a chart showing changes in student aid over time. These data show monies extended to students and do not represent government expenditures. While government expenditures and student take‐up is identical as far as grants, scholarships, and tax credits are concerned, they are not the same when it comes to loans (the author’s estimate the cost of a dollar of loans to be about 33 cents).
Any interested parties who wish to investigate or use data behind the tables and figures are encouraged to contact the Educational Policy Institute.
Chapter 1:
Introduction
There was a major change in Canadian student aid in the late 1990s, due largely to a package of measures adopted by the Government Canada as part of its “Canada Opportunities Strategy”. At the time, what aroused the most comment was the creation in 1998 of the $2.5 billion Canada Millennium Scholarship Foundation (Foundation). But while the Foundation was certainly a welcome – if controversial ‐ addition to the country’s stock of need‐based aid, its creation did not herald the start of a new focus on need‐based aid. Quite the contrary, in fact: the creation of the Foundation was actually the last major investment in need‐ based aid made by any Canadian government for nearly seven years.
In retrospect, the most significant measure of the late 1990s was contained not the flashy 1998 federal budget, but rather in the almost unheralded budget of 1996. In that budget, the monthly education tax credit amount for full‐time students was increased from $60 per month to $80 per month. Though it hardly set the world on fire, this measure fundamentally altered the nature of student aid in Canada. The next year the monthly amount was increased – in stages – from $80 per month to $200 per month and part‐time students became eligible for a $60 per month credit. These amounts were later doubled in the federal Liberals’ pre‐election mini‐budget of October 2000, and then hiked again in 2006 when the new Conservative government created a $60 per month tax credit for “textbooks” (more will be discussed on this in Chapter 3) which was an addition to the existing monthly amount in all but name. Ancillary fees were added to the tuition fee tax credit. Student loan interest became subject to a tax credit as well.
Provinces not to be outdone got into the tax credit act, too. Most matched the increases in federal tax credits – some (notably Alberta) increased them way beyond anything the federal government did. Some have‐not provinces even began trying to use education tax credits as a way to stem the loss of their youth population.
What all of this signaled was a decreased desire on the part of governments to use need‐based student assistance to distribute aid to those who need it the most. Instead, governments began finding non‐need‐based methods of providing supports: tax credits, tuition freezes – anything which did not use need as a criterion ‐ became the preferred method of distributing money. Indeed, governments went so far as to begin actively seeking to distribute money to people who ‐ so far from being needy ‐ were actually well enough off to save substantial sums of money for their children’s’ education. The Canada Education Savings Grant (CESG), begun in 1998, almost immediately became a $400‐million per year program. Recently, provinces have begun copying this, too – most notably, Québec, which has begun matching federal contributions to the program on a 1:2 basis.
The metamorphosis from a need‐based system of aid to a predominantly non‐need‐based system of aid in Canada did not happen instantly. It has been the slow, inexorable result of an accretion of government decisions at both the federal and provincial levels. Ideology has not played a part – governments of both the left and right alike have plunged with abandon into non‐need‐based projects.
The purpose of this report is to shed light on the how this situation evolved, on a province‐by‐ province basis1. In Chapter 2, the paper takes data from 1993‐94 to 2003‐04 (the last year for which good data is available) to show how the mix of available aid changed in each province over that decade, and how these changes helped to offset the rises in tuition which occurred over that time. Though there are some broad themes which emerge from this examination, the situation was not the same in all provinces and the individual sections of this chapter should help the reader understand the nuances in situations across the country.
Although good data on student assistance is not available past 2004, it is possible to track the broad outline of changes in student aid just by examining various budget documents and tracking government announcements dealing with student financial assistance. This paper does this in Chapter 3. In the final chapter, the paper examines the cumulative effect of these changes on student assistance and outlines who has benefited the most from the recent changes.
1
The authors have not intentional excluded Canada’s three territories from the analysis in the paper,
however, the availability of comparable and quality data does not allow for a full comparison using
Chapter 2:
Student Aid in Canada 1993-1994 to
2003-2004
2.1 Introduction
Chapter 2 deals with changes in the overall amounts of student aid being provided by federal and provincial governments in between the years 1993‐94 and 2003‐04, the last year for which complete and accurate data is available. It shows the amount of federal and provincial aid provided by each province in each of these years. It also describes the effects of these changes on various measures of affordability. Overall, what the chapter shows is that there were very significant increases in student aid over this decade which, although they did not completely offset the increases in tuition which occurred over the course of the 1990s, did go some considerable distance to mitigating it.
The data in this chapter are largely based on two EPI publications; The State of Student Aid in
Canada (2007, forthcoming) and Beyond the Sticker Price (2006). Data on federal and provincial
expenditures was directly collected in two surveys – one conducted in 2003 and 2004 as part of the Price of Knowledge 2004 project and another in early 2005 as part of The State of Student Aid. Data shown in the various figures has been expressed in real 2005 dollars in order to account for inflation. In all figures, the portion indicated as “net loans” refers to the amount of loans issued minus the amount of remission paid out (to avoid double counting) in any given year. This should not be taken as reflective of actual government expenditures on loans; though the figure varies somewhat over time and across provinces, as a rule of thumb, a dollar in student loans costs a government roughly 33 cents in interest carrying charges, defaults, and interest relief costs.
The data on individual affordability is presented as follows: For each province in each year, data is presented on the following four concepts:
Average Tuition2 and fees: Average tuition for undergraduate3 students plus average ancillary fees as reported by Statistics Canada
Tax Credits: Tax credits available to students studying full‐time for eight months paying the average tuition and fees listed above.
Everybody’s Net Tuition (ENT). Average tuition and fees minus tax credits: in effect, the tuition charge minus the non‐repayable tax credits which everyone receives.
2
Statistics Canada does not produce tuition and fee data nor does the agency disaggregate by polytechnic
or university‐college.
3
Undergraduate tuition fee numbers are weighted averages calculated using the most current enrolment data available and the following faculties are included: Agriculture, Architecture, Arts, Commerce, Dentistry, Education, Engineering, Household Science, Law, Medicine, Music, and Science.
Average Grants: The average size of grant in a particular jurisdiction in a particular year.
Grant Recipients’ Net Tuition (GRNT): NET minus average grants. In effect, the “net” tuition paid by those people who receive grants.
2.2 Alberta
Student Assistance Expenditures to 2004
Total student assistance available to students in Alberta rose by close to 80 percent over the decade to 2003‐04; substantially more than the national average of 50 percent. At the start of the decade, annual expenditures were just over $400 million per year; by 2003‐04, expenditures were roughly $725 million. Over half of this increase was due to an increase in tax expenditures; most of the remainder is due to an increase in grants and loan remission. Together, this means all of the increase in assistance has been due to an increase in non‐repayable assistance; indeed, net loans now only cover about one‐third of total assistance in Alberta.
In part, this increase was due to an increase in the number of post‐secondary students in the province: college and university enrolments rose by 20 to 25 percent during the decade in question. Still, real aid available to student grew substantially over the decade. Total aid available to students is shown below in Figure 1.
Figure 1 – Total Assistance by Type – Alberta ($2005)
0 100 200 300 400 500 600 700 800 1993-94 1994-95 1995-96 1996-97 1997-98 1998-99 1999-00 2000-01 2001-02 2002-03 2003-04 $ M illio n s
Tax Expenditures CESG Merit Net Loans Remission Grants
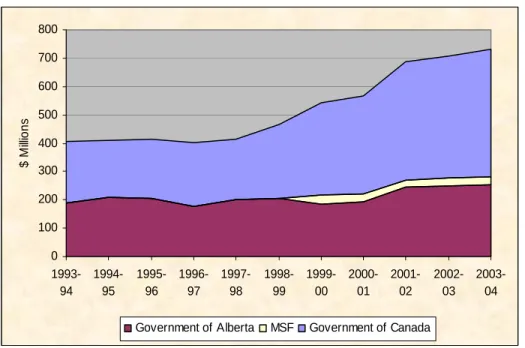
As in the rest of the country, the decade ended with proportionately less assistance being given out by the provincial government than at the start. Although provincial aid increased by roughly $50 million, federal aid more than doubled, from $214 million to $478 million. As a result, nearly two‐thirds of all student aid dollars in Alberta (need‐based and universal combined) now come from the Government of Canada.
Figure 2 – Total Assistance by Source – Alberta ($2005) 0 100 200 300 400 500 600 700 800 1993-94 1994-95 1995-96 1996-97 1997-98 1998-99 1999-00 2000-01 2001-02 2002-03 2003-04 $ M ill ions
Government of Alberta MSF Government of Canada
Affordability Outcomes: Net Tuition in Alberta over Time
To date, the paper has been examining changes in government expenditure levels. But how have these changes affected individual students? In order to answer this, the paper will examine changes in tuition, tax credits and grants. This is done below in Table 1.
Table 1 – Changes in Tuition, Subsidies and Net Costs, Alberta 1995‐96 to 2005‐06 (real $2005
dollars)
Tuition and Fees
Tax
Credits ENT Grants GRNT 1995‐96 $3,819 $1,103 $2,716 $3,397 ‐$681 1996‐97 $4,072 $1,166 $2,907 $3,388 ‐$481 1997‐98 $4,345 $1,233 $3,112 $3,163 ‐$51 1998‐99 $4,666 $1,338 $3,328 $3,479 ‐$152 1999‐00 $4,804 $1,470 $3,334 $2,888 $447 2000‐01 $4,875 $1,843 $3,031 $2,652 $379 2001‐02 $4,874 $1,843 $3,031 $2,424 $607 2002‐03 $4,963 $2,134 $2,829 $2,874 ‐$44 2003‐04 $5,234 $2,208 $3,026 $2,733 $293 2004‐05 $5,606 $2,326 $3,281 2005‐06 $5,638 $2,334 $3,304
Tuition and fees rose steadily for much of the decade in question. Overall, tuition fees rose by just over $1,800. However, federal and provincial tax credits offset more than half this growth. Once the effects of tax credits are taken into account, the net tuition paid by Alberta student only increased by $600, or about 22 percent.
The average grant size decreased by about $600 in the period, meaning that Grant recipients’ net tuition (GRNT) rose substantially after 1998‐99. However, because of data collection limitations, GRNT is based on the average grant size, not the average amount of grant received (individuals can receive more than one grant). Since the number of grants increased substantially over the years in question (from 13,807 in 1998‐99 to 34,954 in 1999‐2000 and 54,564 in 2003‐04), it seems likely that not only are a larger people are receiving grants, but that more people are receiving multiple grants as well, meaning that “true” GRNT is probably decreasing, not increasing.
In other words, combined federal and provincial expenditures have kept rises in net tuition to about 20 percent which – given the increases in family income in Alberta over these years – means they have stayed roughly constant in terms of affordability. The picture for grant recipients’ net tuition is a little less clear, but given the sharp increase in the number of grant recipients, it seems likely that overall, the affordability picture has improved substantially for a large number of students in the province.
2.3 British
Columbia
Student Assistance Expenditures to 2004
Total student assistance expenditures in British Columbia more than doubled over the decade to 2003‐04; substantially more than the national average of 50 percent. At the start of the decade, annual expenditures were $430 million per year; by 2003‐04, expenditures were roughly $900 million per year. Over half of this increase was due to an increase in need‐based loans, and a substantial portion of the remainder came from need‐based grants. In significant contrast to most other provinces, less than 20 percent of the increase in assistance in British Columbia came from tax credits and only about a third came from universal sources of income.
Much of the increase in student aid in British Columbia can be attributed to the province’s spectacular growth in post‐secondary education participation (albeit from a very low base) during the decade in question. However, even with student numbers increasing by roughly 50 percent, the growth in student aid dollars was such that per‐student aid still increased substantially.
Figure 4 – Total Assistance by Type – British Columbia ($2005)
0 100 200 300 400 500 600 700 800 900 1000
1993-94
1994-95
1995-96
1996-97
1997-98
1998-99
1999-00
2000-01
2001-02
2002-03
2003-04
$
M
illi
o
n
s
Tax CESG Merit Loans Remission Grants
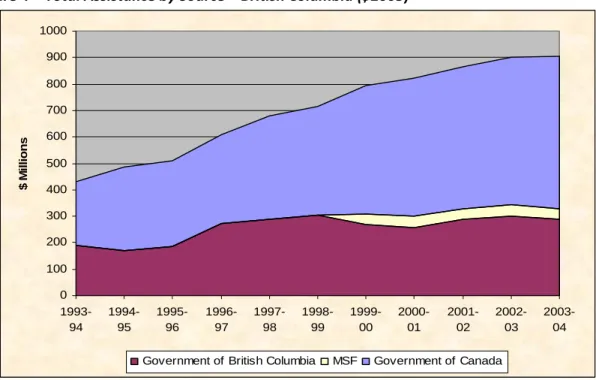
As in most other provinces, the distribution of student assistance by source changes substantially during this decade. At the outset of the decade, roughly 45 percent of all aid in British Columbia came from the provincial government; by 2003‐04, this proportion had fallen to less than 32 percent, thanks to a 140 percent rise in federal loans, grants and tax credits combined. This is not to say provincial assistance declined; indeed, in absolute terms, provincial assistance increased substantially from $190 million per year to $288 million per year. But the huge increase in federal aid simply outstripped the growth in provincial aid.
Figure 4 – Total Assistance by Source – British Columbia ($2005) 0 100 200 300 400 500 600 700 800 900 1000 1993-94 1994-95 1995-96 1996-97 1997-98 1998-99 1999-00 2000-01 2001-02 2002-03 2003-04 $ M il lio n s
Government of British Columbia MSF Government of Canada
Affordability Outcomes: Net Tuition in British Columbia over Time
To date, this paper has been examining changes in government expenditure levels. But how have these changes affected individual students? In order to answer this, the paper needs to examine changes in tuition, tax credits and grants. This is done below in Table 2.
Table 2 – Changes in Tuition, Subsidies and Net Costs, British Columbia, 1995‐96 to 2005‐06
Tuition and Fees
Tax
Credits ENT Grants GRNT 1995‐96 $3,433 $1,053 $2,381 $3,286 ‐$905 1996‐97 $3,419 $1,049 $2,370 $3,797 ‐$1,427 1997‐98 $3,312 $1,014 $2,297 $3,626 ‐$1,329 1998‐99 $3,273 $1,042 $2,231 $3,246 ‐$1,015 1999‐00 $3,242 $1,129 $2,113 $3,086 ‐$973 2000‐01 $3,315 $1,081 $2,234 $3,317 ‐$1,083 2001‐02 $3,136 $1,051 $2,085 $3,399 ‐$1,314 2002‐03 $3,870 $1,429 $2,442 $2,890 ‐$448 2003‐04 $4,909 $1,584 $3,325 $2,807 $519 2004‐05 $5,458 $1,716 $3,742 2005‐06 $5,349 $1,762 $3,587
Due to the provincial tuition freeze in the period 1996‐2002, tuition, net tuition and GRNT remained more or less constant over those years. However, as noted earlier, GRNT only tells part of the story; equally important was the fact that the number of grants more than tripled over the same period, increasing from 14,878 in 95‐96 to 54,919 in 2001‐02. As a result, in the period up to 2002, the situation remained constant for both non‐grant recipients and grant
This situation changed when the provincial government decided to lift the tuition fee freeze and allow fees to rise by roughly 60 percent, from $3,136 in 2001‐02 to $5,458 in 2004‐05. Although tax credits automatically rose to partially offset the increase, ENT still rose by over 80 percent in the three years after the tuition fee increase. As for grant recipients, their numbers remained constant but the average size of their grant actually declined. As a result, they went from paying substantially negative tuition to paying about $500 in net tuition.
In sum, after enjoying a very good last half of the 1990s in which net costs actually declined, British Columbia students’ financial position deteriorated rapidly in the first half of this decade.
2.4 Manitoba
Student Assistance Expenditures to 2004
Total student assistance expenditures in Manitoba rose by about 80 percent. This is substantially more than the national average of 50 percent, but less than that in some of the other western provinces. At the start of the decade, annual expenditures were $92 million per year; by 2003‐04, expenditures were roughly $166 million per year. None of this increase was due to a rise in net loans – indeed, these declined over the decade. Most of the increase was due to an expansion in tax credits but a not insubstantial portion of the rise was due to the introduction of remission programs the province and the Canada Millennium Scholarship Foundation.
Some of this rise in total assistance was due to changes in post‐secondary education student numbers, which rose by roughly 25 percent in the years after 1999; however, the growth in student aid still outstripped the growth in student numbers substantially, implying that per‐ student aid rose substantially.
Figure 5 – Total Assistance by Type – Manitoba ($2005)
0 20 40 60 80 100 120 140 160 180 1993-94 1994-95 1995-96 1996-97 1997-98 1998-99 1999-00 2000-01 2001-02 2002-03 2003-04 $ M ill io n s
Tax CESG Merit Net Loans Remission Grants MSRFAP
As in most other provinces, the distribution of student assistance by source changed substantially during this decade. At the outset of the decade, roughly 25 percent of all aid in Manitoba came from the provincial government; by 1996‐1997 this had risen to over 40 percent. However, starting in 1998‐99 (that is, after the Canada Opportunities Budget of 1998), the proportion coming from the provincial government began to fall quite significantly, so that by 2001‐02, this proportion had fallen back to 22 percent where it remains today. This change in proportion was not – as it was in some provinces ‐ simply a matter of the growth in federal aid outstripping growth in provincial aid. In Manitoba, provincial aid actually declined, although a much larger proportion was now given out in grant rather than loan.
Figure 6 – Total Assistance by Source – Manitoba ($2005)
0 20 40 60 80 100 120 140 160 180
1993-94
1994-95
1995-96
1996-97
1997-98
1998-99
1999-00
2000-01
2001-02
2002-03
2003-04
$
M
ill
io
n
s
Government of Manitoba MSF Government of Canada
Affordability Outcomes: Net Tuition in Manitoba over Time
To date, this paper has been examining changes in government expenditure levels. But how have these changes affected individual students? In order to answer this, this paper needs to examine changes in tuition, tax credits and grants. This is done below in Table 3.
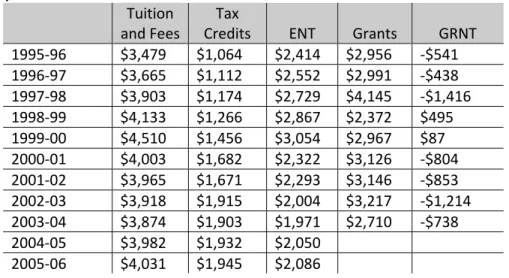
Table 3 – Changes in Tuition, Subsidies and Net Costs, Manitoba, 1995‐96 to 2005‐06 ($2005
real dollars)
Tuition and Fees
Tax
Credits ENT Grants GRNT 1995‐96 $3,479 $1,064 $2,414 $2,956 ‐$541 1996‐97 $3,665 $1,112 $2,552 $2,991 ‐$438 1997‐98 $3,903 $1,174 $2,729 $4,145 ‐$1,416 1998‐99 $4,133 $1,266 $2,867 $2,372 $495 1999‐00 $4,510 $1,456 $3,054 $2,967 $87 2000‐01 $4,003 $1,682 $2,322 $3,126 ‐$804 2001‐02 $3,965 $1,671 $2,293 $3,146 ‐$853 2002‐03 $3,918 $1,915 $2,004 $3,217 ‐$1,214 2003‐04 $3,874 $1,903 $1,971 $2,710 ‐$738 2004‐05 $3,982 $1,932 $2,050 2005‐06 $4,031 $1,945 $2,086
In the period prior to the 1999 tuition freeze, net tuition increase for grant recipients and non‐ grant recipients alike grew by about $600. Subsequently, the 10 percent roll‐back and subsequent freeze, combined with generous increases in governmental education tax credits, saw a substantial overall decline in real costs. Indeed, ENT declined by almost $1,000 (nearly 33 percent) between1999‐2000. Thus, students in 2005‐06 paid less in real dollars than they did a decade earlier, and substantially less than they did in 1999‐00.
2.5 New Brunswick
Student Assistance Expenditures to 2004
Total student assistance expenditures in New Brunswick increased by 84 percent in the decade to 2003‐04, substantially more than the national average increase of 50 percent. At the start of the decade, annual expenditures were $115 million per year; by 2003‐04, expenditures were roughly $219 million per year. Roughly half of this increase was due to an increase in need‐ based loans; most of the remainder was due to an increase in universal assistance, mainly tax benefits.
Very little of this increase can be attributed to growing post‐secondary education student numbers. The total increase in college and university students over the decade in question was between ten and 15 percent; as a result, per‐student funding increased by well over 50 percent.
Figure 7 – Total Assistance by Type – New Brunswick ($2005) -50 100 150 200 250 1993-94 1994-95 1995-96 1996-97 1997-98 1998-99 1999-00 2000-01 2001-02 2002-03 2003-04 $ M illio n s
Tax CESG Net Loans Remission Grants Merit
The distribution of student assistance by source fluctuated somewhat over the course of the decade. For the most part, the federal share of total aid stayed between 60 and 70 percent; however, in three anomalous years (1994‐95, 1995‐96 and 1998‐99), this share fell below 60 percent. This is not to say that provincial assistance fell; indeed, in absolute terms, it increased by nearly 75 percent, from $40 million to $69 million. However, this was only barely enough to keep up with the rapid increase in federal aid which was occurring throughout the decade.
Figure 8 – Total Assistance by Source – New Brunswick ($2005)
-50 100 150 200 250 1993-94 1994-95 1995-96 1996-97 1997-98 1998-99 1999-00 2000-01 2001-02 2002-03 2003-04 Government of New Brunswick MSF Government of Canada
Affordability Outcomes: Net Tuition in New Brunswick over Time
To date, the paper has been examining changes in government expenditure levels. But how have these changes affected individual students? In order to answer this, the paper needs to examine changes in tuition, tax credits and grants. This is done below in table 4.
Table 4 – Changes in Tuition, Subsidies and Net Costs, New Brunswick, 1995‐96 to 2005‐06
Tuition and Fees
Tax
Credits ENT Grants GRNT 1995‐96 $3,369 $1,118 $2,251 $734 $1,517 1996‐97 $3,652 $1,197 $2,455 $904 $1,551 1997‐98 $3,833 $1,239 $2,593 $882 $1,711 1998‐99 $4,046 $1,326 $2,719 $958 $1,761 1999‐00 $4,092 $1,439 $2,653 $1,267 $1,386 2000‐01 $4,231 $1,652 $2,579 $1,823 $755 2001‐02 $4,442 $1,706 $2,735 $1,655 $1,080 2002‐03 $4,735 $2,038 $2,697 $1,631 $1,067 2003‐04 $4,935 $2,089 $2,846 $2,108 $738 2004‐05 $5,124 $2,138 $2,986 2005‐06 $5,323 $2,189 $3,134
New Brunswick is one of the very few provinces that did not implement some kind of tuition freeze over the past decade. As a result, tuition rose by $2,000 (or about 58 percent) in the decade to 2005‐06. The growth in tax credits partially offset this increase, as the value of these credits increased by about $1,070 per student over the decade. As a result, ENT grew more slowly, by only about $900.
Students who received grants, however, were in a different situation. The average grant size rose dramatically over the decade, notably when the Canada Millennium Scholarship Foundation bursaries were introduced in 1999‐2000 and when the province increased its own bursary program in 2003. The growth in grants more than offset any growth in net tuition – as a result, students who receive grants in New Brunswick now pay substantially less than they did ten years ago. Moreover, there are substantially more grant recipients now than there were a decade ago. This means that affordability in the province has improved significantly among high‐need students over the course of the decade.
2.6 Newfoundland
and
Labrador
Student Assistance Expenditures to 2004Total student assistance expenditures in Newfoundland and Labrador in 2003‐4 were $154 million, some 60 percent more than they had been a decade earlier. This is roughly similar to the national average of a 50 percent increase over the course of the decade. Yet assistance had been much higher five years earlier in 1998‐99, total student aid spending had been $217 million, or more than of the other western provinces. Nearly all of the increase in assistance ‐ up to 1997‐98 ‐ came in the form of loans. After that, loans declined precipitously, but this was partially offset by a significant rise in tuition tax credits.
This growth in student aid has occurred in a context where post‐secondary education student numbers were falling more or less in line with the decline in the provincial youth population throughout the late 1990s. Enrolments then bounced back again around the turn of the millennium and as a result, the total enrolment increase over the decade was about ten percent. This implies that per‐student aid was up roughly 40 percent over the course of the decade.
Figure 9 – Total Assistance by Type – Newfoundland & Labrador ($2005)
0 50 100 150 200 250
1993-94 1994-95 1995-96 1996-97 1997-98 1998-99 1999-00 2000-01 2001-02 2002-03 2003-04
$
M
illio
n
s
CESG Tax Merit Net Loans Remission Grants
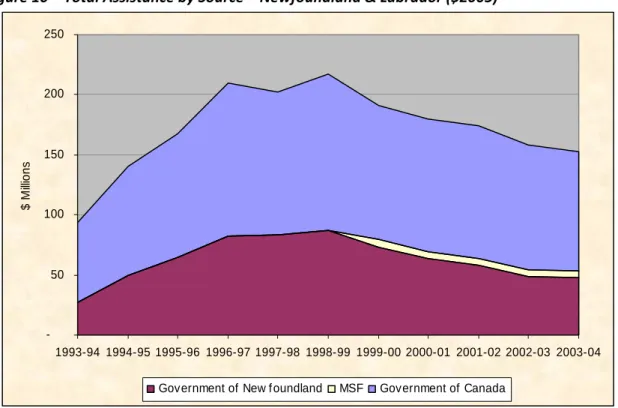
At the start of the decade in question, roughly 30 percent of all student assistance in Newfoundland and Labrador came from the provincial government. This rose to roughly 40 percent by 1998‐99. Then, as federal government expenditures increased following the 1998 budget and provincial loan payments declined as private vocational colleges were removed from the student aid rolls, the province’s share of total assistance has since declined again to about 30 percent.
Figure 10 – Total Assistance by Source – Newfoundland & Labrador ($2005)
-50 100 150 200 250
1993-94 1994-95 1995-96 1996-97 1997-98 1998-99 1999-00 2000-01 2001-02 2002-03 2003-04
$
M
illio
n
s
Government of New f oundland MSF Government of Canada
Affordability Outcomes: Net Tuition in Newfoundland and Labrador over Time
To date, this paper has been examining changes in government expenditure levels. But how have these changes affected individual students? In order to answer this, the paper needs to examine changes in tuition, tax credits and grants. This is done below in Table 5.
Table 5 – Changes in Tuition, Subsidies and Net Costs, Newfoundland and Labrador, 1995‐96 to
2005‐06
Tuition and Fees
Tax
Credits ENT Grants GRNT 1995‐96 $3,101 $1,075 $2,026 $1,410 $616 1996‐97 $3,530 $1,244 $2,286 $2,918 ‐$632 1997‐98 $4,085 $1,518 $2,567 $2,531 $36 1998‐99 $4,215 $1,671 $2,544 $2,032 $513 1999‐00 $4,324 $1,702 $2,622 $2,372 $249 2000‐01 $4,623 $1,910 $2,714 $2,827 ‐$114 2001‐02 $4,134 $1,780 $2,355 $2,891 ‐$536 2002‐03 $3,413 $1,588 $1,825 $3,027 ‐$1,202 2003‐04 $3,216 $1,536 $1,680 $2,571 ‐$891 2004‐05 $3,164 $1,522 $1,642 2005‐06 $3,070 $1,497 $1,573
Tuition and fees rose in Newfoundland and Labrador over the latter half of the 1990s. However, the provincial government’s decision to roll back tuition and then freeze it reduced costs in real
period (a natural result of the tuition reduction since credits are based in part on paid fees), but ENT still fell by $1,200, or just over 40 percent. Fluctuations in average grants meant that GRNT fell too. All students therefore benefited from more affordable education costs.
2.7 Nova Scotia
Student Assistance Expenditures to 2004
Over the decade from 1993‐94 to 2003‐04, assistance to Nova Scotia students rose by just over 50 percent ‐ that is, roughly equal to the national average – from $143 million per year to $233 million per year. The rise was caused by a number of things – growth in net loans, growth in remission programs, growth in tax credits, growth in CESGs and growth in grants. Indeed, Nova Scotia is unusual in having growth across all financial instruments. Proportionately, though, it was tax credits that rose the fastest of all instruments and accounted for approximately half the rise in total assistance.
Not all of this growth translated into increased amounts of dollars per student. Overall college and university enrolment in Nova Scotia rose by 20 percent, meaning that per‐student aid actually only increased by about 25 percent.
Figure 11 – Total Assistance by Type – Nova Scotia ($2005)
0 50 100 150 200 250
1993-94 1994-95 1995-96 1996-97 1997-98 1998-99 1999-00 2000-01 2001-02 2002-03 2003-04
$
M
illio
n
s
Tax CESG Merit Net Loans Remission Grants
In terms of the source of assistance, at the start of the decade in question, the government of Nova Scotia was responsible for over 45 percent of total assistance distributed in the province. This proportion remained more or less constant until 1998, when two things happened. First, federal expenditures began to rise as a result of the 1998 budget, and second, half the provincial
student loan client base suddenly disappeared4. The provincial share of total assistance then dropped precipitously to about 25 percent, where it remains today.
Figure 12 – Total Assistance by Source – Nova Scotia ($2005)
0 50 100 150 200 250 300
1993-94 1994-95 1995-96 1996-97 1997-98 1998-99 1999-00 2000-01 2001-02 2002-03 2003-04
$
M
illio
n
s
Government of Nova Scotia MSF Government of Canada
Affordability Outcomes: Net Tuition in Nova Scotia over Time
To date, this paper has been examining changes in government expenditure levels. But how have these changes affected individual students? In order to answer this, the paper needs to examine changes in tuition, tax credits and grants. This is done below in table 6.
4
Between 1997/98 and 1998/99, the Government of Nova Scotia managed to reduce its own student loan
rolls by nearly 50 percent in a single year. Clearly, this reduction had nothing to do with a general
reduction in the need for loans – indeed, the Canada Student Loans clientele remained effectively
unchanged during this period. In effect, the government of Nova Scotia tweaked its own eligibility criteria
Table 6 – Changes in Tuition, Subsidies and Net Costs, Nova Scotia,1995‐96 to 2005‐06
Tuition and Fees
Tax
credits ENT Grants GRNT 1995‐96 $4,279 $1,334 $2,945 $643 $2,303 1996‐97 $4,633 $1,430 $3,203 $1,612 $1,591 1997‐98 $4,949 $1,506 $3,443 $3,078 $365 1998‐99 $5,133 $1,589 $3,545 $4,447 ‐$903 1999‐00 $5,282 $1,736 $3,547 $2,324 $1,223 2000‐01 $5,584 $1,851 $3,732 $2,422 $1,310 2001‐02 $5,824 $1,913 $3,911 $2,397 $1,514 2002‐03 $6,084 $2,236 $3,848 $2,795 $1,052 2003‐04 $6,357 $2,307 $4,051 $3,622 $429 2004‐05 $6,777 $2,415 $4,363 2005‐06 $6,820 $2,426 $4,394
Nova Scotia students pay the highest university tuition fees in the country; in consequence, they also receive the largest amounts of tax credits on the country. The rise in tax credits has partially, but by no means fully, offset the increase in tuition: ENT rose by $1,450 (or nearly 50 percent) over the decade. For grant recipients, however, it is a different story. The average grant size fluctuated considerably over the decade, but in general grants increased substantially meaning students who received grants were, in the main, much better off in 2003‐04 than they were in 1995‐96. As the number of grants did not decrease (they actually increased slightly, although the source switched from primarily provincial to primarily Millennium Bursaries), what this means is that – in contrast to the average non‐grant‐recipient ‐ the average position of grant recipients improved substantially.
2.8 Ontario
Student Assistance Expenditures to 2004
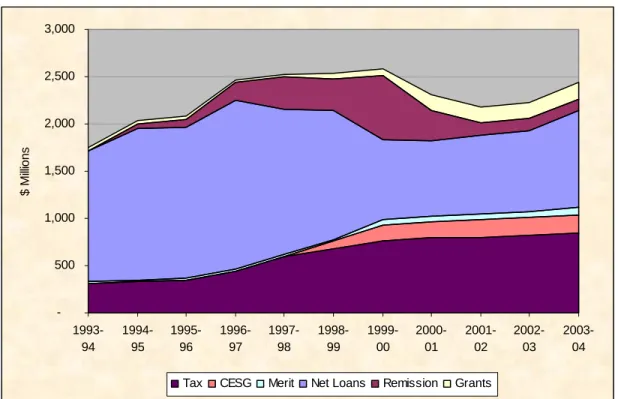
Total student assistance expenditures in Ontario increased by 39 percent between 1993‐94 and 2003‐04, somewhat less that the national average increase of 50 percent. At the start of the decade of analysis, annual expenditures were $1.7 billion per year; by 2003‐04, expenditures were roughly $2.45 billion per year. Just over 100 percent of the increase came from universal assistance sources (need‐based sources actually decreased over the decade), and roughly 70 percent of the increase in universal assistance came through tax‐based sources. Figure 13 shows total assistance available to Ontario students.
Ontario’s below‐average performance is even more pronounced when changes in post‐ secondary education student population are taken into account. Even before the double cohort, enrolment was up 15 percent ‐ with the double cohort, the increase was closer to 30 percent, meaning that per‐student assistance levels rose only minimally.
Figure 13 – Total Assistance by Type – Ontario ($2005)
-500 1,000 1,500 2,000 2,500 3,000
1993-94
1994-95
1995-96
1996-97
1997-98
1998-99
1999-00
2000-01
2001-02
2002-03
2003-04
$
M
illio
n
s
Tax CESG Merit Net Loans Remission Grants
When looking at assistance by source, we see a familiar pattern. At the start of the decade in question, the provincial government was responsible for something very close to 50 percent of all assistance. Though increasing federal aid (primarily loan aid) diluted this somewhat over the next five years, the provincial sources of assistance continued to rise in absolute terms. Then, after 1998, things changed considerably. Federal sources of assistance began to rise rapidly (as a result of the 1998 federal budget) and provincial sources began to decline (because of changes to its loan program). By 2000‐01, the provincial share of assistance had dropped to below 30 percent, where it remains today. Provincial assistance fell in both absolute and relative terms; in 2003‐04, Ontario assistance amounted to $671 million, compared to $849 million in 1993‐94, and $1,147 million in 1997‐98.
Figure 14 – Total Assistance by Source – Ontario ($2005)
0 500 1000 1500 2000 2500 3000
1993-94 1994-95 1995-96 1996-97 1997-98 1998-99 1999-00 2000-01 2001-02 2002-03 2003-04
$
M
illio
n
s
Government of Ontario MSF Government of Canada
Affordability Outcomes: Net Tuition in Ontario over Time
To date, this paper has been examining changes in government expenditure levels. But how have these changes affected individual students? In order to answer this, the paper needs to examine changes in tuition, tax credits and grants. This is done below in Table 7.
Table 7 – Changes in Tuition, Subsidies and Net Costs, Ontario, 1995‐96 to 2005‐06
Tuition and Fees
Tax
Credits ENT Grants GRNT 1995‐96 $3,684 $1,147 $2,537 $3,773 ‐$1,236 1996‐97 $4,151 $1,271 $2,881 $3,527 ‐$647 1997‐98 $4,466 $1,293 $3,172 $4,861 ‐$1,689 1998‐99 $4,873 $1,398 $3,475 $5,973 ‐$2,499 1999‐00 $5,386 $1,573 $3,813 $4,681 ‐$868 2000‐01 $5,384 $1,637 $3,747 $3,698 $49 2001‐02 $5,552 $1,681 $3,871 $2,283 $1,588 2002‐03 $5,602 $1,951 $3,651 $1,823 $1,828 2003‐04 $5,794 $1,999 $3,795 $2,599 $1,196 2004‐05 $5,690 $1,976 $3,714 2005‐06 $5,586 $1,953 $3,633
Tuition fees rose substantially in real dollars in the late 1990s before slowing at the turn of the decade and actually falling after 2003‐04 and the imposition of a two‐year tuition freeze. As elsewhere, the increase in tuition credits partially offset the rise in fees, but ENT still increases by $1,100, or about 43 percent in real terms.
With respect to net tuition charges for grant recipients, the picture is somewhat more nuanced. The vast reduction in the province’s loan remission scheme towards the end of the 1990s meant that grant recipients on average received substantially less than they previously did, and GRNT rose. However, the number of grants issued rose substantially over the decade. What this means is that people who would have received grants in 1995‐96 were noticeably worse off a decade later, but at the same time there were a large number of new grant recipients who were better off.
2.9
Prince Edward Island
Student Assistance Expenditures to 2004
Over the decade from 1993‐94 to 2003‐04, assistance to Island students nearly tripled from $15 million to $43 million annually. This is much higher than was the case nationally, where the average increase was only 50 percent. All forms of assistance increased in value – though nearly all the net increase can be attributed to the increases in net loans (189 percent) and tax credits (up 275 percent). This impressive rise in assistance was only slightly offset by the 25 percent increase in enrolments
Figure 15 – Total Assistance by Type – PEI ($2005)
0 5 10 15 20 25 30 35 40 45
1993-94 1994-95 1995-96 1996-97 1997-98 1998-99 1999-00 2000-01 2001-02 2002-03 2003-04
$
M
illio
n
s
Tax CESG Merit Net Loans Remission Residency-Based Aw ards Grants
In terms of the source of assistance, at the start of the decade in question, the provincial government was responsible for only about 26 percent of total assistance provided to students. That figure grew after the introduction of the Island Student Loan Program, but then declined again after the changes resulting from the 1998 federal budget. Overall, the provincial government accounts for 30 percent of all assistance delivered in the province, making it the
only province where the provincial government has increased its share of assistance in the past decade.
Figure 16 – Total Assistance by Source – PEI ($2005)
0 5 10 15 20 25 30 35 40 45
1993-94 1994-95 1995-96 1996-97 1997-98 1998-99 1999-00 2000-01 2001-02 2002-03 2003-04
$
M
illio
n
s
Government of PEI MSF Government of Canada
Affordability Outcomes: Net Tuition in Prince Edward Island over Time
To date, this paper has been examining changes in government expenditure levels. But how have these changes affected individual students? In order to answer this, the paper needs to examine changes in tuition, tax credits and grants. This is done below in Table 8.
Table 8 – Changes in Tuition, Subsidies and Net Costs, Prince Edward Island, 1995‐96 to 2005‐
06
Tuition and Fees
Tax
Credits ENT Grants GRNT 1995‐96 $3,940 $1,242 $2,698 $1,065 $1,633 1996‐97 $4,011 $1,261 $2,750 $1,628 $1,122 1997‐98 $4,214 $1,316 $2,898 $1,677 $1,221 1998‐99 $4,393 $1,408 $2,985 $1,766 $1,219 1999‐00 $4,510 $1,548 $2,962 $2,522 $440 2000‐01 $4,396 $1,547 $2,849 $2,712 $137 2001‐02 $4,536 $1,583 $2,953 $2,676 $277 2002‐03 $4,664 $1,872 $2,792 $2,580 $212 2003‐04 $4,840 $1,918 $2,923 $2,729 $194 2004‐05 $5,057 $1,974 $3,084 2005‐06 $5,225 $2,017 $3,208
Tuition and fees rose by about $1,300 in real dollars in the decade to 2005‐06, but rises in tax credits meant that ENT actually only rose by about $500. The introduction of the Canada Millennium Scholarship Foundation Bursaries massively increased the size and number of grants issued in the province, and as a result GRNT was reduced significantly over the decade. In short, net tuition decreased for grant recipients but increased for everyone else.
2.10 Québec
Student Assistance Expenditures to 2004
Over the decade from 1993‐94 to 2003‐04, assistance to Québec post‐secondary education students increased by about 20 percent from $1.05 billion to $1.25 billion. This is much lower than was the case nationally, where the average increase was 50 percent; on the other hand, since there were no tuition increases for Québec students, there were fewer cost pressures driving up the demand for assistance in this period. However, this overall increase masks some volatility in the composition of assistance. Need‐based assistance was down over the decade; universal assistance was up. In particular, tax credits were up and loans were down. Grants, which make up roughly a third of all aid in Québec, were also up slightly in 2003‐04 compared to 1993‐94, but this was anomalous – in most years of the decade, total grants were lower than they were in 1993‐94.
All of this occurred in a context of relatively stagnant enrolments. Student numbers fell through to about 2001, after which time enrolments recovered.
Figure 17 – Total Assistance by Type – Québec ($2005)
0 200 400 600 800 1000 1200 1400
1993-94 1994-95 1995-96 1996-97 1997-98 1998-99 1999-00 2000-01 2001-02 2002-03 2003-04
$
M
illio
n
s
Tax CESG Merit Net Loans Remission Grants
In terms of the source of assistance, the combination of declining need‐based assistance with increasing universal assistance has meant that a greater portion of the aid that reaches students in Québec is coming from the Government of Canada rather than from the provincial government. The province’s share of total assistance was roughly 92 percent in 1993‐94; by 2003‐04, it had fallen to just 55 percent. This evolution is shown in Figure 18.
Figure 18 – Total Assistance by Source –Québec ($2005)
0 200 400 600 800 1000 1200 1400
1993-94 1994-95 1995-96 1996-97 1997-98 1998-99 1999-00 2000-01 2001-02 2002-03 2003-04
$
M
illio
n
s
Government of Quebec MSF Government of Canada
However, it should be noted that not all provincial expenditures on student assistance in Québec actually come from provincial sources of income, as it does in other provinces. As noted earlier, the Government of Canada transfers a sum of money annually (known as the “Alternative Payment”) to help the province offset its program costs. The effects of these transfers are not shown in Figure 18 because it shows the source of money as it is delivered to students.
However, if we examine actual expenditures and include the province’s Alternative Payment in the “federal” column rather than the provincial one, a very different picture emerges. In 1993‐ 94, the Alternative payment to Québec was $142 million; in 2003‐04, it was $256 million (Alternative Payments, which are essentially calculated as a fraction of total Canada Student Loan Program (CSLP) payments, have grown in line with the growth in CSLP expenditures). The results can be seen below in Table 9, and they present a very different picture than that shown in Figure 18
Taking into account the Alternative Payment, it turns out the Government of Québec’s “own‐ source” spending on all forms of transfers for post‐secondary education dropped by one percent over the decade, making Québec the only province in the country where this occurred. However, since this spending included a doubling of universal expenditures, the drop in
spending on need‐based aid is even steeper: Québec’s own‐source provincial spending on student aid was 18 percent less in 1993‐94 than it was in 2003‐04.
Overall, it appears the combination of increased federal spending and decreased provincial spending made for a dramatic shift in student aid spending. As of 2003‐04, the Government of Canada is actually responsible for 65 percent of all student aid dollars in Québec, and 55 percent of all need‐based assistance dollars. Over the ten years in question, the two governments’ relative share of spending in Québec has gone from 70 percent to 30 percent in favour of the province to 65 percent to 35 percent in favour of the federal government. This is a remarkable turnaround in so short a space of time, and certainly a more dramatic shift than that seen in any other province.
Table 9 – Total Government Expenditures on Student Financial Assistance – Québec, correcting
for Alternative Payments – 1993‐94 to 2003‐04
Total Expenditures by Source and Type ($Millions, $2005) ‐ Québec ‐ 2003‐04
Government of
Canada Government of Québec Total
Fed/Prov
Share (%)
Need Based $333 $276 $609
38 % / 62 %
Merit $34 $0 $34 100% / 0%
Universal $345 $106 $452 76% / 24%
Total $712 $382 $1,095 65% / 35%
Total Expenditures By Source and Type ($Millions, $2005) ‐ Québec – 1993‐94
Government of
Canada Government of Québec Total
Fed/Prov
Share (%)
Need Based $142
$335 $477 23 % / 77%
Universal $80 $51 $131 61% / 39%
Total $222 $386 $608 30% / 70%
% Change in Government Expenditures Between 1993‐94 and 2003‐04
Government of
Canada Government of Québec Total
Need‐Based 135% ‐18% 28%
Merit n/a 0% n/a
Universal 331% 108% 244%
Total 221% ‐1% 80%
Affordability Outcomes: Net Tuition in Québec over Time
To date, this paper has been examining changes in government expenditure levels. But how have these changes affected individual students? In order to answer this, the paper needs to
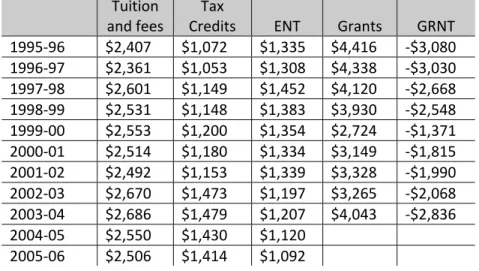
Table 10 – Changes in Tuition, Subsidies and Net Costs, Québec, 1995‐96 to 2005‐06
Tuition and fees
Tax
Credits ENT Grants GRNT 1995‐96 $2,407 $1,072 $1,335 $4,416 ‐$3,080 1996‐97 $2,361 $1,053 $1,308 $4,338 ‐$3,030 1997‐98 $2,601 $1,149 $1,452 $4,120 ‐$2,668 1998‐99 $2,531 $1,148 $1,383 $3,930 ‐$2,548 1999‐00 $2,553 $1,200 $1,354 $2,724 ‐$1,371 2000‐01 $2,514 $1,180 $1,334 $3,149 ‐$1,815 2001‐02 $2,492 $1,153 $1,339 $3,328 ‐$1,990 2002‐03 $2,670 $1,473 $1,197 $3,265 ‐$2,068 2003‐04 $2,686 $1,479 $1,207 $4,043 ‐$2,836 2004‐05 $2,550 $1,430 $1,120
2005‐06 $2,506 $1,414 $1,092
Tuition and fees stayed roughly constant in real dollars over the decade in question, with reduction in real tuition offset by significant increases in various forms of mandatory fees. Substantial increases in federal tax credits led to a reduction in ENT of about $250. However, reductions in grants meant that GRNT actually increased by about $150.
2.11 Saskatchewan
Student Assistance Expenditures to 2004
Total student assistance expenditures in Saskatchewan rose by about 80 percent over the decade to 2003‐04. This is substantially more than the national average of 50 percent, but less than some of the other western provinces. At the start of the decade, annual expenditures were $153 million per year; by 2003‐04, expenditures were roughly $253 million per year. None of this increase was due to an increase in net loans – indeed, these declined over the decade. Three‐quarters of the increase was due to an increase in tax credits; the remainder was due in equal measure to an increase in remission and the introduction of the CESG program. Because enrolment was effectively unchanged over the decade, these changes in total expenditures were mirrored at a per‐student level.
Figure 19 – Total Assistance by Type – Saskatchewan ($2005)
0 50 100 150 200 250 300
1993-94
1994-95
1995-96
1996-97
1997-98
1998-99
1999-00
2000-01
2001-02
2002-03
2003-04
Tax CESG Merit Net Loans Remission
As in most other provinces, the distribution of student assistance by source changed over this decade. At the outset of the decade, roughly 47 percent of all aid in Saskatchewan came from the provincial government. This stayed roughly constant until 1998, when increases in federal tax expenditures started to erode the provincial share of assistance. By 1999, the provincial share had dropped to 32 percent, since which time it has continued to drop slightly and now sits at 29 percent.
Figure 20 – Total Assistance by Source – Saskatchewan ($2005)
0 50 100 150 200 250 300
1993-94 1994-95 1995-96 1996-97 1997-98 1998-99 1999-00 2000-01 2001-02 2002-03 2003-04
$
M
illio
n
s
Government of Saskatchew an MSF Government of Canada
Affordability Outcomes: Net Tuition in Saskatchewan over Time
To date, this paper has been examining changes in government expenditure levels. But how have these changes affected individual students? In order to answer this, the paper needs to examine changes in tuition, tax credits and grants. This is done below in Table 11.
Table 11 – Changes in Tuition, Subsidies and Net Costs, Saskatchewan, 1995‐96 to 2005‐06
Tuition and Fees
Tax
Credits ENT Grants GRNT 1995‐96 $3,471 $1,048 $2,423 $3,409 ‐$986 1996‐97 $3,564 $1,072 $2,492 $3,772 ‐$1,280 1997‐98 $3,860 $1,147 $2,712 $3,888 ‐$1,176 1998‐99 $4,258 $1,290 $2,968 $3,330 ‐$361 1999‐00 $4,386 $1,405 $2,981 $2,547 $434 2000‐01 $4,606 $1,852 $2,754 $2,159 $595 2001‐02 $4,808 $1,906 $2,902 $2,367 $535 2002‐03 $5,167 $2,259 $2,908 $2,300 $608 2003‐04 $5,484 $2,345 $3,139 $2,162 $977 2004‐05 $5,690 $2,400 $3,290 2005‐06 $5,517 $2,354 $3,164
Tuition rose very rapidly in Saskatchewan in the decade in question. So, too, did the value of education tax credits, in part because provincial tax rates were significantly higher than in the rest of Canada. As a result, even though tuition and fees rose by $2,100 in real terms, two‐thirds of this was offset through tax credits, meaning ENT rose by a much smaller $700.
GRNT rose substantially, too, due to a decrease in average grant size. In large measure, though, this is a statistical chimera; the average number of grants more than quadrupled, and many students now receive more than one grant. Average grants received have actually probably increased, not decreased though this cannot be portrayed with the data currently available.