A note on value relevance of mark-to-market values
of energy contracts under EITF Issue No. 98-10
Li Li Eng
a,*, Shahrokh Saudagaran
b, Sora Yoon
caMissouri University of Science and Technology, Department of Business and Information Technology, 102 Fulton Hall, Rolla, MO 65409, USA
b
University of Washington – Tacoma, Milgard School of Business, 1900 Commerce Street, Tacoma, WA 98402, USA c
Ajou University, Suwon, Kyonggi, Korea
a r t i c l e
i n f o
Keywords: Mark-to-market Fair values Book values Energy contractsa b s t r a c t
This paper examines whether marked-to-market values of energy trading assets and liabilities of companies that enter into energy contracts are related to market value of equity. The Emerging Issues Task Force of the Financial Accounting Standards Board ruled in November 2002 to ban the use of mark-to-market accounting for energy contracts out of concern that fair values can be easily inflated. We find that the excess of fair value over ori-ginal value of energy trading assets and energy trading liabilities is not relevant for valuation. It may be inferred that fair values which are subject to management estimates and not verifiable are poor signals of worth and performance (Watts, R., 2003. Conservatism in accounting Part I: Explanations and implications. Accounting Horizons 17, 207–221).
Ó2009 Elsevier Inc. All rights reserved.
1. Introduction
The debate over fair values or historical costs has become increasingly intense. In June 2005, the Securities Exchange Commission (SEC) endorsed fair value accounting (The Economist, July 30th
2005, p. 14, 65). The Financial Accounting Standards Board (FASB) has also issued guidelines for
apply-ing fair value accountapply-ing (example, FAS 157 on Fair Value Measurement (FASB, 2007a), and FAS 159 on The Fair Value Option for Financial Assets and Financial Liabilities (FASB, 2007b)). Proponents of fair values argue that they are more relevant than historical costs. However, critics of fair values are con-cerned about the reliability of fair value measures as they are more heavily based on estimates (The
0278-4254/$ - see front matterÓ2009 Elsevier Inc. All rights reserved. doi:10.1016/j.jaccpubpol.2009.04.004
*Corresponding author. Tel.: +1 573 341 4594; fax: +1 573 341 4812.
E-mail addresses:engl@mst.edu(L.L. Eng),shahrokh@u.washington.edu(S. Saudagaran),yoonsora@ajou.ac.kr(S. Yoon).
Contents lists available atScienceDirect
J. Account. Public Policy
Economist, July 30th 2005, pp. 65–66). Empirical evidence indicates that management estimates are in error or misstated (Noland et al., 1998; Beaver and McNichols, 2001; Lehavy, 2002), subject to manip-ulation (Bergstresser et al., 2006), and do not improve the quality of financial information (Lev et al., 2009).
This paper examines whether marked-to-market values of energy trading assets and liabilities of companies that enter into energy contracts are relevant for establishing market value of equity. Energy trading companies enter into contracts for the purchase and sale of energy commodities. In addition, these energy contracts have been entered into for the purpose of speculating on market movements and for trading purposes. In October1998, the Emerging Issues Task Force (EITF) of the Financial Accounting Standards Board (FASB) released EITF Issue No. 98-10 (FASB, 2000). The Task Force reached a consensus that energy trading contracts should be marked-to-market (that is, measured at fair value as of the balance sheet date) with the gains and losses included in earnings and separately disclosed in the financial statements.
EITF Issue No. 00-17 reiterated that the estimate of fair value should be based on the best informa-tion available in the circumstances. Where quoted market prices are not available for these contracts, companies must use other techniques to estimate fair value. The discussion note of EITF Issue No. 00-17 states, ‘‘When available, current market transactions provide the basis for estimating subsequent changes in fair value. Valuation models, including option pricing models, should be used only when market transactions are not available to evidence fair values. When valuation models are used, the Task Force noted that the best information available would consider, but is not limited to, recent spot prices and forward prices, and for option pricing models, the volatility implied by recent transactions, when available, or the historical volatility of the commodities and/or services underlying the contract.”1
A series of events led to EITF Issue No. 98-10 being rescinded in November 2002. EITF Issue No. 02-3
(FASB, 2002) ruled to ban the use of mark-to-market accounting on contracts to deliver and store
energy entered into after October 25, 2002. ‘‘Under mark-to-market accounting, companies can book the estimated profits of a long-term energy contract, which could take years to settle, immediately. Analysts have condemned the practice, saying the value of those contracts could easily be inflated with generous assumptions about prices and other market conditions. Enron Corp., Williams and oth-ers have been accused of using unrealistic assumptions to boost the mark-to-market value of their trading transactions. . .The Securities and Exchange Commission pushed for the change following the collapse of Enron, once the world’s biggest energy trader. The action is an effort to restore credi-bility to an industry plagued by a series of trading and accounting scandals. . .The FASB is trying to end an extremely embarrassing period for itself and the accounting profession.” –Ray (2002), Tulsa World, November 6, 2002. E1, E2.
The implication of the EITF ruling to ban mark-to-market accounting is that mark-to-market accounting is subject to manipulation,2and therefore, may not be value relevant. That is, fair value of
such assets and liabilities may not be associated with market value of the firm. In this paper, we examine this empirical issue of whether fair values of energy assets and liabilities are associated with market val-uation. This paper contributes to research on understanding alternative accounting numbers, and an understanding of accounting of energy trading firms. We contribute to extant studies on market valua-tion of disclosures such as SFAS No. 33 on current cost accounting (for example,Beaver and Landsman, 1983; Beaver and Ryan, 1985, 1987; Bublitz et al., 1985; Haw and Lustgarten, 1988; Hopwood and
Schae-fer, 1989; Lobo and Song, 1989;Murdoch, 1986), SFAS No. 107 on fair value of financial instruments (for
example,Barth et al., 1996; Eccher et al., 1996;Nelson, 1996), market valuation of recognized fair values of derivative financial instruments relative to disclosed values (Ahmed et al., 2006), and risk relevance of
1
Industry practices indicate that energy traders value contracts at quoted prices in active (liquid) markets. Where markets are less active (illiquid), valuation techniques such as Black Scholes and Monte Carlo simulations are used. Key inputs in the valuation process include determining volatility of commodity prices and estimating future cash flows, which are subject to a certain degree of uncertainty.
2
Example, ‘‘Williams Cos. Inc. lost $814.5 million, or $1.59 a share in the first quarter [of 2003], chiefly due to the accounting change which bars companies from booking the estimated profits of certain long-term energy contracts, and requires energy companies to book those profits as they are accrued.” –Ray (2003), Tulsa World, May 14, 2003. E1, E8.
full-fair-value income of commercial banks relative to net income and comprehensive income (Hodder et al., 2006).
EITF Issue No. 02-3 to rescind EITF Issue No. 98-10 raises the empirical question of whether fair values of energy contracts are value-relevant in establishing share prices. To examine whether mark-to-market energy assets and liabilities are value-relevant, we regress market value of equity on net income, original values of net energy assets and book value of net non-trading assets, and the excess of fair value over the original value of energy assets and liabilities. We find that market valuation is positively related to original values of energy trading assets and book values of non-trading assets. We find that the excess of fair value over original value of energy non-trading assets and liabilities is not value-relevant. Similar toNelson (1996)andEccher et al. (1996), we conclude that fair values of marked-to-market assets and liabilities are generally not value relevant. Thus, it appears that the market does not place a higher (lower) value on the firms when fair value of energy trading assets (liabilities) exceeds its original value.
The EITF was concerned that fair values of energy contracts can be easily inflated (manipulated), and mark-to-market accounting may lead to the market being misled. The evidence indicates that unverifiable valuations are actually not relevant for valuation (Watts, 2003, p. 219). We conjecture that the market may have shared concerns of the EITF regarding fair values of energy assets and lia-bilities of the sample firms in our study. Thus, these fair values are not incorporated into market val-uation of the sample firms.
The paper is organized as follows. Section 2 reviews prior literature on valuation of current cost accounting and fair value disclosures of bank assets and liabilities. Section 3 describes the hypotheses and methodology employed to test value-relevance of fair value accounting. Section 4 describes sam-ple selection and the data. The results are contained in Section 5. Finally, Section 6 concludes with a summary of the paper.
2. Prior research
SFAS No. 33 requires disclosures of current cost operating income.Beaver and Ryan (1985) exam-ine the ability of various earnings measures derived from SFAS 33 data to explain stock returns. They find that no one SFAS 33 variable adds significant explanatory power consistently to the earn-ings-returns model. Contrasting results are obtained inBublitz et al. (1985), Murdoch (1986) and
Lobo and Song (1989). Bublitz et al. (1985) find significant explanatory power for SFAS 33 data
above that provided by historical earnings.Murdoch (1986)shows that purchasing power returns on equity do show incremental information content but constant dollar, current cost, and net hold-ing returns do not exhibit information content incremental to historical cost returns in explainhold-ing security price changes. The findings inLobo and Song (1989)also indicate that SFAS 33 income mea-sures have incremental information over historical cost income and its cash and accrual component for a subset of the industries examined.Bernard and Ruland (1987)show evidence of incremental information content of current cost income where the correlation between unexpected historical cost income and unexpected current cost income is lowest. The tests in Hopwood and Schaefer
(1989)suggest the existence of differential responses across firms depending on the firms’ ability
to respond to cost increases.
More recent studies examine the fair value disclosures of banks assets and liabilities.Barth et al.
(1996)examine the value-relevance of banks’ fair value disclosures under SFAS No. 107. They find that
fair value estimates of bank assets and liabilities disclosed under SFAS No. 107 provide significant explanatory power for bank share prices beyond that provided by related book values. Nelson
(1996)also examines the association between the market value of banks’ common equity and fair
va-lue estimated disclosures under SFAS No. 107. Contrary toBarth et al. (1996), Nelson finds that only the reported fair values of investment securities have incremental explanatory power relative to book value. There is no evidence of incremental explanatory power for the fair value disclosures of loans, deposits, long-term debt or net off-balance sheet financial instruments.Eccher et al. (1996)also obtain evidence that fair value disclosures for financial instruments other than securities are value-relevant only in limited settings.
Ahmed et al. (2006)examine investor valuation of derivative financial instruments depending on whether the fair value of these instruments is recognized or disclosed. They find that recognized deriv-atives are value-relevant but disclosed derivderiv-atives are not.Hodder et al. (2006)investigate the risk rel-evance of the volatility of net income, comprehensive income and full-fair-value income of a sample of US commercial banks. They find that full-fair-value income has more volatility relative to comprehen-sive income and net income, and this incremental volatility is reflected in capital-market pricing of that risk.
This paper extends prior research on information content of current cost income and fair value dis-closures of financial instruments. Specifically, we examine the value-relevance of fair value disdis-closures of energy trading assets and liabilities under EITF Issue No. 98-10.
3. Hypotheses and methodology
This paper examines whether fair values of energy trading assets and liabilities are value-relevant. We run a model with market value of equity regressed on net book value of non-trading assets and liabilities, net original value of energy trading assets and liabilities, excess of fair value over original value of energy trading assets and liabilities, and net income.3This model is derived from theOhlson (1995)model.4
MVit¼
a
0þa
1NIitþa
2BVitþe
it ð1Þwhere MV is market value of equity, NI is net income and BV is book value of equity. From (1),
MVit¼
a
0þa
1NIitþa
2ðBVAitBVLitÞ þe
itMVit¼
a
0þa
1NIitþb1ðBVNTAitBVNTLitÞ þb2ðBVTAitBVTLitÞ þe
itMVit¼
a
0þa
1NIitþb1ðBVNTAitBVNTLitÞ þb3ðOVTAitOVTLitÞ þb4ðETAitETLitÞ þe
it MVit¼a
0þa
1NIitþb1NetNTAitþb3NetTAitþb5ETAitþb6ETLitþe
itð2Þ where BVA is book value of total assets, BVL is book value of total liabilities, BVNTA is book value of non-trading assets, BVNTL is book value of non-trading liabilities, BVTA is book value of trading assets, BVTL is book value of trading liabilities, OVTA is original value of trading assets at time of inception, OVTL is original value of trading liabilities at time of inception, NetNTA is book value of non-trading assets less book value of non-trading liabilities, NetTA is original value of trading assets less original value of trading liabilities, ETA is excess of fair value over original value of energy trading assets, and ETL is excess of fair value over original value of energy trading liabilities. The coefficient,b3, measures the value relevance of the original values of net trading assets.b5andb6measure the value relevance of change in fair values over original value of energy trading assets (ETA) and liabilities (ETL), respec-tively. Our predictions of the coefficients are limited to their signs with the null hypothesis that the coefficients on ETA and ETL equal zero. That is, if fair values are being used by the market, then excess of fair value over original value of energy trading assets (liabilities) is expected to be positively (neg-atively) associated with market value of equity. Hence, our hypotheses are:
H1: The excess of fair value over original value of energy trading assets is positively associated with market value of equity.
3 Original value is the fair value of the energy contracts at the time of inception of the contracts. 4
Empirical research applying this model includesHarris and Kemsley (1999)andHanlon et al. (2003).Barth et al. (1996),Nelson (1996)and Eccher et al. (1996) use alternate models to examine the value-relevance of banks’ fair value disclosures under SFAS No. 107. They model the excess of market value of equity over book value of equity as a linear function of the cumulative excess of fair value over book value of each asset and liability. In the case of SFAS No. 107 disclosures, loans, deposits, long-term debt, etc. are not market on the balance sheet; in the case of EITF Issue No. 98–10, energy trading assets and liabilities are marked-to-market on the balance sheet. We consider theOhlson (1995)model more appropriate to examine the issue of value relevance of fair values of energy trading assets and liabilities that are recognized on the balance sheet than the models inBarth et al. (1996), Nelson (1996)andEccher et al. (1996).
H2: The excess of fair value over original value of energy trading liabilities is negatively associated with market value of equity.
The focus of this paper is on the value-relevance of fair values of energy assets and liabilities. Appendix A contains an excerpt from Cleco Power LLC, year 2002 10-K Annual Financials that illus-trates the footnote disclosure of the original amounts and fair values of energy market positions. As at December 31, 2002, Cleco Power LLC had energy assets with a original value of $20.793 million and fair value of $24.457 million, and energy liabilities with a original value of $32.652 million and fair value of $37.239 million. Cleco Power LLC discloses that the fair values of energy market positions may be based on market prices which are verifiable, and management estimates which are not veri-fiable.5Fair values of energy trading assets and liabilities may be largely unverifiable. Asset measures
that involve unverifiable estimates are open to considerable manipulation (Holthausen and Watts, 2001). Unverifiable fair value measures are not efficient signals of worth and performance (Watts, 2003). The empirical issue is whether fair values are informative to the market, or whether they are inef-ficient signals. If mark-to-market accounting results in accounting measures that are closer to the under-lying fundamental value, these fair values will be value-relevant. Alternatively, if management manipulates the estimates of fair values, these fair values will not be value-relevant.
4. Sample and data
4.1. Sample selection
We obtain a list of the top ten energy trading firms through a keyword search of ‘‘energy trading firms” in Google. We then obtain companies with the same 4-digit SIC code in Compustat. The SIC codes are 4911 (Electric Services), 4922 (Natural Gas Transmission), 4923 (Natural Gas Transmission and Distribution), 4931 (Electric and Other Services Combined), 4991 (Cogeneration-SM Power Pro-ducer) and 5172 (Petroleum and Petroleum Products Wholesales, except Bulk Stations). We then ob-tain the annual reports of the companies for the period 1995–2001 from the companies’ websites or SEC-Edgar.6The sample consists of 156 firm-years for which we are able to obtain annual reports. The
number of observations obtained for each year is as follows:
2001 44 2000 26 1999 24 1998 21 1997 15 1996 14 1995 12
From the annual reports, we obtain data for shares outstanding, book value of equity, fair value of en-ergy trading assets, original value of enen-ergy trading assets, fair value of enen-ergy trading liabilities, ori-ginal value of energy trading liabilities, book value of total assets and book value of total liabilities.
5
In reviewing the footnotes to the 2001 annual reports of 64 sample firms, we note that none of the firms based fair value solely on market price, 11 percent of the firms based fair values on management estimates, and 70 percent on both market price and management estimates; we were not able to ascertain the valuation basis for 19 percent of the firms from their disclosures.
6
Discussions with Thomas Sell and J. Kevin Vann of Williams Company indicate that fair value accounting of energy trading contracts may have begun as early as 1991. Since mark-to-market accounting for energy contracts was promoted through EITF Issue No. 98–10, we decided on a sample period from 1995 through 2001 for two reasons. First, we have three years before and three years after 1998 when the practice was officially sanctioned. Second, we get fewer annual reports as we move back through the years.
5. Descriptive statistics
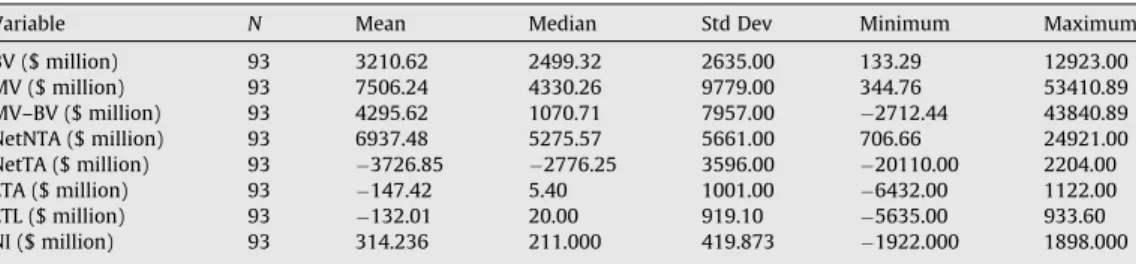
Table 1presents the descriptive statistics of the sample variables. The average book value of equity
of the sample firms is $3210.62 million (median = $2499.32 million). The mean market value of equity is $7506.24 million (median = $4330.26 million). Thus, the average market value less book value of equity is $4295.62 million (median = $1070.71 million). The average book value of net non-trading as-sets is $6937.48 million (median = $5275.57 million). On average, the firms in the sample report ori-ginal value of net trading assets equal $3726.85 (median =$2776.25 million). That is, energy trading liabilities are greater than energy trading assets for our sample during the sample period. We find that the average fair value of energy trading assets is less than its original value with a mean difference of$147.42 million (median = $5.4 million). The fair value of energy trading liabilities is also less than its original value; the mean difference is$132.01 million (median = $20.0 million). Sample firms report average net income of $314.236 million (median = $211.0 million).
Table 1
Descriptive statistics of variables.
Variable N Mean Median Std Dev Minimum Maximum
BV ($ million) 93 3210.62 2499.32 2635.00 133.29 12923.00 MV ($ million) 93 7506.24 4330.26 9779.00 344.76 53410.89 MV–BV ($ million) 93 4295.62 1070.71 7957.00 2712.44 43840.89 NetNTA ($ million) 93 6937.48 5275.57 5661.00 706.66 24921.00 NetTA ($ million) 93 3726.85 2776.25 3596.00 20110.00 2204.00 ETA ($ million) 93 147.42 5.40 1001.00 6432.00 1122.00 ETL ($ million) 93 132.01 20.00 919.10 5635.00 933.60 NI ($ million) 93 314.236 211.000 419.873 1922.000 1898.000 BV = book value of common equity;
MV = market value of common equity;
MV–BV = market value less book value of common equity;
NetNTA = book value of non-trading assets less book value of non-trading liabilities; NetTA = original value of trading assets less original value of trading liabilities; ETA = fair value less original value of energy trading assets;
ETL = fair value less original value of energy trading liabilities; and NI = net income.
Table 2
Pearson Correlation Analysis of Variables. (Number of observations = 93).
MV NetNTA NetTA ETA ETL NI
MV 1.000 0.720 0.576 0.052 0.059 0.539 (0.0) (<0.0001) (<0.0001) (0.618) (0.575) (<0.0001) NetNTA 1.000 0.934 0.066 0.155 0.549 (0.0) (<0.0001) (0.531) (0.139) (<0.0001) NetTA 1.000 0.071 0.067 0.380 (0.0) (0.499) (0.524) (0.000) ETA 1.000 0.890 0.233 (0.0) (<0.0001) (0.024) ETL 1.000 0.050 (0.0) (0.638) NI 1.000 (0.0) MV = market value of common equity;
NetNTA = book value of non-trading assets less book value of non-trading liabilities; NetTA = original value of trading assets less original value of trading liabilities; ETA = fair value less original value of energy trading assets;
ETL = fair value less original value of energy trading liabilities; and NI = net income.
6. Results
6.1. Correlation analysis
Table 2presents the correlation analysis results. The correlation analysis shows that market value
is positively correlated with book value of net non-trading assets (
q
= 0.720) but negatively correlated with original value of net trading assets (q
=0.576). Note that original value of net trading assets is negative inTable 1. Market value is not highly correlated with excess of fair value over original value of energy trading assets (q
=0.052) and excess of fair value over original value of energy trading lia-bilities (q
=0.059). The univariate relations do not support the alternative hypotheses that fair value of energy trading assets (liabilities) is positively (negatively) associated with market value of equity. Market value has a positive correlation with net income (q
= 0.539). Thus, market value is correlated with book value and net income but not fair value. Other variables that have significant correlations are net non-trading assets with net trading assets and net income, net trading assets and net income, excess of fair value over original value of energy trading assets and net income.6.2. Regression analysis
Table 3presents the results of regression model in Eq. (2). We regress market value on net income,
net book value of non–trading assets and liabilities, net original value of energy trading assets and lia-bilities, and excess of fair value over original value of energy trading assets and liabilities. Column 2 presents the results for the pooled sample for the period 1995–2002. The coefficient on net income (
a1
) is not significant. Current period fair value gains and losses on energy trading contracts are in-cluded in net income, and have not been separately measured in our model. To the extent that fair value gains and losses are of lower relevance, including these amounts in net income would bias the results to finding lower significance for net income.The variables significant in explaining market valuation are book values of net non-trading assets (b1= 2.484,t-statistic = 4.81) and net energy trading assets (b3=2.158,t-statistic = 3.24).b5andb6, the coefficients on excess of fair value over original value of energy trading assets and energy trading lia-bilities, are not significantly different than zero. The evidence indicates that market valuation does not reflect the excess of fair values reported of energy trading assets and liabilities over the original values. The relation betweenb1,b3andb5(b6) may reflect the proportion of prepaid contracts in a company’s energy trading operations.b1is the market’s valuation coefficient on ‘‘historical cost.” Assume that the market values all historical cost book values atb1. The market values fair value gains atb5(assumed and appears to be equal tob6).b3would then roughly be equal to
cb1
+ (1c
)b5, wherec
is the pro-portion of prepaid contracts. Our slope estimate for NetTA is consistent with this intuition.7Column 3 presents the regression results for the sample with outliers removed from the sample (defined as observations with an absolute value for the studentized residual greater than three or Cook’s distance measure greater than one). The results remain qualitatively similar.
Column 4 presents the regression results with the variables scaled by number of shares. Market va-lue per share (price) is positively associated with net income. The coefficients on ETA per share and ETL per share are not significantly different than zero. That is, share price does not reflect the change in fair value of energy trading assets and liabilities. The adjustedR2is lower for the regression model when the variables are scaled by number of shares. The adjustedR2reported here is after we clustered standard errors at the firm level.8
To summarize, the market values of our sample energy trading firms do not reflect the excess of fair value over original value of energy trading assets and liabilities. The findings that fair values of energy trading assets and liabilities are not valued by the market are similar to the findings in some prior
7
We thank a reviewer for suggesting this interpretation. 8
We use Proc Surveyreg in SAS for this regression. We also compare the correlation matrices of the level variables versus the per-share variables. Some correlations are lower or not significant for the per-share variables relative to the levels variables, example: book value per share of non-trading assets and trading assets are not significantly correlated with share price. This may be a reason for the adjusted R2
research on the explanatory power of SFAS No. 33 disclosures of current cost operating income (for example,Beaver and Ryan, 1985) and value-relevance of banks’ fair value disclosures under SFAS No. 107 (for example,Nelson, 1996andEccher et al., 1996). The market may be aware that some fair values of energy trading assets and liabilities reflect quoted market prices of these assets and liabili-ties, and others are best estimates obtained from valuation models, which are not incorporated into the value of share equity. Thus, fair values that are unverifiable are not informative of the value of the firm (Watts, 2003). However, the results in our paper are subject to several caveats. First, it is pos-sible that omitted variables in our model specification may have resulted in non-significant coeffi-cients for our key variables. Liu and Thomas (2000) observe that omitted variables result in coefficient estimates that are biased and regressions that have low explanatory power.Barth et al.
(1996)note that an explanation forNelson’s (1996)findings of non-significance for the SFAS 107 fair
value estimates is due to important variables omitted fromNelson’s (1996)model specification. Sec-ond, another limitation of this paper is the small sample size resulting in a lack of power in our tests. Third, many of the companies mention in their annual reports that they use energy contracts for hedg-ing purposes. For example, Aquila mentions,
‘‘We trade energy commodity contracts daily. Our trading activities attempt to match our portfolio of physical and financial contracts to current or anticipated market conditions. Within the trading portfolio, we take certain positions to hedge physical sale or purchase contracts and we take certain positions to take advantage of market trends and conditions. We record most energy contracts – both physical and financial – at fair value. Changes in value are reflected in the consolidated statement of income. We use all forms of financial instruments, including futures, forwards, swaps and options. Each type of financial instrument involves different risks. We believe financial instruments help us manage our contractual commitments, reduce our exposure to changes in cash market prices and take advantage of selected arbitrage opportunities. We refer to these transactions as price risk manage-ment activities.”
These hedging activities to offset fluctuations may explain why fair values of energy trading assets and liabilities are not priced by the market.
Table 3
Regression of Market Value Value on Net Income, Book Value of Assets and Liabilities, and Excess of Fair Value Over Original value of Energy Trading Assets and Liabilities (t-statistics are in parentheses).
MVit¼a0þa1NIitþb1NetNTAitþb3NetTAitþb5ETAitþb6ETLitþeit ð2Þ Pooled sample
(1995–2002)
Pooled sample with outliers removed (1995–2002)
Pooled sample with outliers removed (1995–2002) (scaled by number of shares)
Intercept 2005.637* 1012.576 25.493*** (2.46) (1.49) (6.84) NI 1.576 1.364 2.550*** (0.92) (0.85) (3.52) NetNTA 2.484*** 1.874*** 0.111 (4.81) (4.15) (0.50) NetTA 2.158*** 1.486*** 0.167 (3.24) (2.41) (0.54) ETA 0.604 0.603 0.368 (0.33) (0.45) (1.14) ETL 0.627 1.200 0.153 (0.37) (0.90) (0.64) Adj R2 0.5861 0.6514 0.1291 Number of observations 93 91 91
MV = market value of equity; NI = net income;
NetNTA = book value of non-trading assets less book value of non-trading liabilities; NetTA = original value of trading assets less original value of trading liabilities; ETA = excess of fair value over original value of energy trading assets; and ETL = excess of fair value over original value of energy trading liabilities.
6.3. Sensitivity analyses
6.3.1. Regression of market value on excess of fair value over original value of net energy trading assets
We run Eq. (2) with excess of fair value over original value of energy trading assets and liabilities combined as a single variable, instead of energy trading assets and energy trading liabilities as two separate variables, that is:
MVit¼
a
0þa
1NIitþb1NetNTAitþb3NetTAitþb5ðETAitETLitÞ þe
itWe obtain similar results. The excess of fair value over original value of net energy trading assets and liabilities (ETA–ETL) remains not significantly related to market value. The adjustedR2is 0.6501 for this model compared with 0.6514 for the model with energy trading assets and energy trading liabil-ities as two separate variables as inTable 3, Column 3.
6.3.2. Regression of market value on assets and liabilities
In our model, we regress market value on book value of net non–trading assets, original value of net energy trading assets, excess of fair value over original value of energy trading assets and liabilities, and net income. This classification of book value of equity into net trading assets and net non-trading assets restricts the corresponding assets and liabilities to have the same valuation coefficient in the regression. We relax this restriction, and regress market value on book value of non–trading assets and non-trading liabilities, original value of energy trading assets and energy trading liabilities, excess of fair value over original value of energy trading assets and liabilities, and net income.9The results
(not tabulated) indicate that the variables that are significant in explaining market valuation are book values of non-trading assets (coefficient = 2.351) and non-trading liabilities (coefficient =2.683), origi-nal values of energy trading assets (coefficient = 3.157) and energy trading liabilities (coeffi-cient =1.988). The excess of fair value over original value of energy trading assets and liabilities, and net income are not significantly related to market valuation.
7. Conclusion
This paper examines the value-relevance of mark-to-market values of assets and liabilities of en-ergy trading companies. EITF Issue No. 98-10 allowed for enen-ergy trading contracts to be marked-to-market (that is, measured at fair value as of the balance sheet date) with the gains and losses included in earnings and separately disclosed in the financial statements. This consensus was reiterated in EITF Issue No. 00-17, which stated that the estimate of fair value should be based on the best information available in the circumstances. However, EITF Issue No. 02-3 ruled to ban the use of mark-to-market accounting for energy contracts out of concern that fair values can be easily inflated. The EITF was con-cerned that energy trading assets and profits may be inflated by values of energy contracts that are marked-to-market.
To examine whether mark-to-market energy assets and liabilities are value-relevant, we regress market value of equity on net income, book value of net non-trading assets, original value of net en-ergy assets and the excess of fair value over the original value of enen-ergy assets and liabilities. Our re-sults indicate that market valuation is positively related to book value of net non-trading assets and original value of net energy trading assets. We also find that the excess of fair value over original value of energy trading assets and liabilities is not value-relevant.
In conclusion, our findings indicate that the market values of our sample energy trading firms do not reflect the fair values of energy trading assets and liabilities. Our findings support the findings in some prior research on the explanatory power of SFAS No. 33 disclosures of current cost operating income (for example,Beaver and Ryan, 1985) and value-relevance of banks’ fair value disclosures un-der SFAS No. 107 (for example,Nelson, 1996andEccher et al. 1996). We interpret this as the market being aware that some fair values of energy trading assets and liabilities are, at best, estimates ob-tained from valuation models. Thus, these fair value estimates are not relevant for valuation.
9
This paper is subject to a few limitations. First, we have a small sample size due to mark-to-market accounting being proposed in EITF 98-10 and subsequently rescinded in EITF 02-3. Second, there may be other firms that engage in energy trading activities not captured by our search criteria. Finally, we do not have sufficient data to analyze fair values of energy trading assets and liabilities by specific types; our analyses are based on aggregate values of energy trading assets and liabilities. As fair values are being endorsed by SEC and FASB, future research may provide further evidence on the value-rel-evance of fair values of various kinds of assets and liabilities across a wider spectrum of industries.
Acknowledgements
We thank James Myers, Sandeep Nabar, Jake Thomas and participants at the forum session of the 2004 AAA Annual Meeting for helpful comments and suggestions. We would also like to acknowledge helpful discussions with Gary Belitz, Thomas Sell and J. Kevin Vann of Williams Company on industry practices relating to mark-to-market accounting for energy contracts, and Bill Stanley on alternative external financing. This paper was formerly titled ‘‘An empirical examination of mark-to-market accounting for energy contracts under EITF Issue No. 98-10”. Data are available from the authors.
Appendix A. CLECO POWER LLC
Note 3 – fair value of financial instruments.
The amounts reflected in Cleco Power’s Balance Sheets at December 31, 2002, and 2001, for cash and cash equivalents, accounts receivable, accounts payable, and short-term debt approximate fair va-lue because of their short-term nature. Estimates of the fair vava-lue of Cleco Power’s long-term debt is based upon the quoted market price for the same or similar issues or by a discounted present value analysis of future cash flows using current rates obtained by management for debt with similar matu-rities. The estimated fair value of energy market positions is based upon observed market prices when available. When such market prices are not available, management estimates market value at a dis-crete point in time by assessing market conditions and observed volatility. These estimates are sub-jective in nature and involve uncertainties. Therefore, actual results may differ from these estimates.
At December 31
2002 2001
Fair value of financial instruments Carrying value Estimated fair value Carrying value Estimated fair value (Thousands)
Financial instruments not marked-to-market
Long-term debt $361,260 $384,543 $336,260 $357,775 Original value Estimated fair value Original value Estimated fair value
Financial instruments marked-to-market Energy market positions
Assets $ 20,793 $ 24,457 $ 800 $ 799
Liabilities $ 32,652 $ 37,239 $ 3,984 $ 4,091
The financial instruments not marked-to-market are reported on Cleco Power’s Balance Sheets at car-rying value. The financial instruments marked-to-market represent off-balance sheet risk because, to the extent Cleco Power has an open position, it is exposed to the risk that fluctuating market prices may adversely affect its financial condition or results of operations upon settlement. Original value represents the fair value of the positions at the time originated.
References
Ahmed, A., Kilic, E., Lobo, G., 2006. Does recognition versus disclosure matter? Evidence from value-relevance of banks’ recognized and disclosed derivative financial instruments. The Accounting Review 81, 567–588.
Barth, M., Beaver, W., Landsman, W., 1996. Value-relevance of banks’ fair value disclosures under SFAS No. 107. The Accounting Review 71, 513–537.
Beaver, W., Landsman, W., 1983. Incremental Information Content of Statement 33 Disclosures. Financial Accounting Standards Board, Stamford, CT.
Beaver, W., McNichols, M., 2001. Do stock prices of property casualty insurers fully reflect information about earnings, accruals, cash flows, and development? Review of Accounting Studies 6, 197–220.
Beaver, W., Ryan, S., 1985. How well do Statement No. 33 earnings explain stock returns? Financial Analysts Journal 41, 66–71. Bergstresser, D., Desai, M., Rauh, J., 2006. Earnings manipulation, pension assumptions and managerial investment decisions.
Quarterly Journal of Economics 121, 157–195.
Bernard, V., Ruland, R., 1987. The incremental information content of historical cost and current cost income numbers: Time-series analyses for 1962–1980. The Accounting Review 62, 707–722.
Bublitz, B., Frecka, T.J., McKeown, J.C., 1985. Market association tests and FASB Statement No. 33 disclosures: A reexamination. Journal of Accounting Research 23 (Supplement), 1–23.
Eccher, A., Ramesh, K., Thiagarajan, S.R., 1996. Fair value disclosures by bank holding companies. Journal of Accounting and Economics 22, 79–117.
The Economist, 2005. The Ones that Get Away. July 30th, pp. 14, 65–66.
Emerging Issues Task Force (EITF) of the Financial Accounting Standards Board (FASB), 1998. Accounting for contracts involved in energy trading and risk management activities. Emerging Issues Task Force Issue No. 98-10. Financial Accounting Standards Board, Norwalk, CT.
Emerging Issues Task Force and (EITF) of the Financial Accounting Standards Board (FASB), 2000. Measuring the fair value of energy related contracts in applying Issue No. 98-10. Emerging Issues Task Force Issue No. 00-17. Financial Accounting Standards Board, Norwalk, CT.
Emerging Issues Task Force and (EITF) of the Financial Accounting Standards Board (FASB), 2002. Issues involved in accounting for derivative contracts held for trading purposes and contracts involved in energy trading and risk management activities. Emerging Issues Task Force Issue No. 02-3. Financial Accounting Standards Board, Norwalk, CT.
Financial Accounting Standards Board (FASB), 2007a. Fair value measurements. Statement of Financial Accounting Standards No. 157. Financial Accounting Standards Board, Norwalk, CT.
Financial Accounting Standards Board (FASB), 2007b. The fair value option for financial assets and financial liabilities. Statement of Financial Accounting Standards No. 159. Financial Accounting Standards Board, Norwalk, CT.
Hanlon, M., Myers, J., Shevlin, T., 2003. Dividend taxes and firm valuation: a reexamination. Journal of Accounting and Economics 35, 119–153.
Harris, T., Kemsley, D., 1999. Dividend taxation in firm valuation: new evidence. Journal of Accounting Research 17, 275–291. Haw, I., Lustgarten, S., 1988. Evidence on income measurement properties of ASR No. 190 and SFAS No. 33 data. Journal of
Accounting Research 26, 331–352.
Hodder, L., Hopkins, P., Wahlen, J., 2006. Risk-relevance of fair-value income measures for commercial banks. The Accounting Review 81, 337–375.
Holthausen, R., Watts, R., 2001. The relevance of value-relevance literature for financial accounting standard setting. Journal of Accounting and Economics 31 (September), 3–75.
Hopwood, W., Schaefer, T., 1989. Firm-specific responsiveness to input price changes and the incremental information in current cost income. The Accounting Review 64, 312–338.
Lehavy, R., 2002. Reporting discretion and the choice of fresh start values in companies emerging from Chapter 11 bankruptcy. Review of Accounting Studies 7, 53–73.
Lev, B., Li, S., Sougiannis, T., 2009. The usefulness of counting estimates for predicting cashflows and earnings. Working paper, New York University, University of Illinois.
Liu, J., Thomas, J., 2000. Stock returns and accounting earnings. Journal of Accounting Research 38, 71–101.
Lobo, G.J., Song, I.M., 1989. The incremental information in SFAS No. 33 income disclosures over historical cost income and its cash and accrual components. The Accounting Review 64, 329–343.
Murdoch, B., 1986. The information content of FAS 33 returns on equity. The Accounting Review 61, 273–287.
Noland, T., Pasewark, W., Strawser, J., 1998. An investigation of the accuracy of pre-implementation estimates required by SAB 74. Journal of Accounting and Public Policy 17, 227–244.
Nelson, K., 1996. Fair value accounting for commercial banks: an empirical analysis of SFAS No. 107. The Accounting Review 71, 161–182.
Ohlson, J., 1995. Earnings, book values, and dividends in equity valuation. Contemporary Accounting Research 12, 661–687. Ray, R., 2002. Energy traders face rule changes. Tulsa World, E1, E2 (Nov. 6).
Ray, R., 2003. Williams loses $814 million, Tulsa World, E1, E8 (May 14).
Watts, R., 2003. Conservatism in accounting Part I: Explanations and implications. Accounting Horizons 17, 207–221. White, H., 1980. A heteroscedasticity-consistent covariance matrix estimator and a direct test for heteroscedasticity.