Let’s Stop Spreading Rumors About Settlement and Litigation: A
Comparative Study of Settlement and Litigation in Hawaii Courts
JOHNBARKAI& ELIZABETHKENT* Cite as: 29 Ohio St. J. on Disp. Resol. 85 (2014)
Have you ever heard a lawyer or judge say, “At least 95%or more of all cases settle?” Well, they were wrong!1Although it is probably true that less than 5% of civil cases end with a trial verdict, it is incorrect to assume the inverse—that the remaining 95% settle.
*John Barkai is a professor of law at the University of Hawaii’s William S. Richardson School of Law. Elizabeth Kent is the director of the Hawaii State Judiciary’s Center for Alternative Dispute Resolution. This article and its two underlying studies were completed with the assistance of the Hawaii Judiciary, the University of Hawaii’s Program on Conflict Resolution, The University of Hawaii’s William S. Richardson School of Law, and many people, including Cliff Afong, Lisa Ayabe, Judge Michael Broderick (ret.), Ned Busch, Sarah Casken, Gladys Chasnoff, Karen Cross, Justice James Duffy (ret.), Susan Pang Gochros, Nadine Grace, Aarin Gross, Kathy Harter, Constance Hassell, Shirley Higa, Jack Houtz, Stuart Ing, Erika Ireland, Sharon Iwai, Tamatoa Jonassen, Dennis Koyama, Dr. Tom La Belle, Melissa Lewis, Angela Lovitt, Brennan MacDowell, Pamela Martin, Ashley Masuoka, Justice Sabrina McKenna, Michael Meaney, Tom Mick, Matthew Moneyhon, Chief Justice Ronald Moon (ret.), Kathryn Nishiki, Michael Oki, Cheryl Okuma, Andrew Ovenden, Justice Frank Padgett (ret.), Dr. Marcia Phelps, Chief Justice Mark Recktenwald, Gerritt Smith, Becky Sugawa, Gary Teramae, Jessie Varble, Benjamin Williams, Carmen Wong, Dr. Joan Yamasaki, and Diane Yuen.
1Almost all the literature that explores settlements has found that settlement rates vary depending upon the type of case (tort, contract, civil rights, etc.). Except for tort cases, none of the settlement rates exceed 60%, and even torts do not exceed 90%. Although researchers have long demonstrated that 95% of cases do not settle, lawyers, judges, and many academics continue to get it wrong. A recent Westlaw search in the journals and law reviews database found 656 citations to the phrase “most cases settle.” Search conducted Aug. 18, 2012. A Westlaw search found three articles that said “97% of cases settle,” two articles that said “96% of cases settle,” twenty articles that said 95% of cases settle and fifty-three articles that said “90% of cases settle.” One article even said “99 & 44/100 percent of cases settle.”
Perhaps we need more conversations between researchers and members of the bar.SeeDONALDHARRIS ET AL., COMPENSATION ANDSUPPORT FORILLNESS ANDINJURY93 (1984); H. LAURENCEROSS, SETTLEDOUT OFCOURT: THE SOCIALPROCESS OFINSURANCECLAIMSADJUSTMENT179 (1980) (this classic study suggested a very high settlement rate for torts); D. TRUBEK, J. GROSSMAN, W. FELSTINER, H. KRITZER& A. SARAT, CIVILLITIGATIONRESEARCHPROJECT: FINAL REPORT(1983); Kevin M. Clermont,Litigation Realities Redux, 84 NOTREDAMEL. REV. 1919 (2009); Kevin M.
Clermont & Stewart J. Schwab,Employment Discrimination Plaintiffs in Federal Court: From Bad to Worse?, 3 HARV. L. & POL’YREV. 1033 (2009); Theodore Eisenberg & Charlotte Lanvers,What Is the Settlement Rate and Why Should We Care, 6 J. EMPIRICALLEGALSTUD. 111 (2009); Marc Galanter,The Vanishing Trial: An Examination of Trials and Related Matters in Federal and State Courts, 1 J. EMPIRICALLEGALSTUD. 459 (2004); Marc Galanter & Mia Cahill,Most Cases Settle: Judicial Promotion and Regulation of Settlements, 46 STANFORDL. REV. 1339 (1994); Dwight Golann, Dropped Medical Malpractice Claims: Their Surprising Frequency, Apparent Causes, and Potential Remedies, 30 HEALTHAFF. 1343 (2011); Samuel Gross & Kent Syverud,Getting to No: A Study of Settlement Negotiations and the Selection of Cases for Trial, 90 MICH. L. REV. 319 (1991); Samuel Gross & Kent Syverud,Don’t Try: Civil Jury Verdicts in a System Geared to Settlement, 44 UCLA L. REV. 1, 51 (1996); Gillian K. Hadfield,Where Have All the Trials Gone? Settlements, Nontrial Adjudications, and Statistical Artifacts in the Changing Disposition of Federal Civil Cases, 1 J. EMPIRICALLEGALSTUD. 705 (2004); Milton Heumann& Jonathan M. Hyman,Negotiation Methods and Litigation
How many cases do settle? How are they settled? What happens to most cases as they go through the civil litigation system? How much pretrial discovery takes place? How often are cases resolved by a default judgment or a court ruling on a dispositive motion? Could a settlement have been negotiated earlier, and if so, what would have been the best way to discuss settlement? Does a lawyer’s training have an impact on the lawyer’s effectiveness in settlement negotiations? What other factors influence settlement?
This article begins to answer the above questions and also reports on civil litigation and settlement in the Circuit Courts2of Hawaii in 2007 and compares that 2007 data to what was happening eleven years earlier in those same courts when we completed a similar study.3During our two studies, we analyzed over 4,000 docket sheets and surveyed 500 lawyers.4The resulting data and our analysis can help lawyers, courts, and parties to better understand and plan for what happens to cases as they move through court systems. In addition to the data for our two study years, in this article we also review long-term data about the case filings and trial rates of the past fifty years in Hawaii and the federal courts.
Public statistics about civil law suits in almost every jurisdiction in the United States are very limited. Most judicial systems simply report the number of cases filed, terminated, tried, and pending.5Few, if
Settlement Methods in New Jersey: You Can’t Always Get What You Want, 12 OHIOST. J.ONDISP. RESOL. 253 (1997); Jason Scott Johnston & Joel Waldfogel,Does Repeat Play Elicit Cooperation? Evidence from Federal Civil Litigation, 31 J. LEGALSTUD.39, 40 (2002) Jay. P. Kesan & Gwendolyn G. Ball,How Are Patent Cases Resolved? An Empirical Examination of the Adjudication and Settlement of Patent Disputes, 84 WASH. U. L. REV. 237 (2006);Daniel P. Kessler & Daniel L. Rubinfeld,Empirical Study of the Civil Justice System,in1 HANDBOOK OFLAW& ECONOMICS381–83 (A. Mitchell Polinsky& Steven Shavell eds., 2007); Randall A. Kiser, Martin A. Asher & Blakeley B. McShane,Let’s Not Make a Deal: An Empirical Study of Decision Making in Unsuccessful Settlement Negotiations, 5 J. EMPIRICALLEGAL STUD. 551 (2008); Minna J. Kotkin,Outing Outcomes: An Empirical Study of Confidential Employment Discrimination Settlements, 64 WASH. & LEEL. REV. 111 (2007); Robert Moog,Piercing the Veil of Statewide Data: The Case of Vanishing Trials in North Carolina, 6 J. EMPIRICALLEGALSTUD. 147 (2009); Frank E.A. Sander,The Obsession with Settlement Rates, 11 NEGOTIATIONJ. 329, 331 (1995); Stewart J. Schwab & Theodore Eisenberg,Explaining
Constitutional Tort Litigation: The Influence of the Attorney Fees Statute and the Government as Defendant, 73 CORNELL L. REV. 719 (1988); W. Kip Viscusi,Product and Occupational Liability, 5 J. ECON. PERSPECTIVES71, 84 (1991); Carl Baar,The Myth of Settlement(1999) (unpublished paper prepared for the Annual Meeting of the Law and Society Association,available athttp://siteresourc es.worldbank.org/INTLAWJUSTINST/Resources/MythofSettlement.pdf).
2Circuit courts in Hawaii have exclusive jurisdiction in civil cases where the contested amount exceeds $25,000 and in probate and guardianship cases. Circuit courts share concurrent jurisdiction with district courts in civil, non-jury cases in which the amounts in controversy are between $10,000 and $25,000. The circuit courts also have jurisdiction over mechanics’ liens and misdemeanor violations transferred from the district courts for jury trials.Circuit Courts, HAWAI’I STATEJUDICIARY, http://www.courts.state.hi.us/courts/circuit/circuit_courts.html (last visited Jan. 21, 2013).
3John Barkai, Elizabeth Kent& Pamela Martin,Settling Civil Lawsuits in the Hawaii Circuit Courts, 10 HAW. BARJ. 73 (2006),available athttp://www.courts.state.hi.us/docs/HSB/HSBAarticle_SettlingLawsuitsInHI.pdf and
http://papers.ssrn.com/sol3/papers.cfm?abstract_id=1435047. For a five page summary of this 1996 study,seeJohn Barkai, Elizabeth Kent & Pamela Martin,A Profile of Settlement, 42 CT. REV.34 (2006),available
athttp://papers.ssrn.com/sol3/papers.cfm?ab stract_id=1434793,
http://digitalcommons.unl.edu/cgi/viewcontent.cgi?article=1024&co ntext=ajacourtreview, and http://aja.ncsc.dni.us/courtrv/cr42-3and4/CR42-3BarkaiKent Martin.pdf.
4Our samples of docket sheets represented 13% of the total number of cases filed during 2007, and 42% in 1996. 5SeeTHEJUDICIARY: STATE OFHAWAI’I, 2011 ANNUALREPORTSTATISTICALSUPPLEMENT (2011),available at http://www.courts.state.hi.us/docs/news_and_reports _docs/annual_reports/Jud_Statistical_Sup_2011.pdf.
any, courts report settlements. However, a better understanding of settlements can help court systems more effectively administer justice and assist lawyers and parties as they negotiate and consider whether to accept a settlement offer.
Our primary purpose in the 1996 and the 2007 studies, therefore, was to provide accurate empirical data about settlements and to discover other information about civil litigation that might be helpful to lawyers, parties, and courts. For example, we wanted to learn how many cases actually did settle and what happened to the rest of the cases that did not settle or terminate with a trial. We also wanted to know if all types of cases settled at the same rate, when in the litigation process the cases settled, whether the lawyers were satisfied with their settlements, the length of time cases remained open, and the type and amount of pretrial discovery which occurred. We also wanted to compile baseline statistics about litigation and settlement. Doing studies in both 1996 and 2007 allowed us to make comparisons and observe trends.
After our first large study in 1996, we undertook the second, smaller, comparative study more than a decade later to see if the patterns of litigation and settlement were consistent over time, evaluate whether the use of ADR during the intervening decade changed, assess trends in the disposition of civil cases, and seek the perceptions of lawyers about settlement. We also wanted to assess whether technological changes, such as e-mail and the internet, had an impact on the settlement process and litigation.
Methodology
Both of our studies used similar data sets— (1) docket sheets from terminated cases, and (2) surveys sent to a sample of lawyers who represented clients in those cases.
In the 1996 study, docket sheet data was extracted from all 3,183 cases that terminated in all Hawaii Circuit Courts during the six-month period between April and September 1996.6Our sample represented 42% of the cases filed during that calendar year. Docket sheets for all terminated cases were collected and sorted by circuit and type of case.7The cases were then coded for information such as the type of case, the circuit in which it was filed, and the length of time the case was open. The study also recorded significant milestones such as discovery requests and other filings.8The case specific information was entered into a
6The sample of terminated cases for the 1996 study straddled two fiscal years. Approximately 7,400 civil cases were filed in the Circuit Courts in Hawaii during fiscal year 1995-1996, and 7,600 civil cases were filed during fiscal year 1996-1997.SeeTHEJUDICIARY: STATE OFHAWAI’I, ANNUALREPORT: JULY1, 1995TOJUNE30, 1996 (1996); THEJUDICIARY: STATE OFHAWAI’I, ANNUALREPORT: JULY1, 1996TOJUNE30, 1997 (1997). The number of all civil cases used in our 1996 study is the average of those two fiscal years. There were more than twice as many cases filed in 1996 as there were in 2007. In fact, there were almost as many foreclosure cases filed in 1996 (3,623) as there were in the total civil docket in 2007 (3,582).
7In all, there were sixteen categories of cases in our sample: assault and battery, agency appeal, contract, condemnation, construction defects, declaratory judgment, foreclosure, foreclosure of agreements of sale, jury demand from district court, legal malpractice, medical malpractice, motor vehicle tort, non-vehicle tort, products liability, and a general category called “other.”
8Specifically, the following information was coded: civil file number and circuit, case type, start date, termination date, how the case was terminated [default judgment; dismissed for inaction; dismissed by motion; notice of dismissal with prejudice; notice of dismissal without prejudice; stipulation for dismissal; and acceptance of non-binding arbitration award], the date the case was returned to litigation from the court’s non-binding arbitration program; trial verdict; stipulated judgment; number of noticed written and oral depositions, number of certificates of service filed for requests for
database and analyzed. Ultimately, the docket sheets were of minimal assistance in determining if, how, and under what conditions cases settled.
The second data set for the 1996 study was data extracted from 412 surveys (“the lawyer surveys”)returned from lawyers who represented parties in some of those terminated cases. Analysis focused on the tort and contract cases because tort and contract cases were of the most interest both in Hawaii and nationally.9Additionally, the high percentage of foreclosure cases in our data set in the year of our study was atypical and reflected the effect of an unusual economic recession in Hawaii.
In the 2007 study, the docket sheet data was derived from over 450 cases randomly selected, using every fifth docket sheet of the circuit court cases that terminated between January 1 and June 30, 2007. Once this group of cases was selected, surveys were sent to a random sample of lawyers who represented clients in tort and contract cases among our data set. Cases to be surveyed first were selected randomly, and then we did some modification to allow representation from all circuits in the State and to avoid excessive, multiple surveying of the same lawyers. Ultimately, we had seventy-one useable surveys. The docket sheet sample size for the second study was approximately one-seventh (1/7th) the size of the docket sheet sample for the first study. We also used the Hawaii Judiciary’s statistical reports in both our studies.10
An Overview of the Hawaii Circuit Court Civil Docket—A Static Look at the Docket
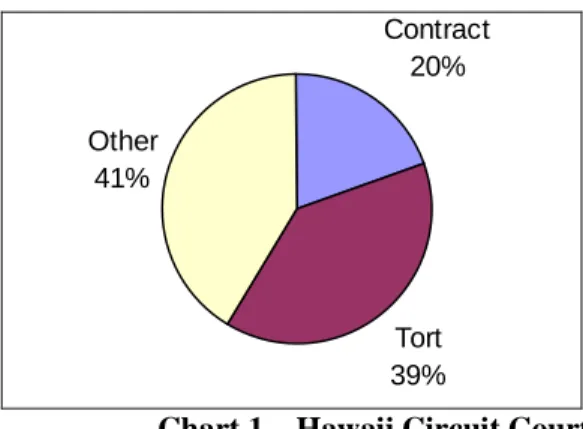
As shown in Chart 1 below, in 2007 the Circuit Court civil docket was comprised of three major categories of cases: 39% tort cases, 20% contract cases, and 41% “other”11[sic] cases.12
interrogatories or production of documents; filing of a pretrial statement; filing of a settlement conference statement or the holding of a settlement conference; and the total amount of time the case was open.
9See reports found atCivil Cases, BUREAU OFJUSTICESTATISTICS, U.S. DEP’T OFJUSTICE,
http://www.bjs.gov/index.cfm?ty=tp&tid=45 (last visited Dec. 21, 2013); NATIONAL CENTER FORSTATECOURTS, http://www.courtstatistics.org (last visited Feb. 16, 2013).
10For the most current report, see THEJUDICIARY: STATE OFHAWAI’I, 2011 ANNUALREPORT(2011),available athttp://www.courts.state.hi.us/docs/news_and_reports_docs/annual_reports/Jud_Annual_Report_2011.pdf(Jan. 21, 2013).
11The published court statistics available in the Judiciary’s Annual Statistical Reports list four major types of cases: contract; personal injury, property damage, or both, motor vehicle; personal injury or property damage or both, non-motor vehicle; condemnation, and other civil action. The official court statistics also list two other types of cases—district court transfers and condemnation. Because they are typically less than 1% each of the annual caseload, we included transfers and condemnation cases within “other” cases for purposes of our studies.
12”Other” cases include: agency appeal, condemnation, construction defects, declaratory judgment, foreclosure, foreclosure of agreements of sale, jury demand from district court, and the judiciary’s general category of “other.”
Contract 20% Tort 39% Other 41%
Chart 1 – Hawaii Circuit Court Civil Docket 2007
As shown in Table 1 below, the distribution of cases in the civil docket was quite similar in 1996 and 2007, at least in percentage terms—contracts were about 20% of the docket, torts were in the30% range, and “other” were in the 40% range. The size of the docket, however, was larger in 1996 than in 2007, and the percentages of the various types of cases fluctuated significantly within the decade between the study periods and over the last thirty years.
Table 1 Percent / Number of Types of Civil Cases Filed
2007 1996
Tort 39% 31%
Contract 20% 21%
“Other” 41% 48%
Total civil cases
filed for the year 3,582 7,516
A Comment on Foreclosure Cases
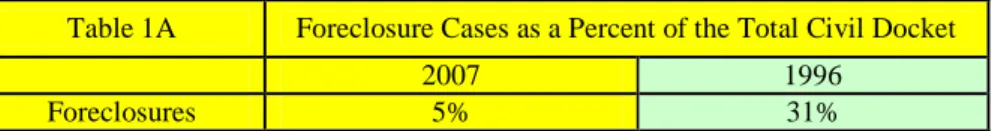
Although court statistics available to the public do not report foreclosure cases as a separate category of civil cases,13in the 1996 study we reported foreclosure cases as a separate category because, during
13The way civil cases are reported in the Judiciary statistical reports has not changed much since Hawaii became a state in 1959. In the 1960 annual report, cases were simply noted in large, general categories of civil and criminal. By 1964, civil actions were reported in six categories—contract, personal injury, property damage (both personal injury and property damage), condemnation, and “other.” The personal injury, property damage, and both personal injury and property damage categories were broken down into two categories - motor vehicle and “other.” Now, many years later, the reports still look almost exactly the same except that the category called “personal injury, property damage, or both” are broken out into two categories—”motor vehicle” and “non-motor vehicle”—and in addition there is a category for district court transfers. So apart from a formatting change and the addition of district court transfers, the reporting has remained largely consistent for over forty-five years. The most current Annual Reports are available on the web at: http://www.courts.state.hi.us/ news_and_reports/reports/reports.html (Jan. 21, 2013). The Annual Reports, which provide
that difficult economic time, 31% of the total civil docket were foreclosure cases.14In contrast, in 2007, only 5% of the docket was foreclosure cases.15Therefore, in some tables within this article, we report “other” cases in two ways—with and without foreclosure cases.
Table 1A Foreclosure Cases as a Percent of the Total Civil Docket
2007 1996
Foreclosures 5% 31%
Foreclosure cases are different from other civil cases in terms of settlement rates, amount of pretrial discovery, and in other ways. Therefore, generalizations about “all” cases from the 1996 study are greatly impacted by the fact that almost one-third of the cases in 1996 were foreclosure cases.
The Size of the Civil Docket—A Dynamic Look at the Docket
Chart 2 below shows the size of the civil docket in Hawaii from 1960 through 2011.
Hawaii All Circuit Court Civil Filings 1960-2011
0 1000 2000 3000 4000 5000 6000 7000 8000 9000 10000 1960 1965 1968 1971 1974 1977 1980 1983 1986 1989 1992 1995 1998 2001 2004 2007 2010 A ll C iv il C a s e s F il e s Chart 2
This chart shows that although the size of the civil docket steadily increased in the first twenty-three years after Hawaii became a state in 1959, since the early 1980s the docket size has cycled through data on all civil filings for Hawaii courts from 1960 until the present, are on file with the authors and available upon request.
14The Hawaii Judiciary provided the information about foreclosure cases to us for our study.
15In our 2007 sample of the docket, there were twenty-three foreclosure cases, twelve declaratory judgments, nine partition/quiet titles, and seven injunction cases. It should be noted that there was a change in the foreclosure law and in 2007; the general trend was to file non-judicial foreclosure cases. At the time this article was written, the number of judicial foreclosure filings had risen dramatically.
increases and decreases. Although one might expect total civil filings to steadily increase as Hawaii’s population did,16the number of total civil filings fluctuated significantly over the years, and the chart of total civil filings has definite peaks and valleys. Compared to other states, however, Hawaii has a low number of case filings on a per capita basis.17
Over the past thirty-five years, total civil filings have ranged from a high of over 8,900 in 1983 to a low of approximately 3,400 in 2006. Just within the decade between our two studies, total civil filings ranged from a high of over 8,000 in 1998 to a low of barely 3,400 in 2006. Interestingly, the number of total civil filings in the early 1970s and the mid-2000s were quite similar.
Although we did not realize it at the time of our studies, as shown by Chart 2 above, by coincidence our two studies were conducted in two years when Hawaii had a record high (in 1996) and a near-record low (in 2007) number of civil filings.18There were less than one-half the number of civil filings in 2007 (3,582 cases) than in 1996 (7,516 cases).19The chart also shows that the 1996 study was conducted after almost a decade of steadily increasing case filings, and the 2007 study was conducted after almost a decade of steadily decreasing caseloads.
Even though the size of the total civil docket was drastically different in 1996 and 2007, there were similar proportions of tort and contract cases in both studies. In 1996, there were 2.3 tort cases for every contract case; in 2007, there were 2.5 tort cases for every contract case.
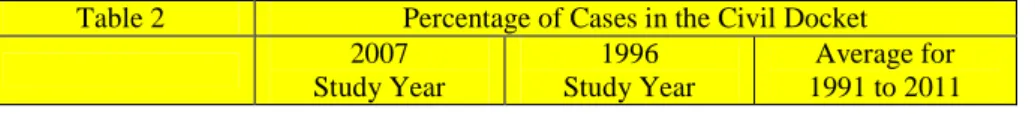
As seen in Table 2 below, for the last twenty years, the average distribution of cases in the civil docket has been 19% contract cases, 34% tort cases, and 47%“other” cases. Furthermore, for the two study years, the percentages of the docket looked relatively similar, even though the size of the docket was different.
Table 2 Percentage of Cases in the Civil Docket 2007 Study Year 1996 Study Year Average for 1991 to 2011
16Hawaii’s population steadily increased from about 600,000 in 1960 to over 1.3 million in 2010.THERECORDS PROJECT, HAWAIICENSUSRECORDINFORMATIONONLINE, http://recordsproject.com/census /hawaii.asp (last visited Jan. 21, 2013);State & Country QuickFacts, U.S. DEPARTMENT OFCENSUS, http://quickfacts.census.gov/qfd/ states/15000.html (last visited Jan. 21, 2013).
17Of the twenty-nine states with statistics reported by the National Center for State Courts, Hawaii has the lowest reported per capita number of civil cases filed (2,493 civil cases per 100,000 of population). The median per capita filings for the twenty-nine states was 5,398 per 100,000 of population. NAT’LCTR.FORSTATECOURTS, EXAMINING THEWORK OF STATECOURTS: ANANALYSIS OF2008 STATECOURTCASELOADS25 (2010).
18Data on all civil filings for Hawaii courts from 1960 until the present is on file with the authors and available upon request.
19The 2007 study was done when Hawaii had the second lowest number of civil filings in almost forty years. Only 2006 had a lower number of civil filings with 3,448 civil cases filed. Although there were less than 4,000 civil cases filed each year between 2004 and 2007, to find another year where there were less than 4,000 cases filed requires going back to 1975. The 1996 study was done when Hawaii had one of the highest number of civil filings in the past fifty years. Although there were slightly more than 8,000 cases filed in 1998, to find the next year with more civil cases filed after 1996 requires going back to 1983.
Contracts 20% 21% 19%
Torts 39% 31% 34%
“Other”Cases 41% 48% 47%
These averages mask some wide fluctuations in the percentage of types of cases filed over the past twenty years.20As Chart 3 below shows, over the past forty-five years, the percentage of contract, tort, and other cases has varied quite significantly.
0 10 20 30 40 50 60 70 1964196719711974197719801983 1986 1989 1992199519982001200420072010 P e rc e n ta g e % K % Tort % Other
Chart 3 – Variations in Types of Civil Filings (by percentages of docket)
Chart 3 shows that there are various series of years where increases and then decreases in certain types of cases seemed to be almost mirror images of the opposite decreases and then increases of other types of cases. For example, between 1967 and 1975, the percentage of tort cases rose and then fell while the percentage of “other” cases fell and then rose; between 1981 and 1992, the percentage of “other” cases rose and then fell while the percentage of contract and tort cases fell and then rose; between 1996 and 2004, the percentage of “other” cases rose and then fell while the percentage of contract and tort cases fell and then rose; and finally, between 2006 and 2008, the percentage of “other” cases rose while the percentage of tort cases fell. Although we do not have an explanation for this pattern, it happened often enough that it bears noting and may be useful for future predictions, as well as worthy of future study.
Trials
20In the past twenty years, contract cases filed have been as low as 9% of the docket (1993) and as high as 26% (2010); tort cases as low as 23% (2009) and as high as 41% (1992 and 2004); “other” cases have been as low as 31% (1992) and as high as 63% (1999).
Trials are rare. Jury trials are very rare. Few cases ever go all the way to a trial verdict. As can be seen in Chart 4 below,21the percentage of civil cases resolved by a trial verdict in Hawaii has steadily decreased over the past forty-five years and now hovers slightly below 2%.22
Percentage of Hawaii "All" Civil Trials - 1964-2011
0 2 4 6 8 10 12 14 16 18 20 22 24 1960 1965 1968 1971 1974 1977 1980 1983 1986 1989 1992 1995 1998 2001 2004 2007 2010 P e rc e n t Chart 423
In the first few years after Hawaii became a state, the trial rate was 10% or higher each year. Since 1971, that percentage has moved steadily downward from 12% to below 2%. From 1981 until 1990, the rate was generally on a downward trend from 4%towards 2%. Since 1997, less than 2%of cases were resolved by trial in Hawaii circuit courts every year.
For all categories of civil cases except torts, there are fewer jury trials than non-jury trials.24For example, in 2011, only 8% of all circuit court civil trials were jury trials.25The percentage of civil cases
21We have computed the annual trial rates since statehood in 1959, and they appear in Appendix B with other annual statistics. The percentage of cases terminating in trial in Hawaii each year is reported in the Judiciary’s Annual Statistical Report, a statistical report that reports the number of terminated cases, pending cases, and number of trial dispositions during the year. This chart was created from those annual reports. STATE OFHAWAII, 2011 JUDICIARYANNUALREPORT SUPPLEMENT, table 7 (2011),available
athttp://www.courts.state.hi.us/docs/news_and_reports_docs/annual_reports/Jud_Statistical_Sup_2011.pdf.The most current Annual Reports are available on the web at http://www.courts.state.hi.us/news_and_reports/reports/reports.html (last visited Dec. 21, 2013).
22To a large degree, the Hawaii long-term data on trials replicate the “Vanishing Trial” phenomenon seen in the federal courts and in some other state courts.SeeHope Viner Samborn,The Vanishing Trial, 88 A.B.A. J. 24 (2002).
23The Judiciary started to report the number of trials in 1964, but did not report them in 1965, which explains the single dot for 1964.
24Non-jury trials conducted and decided by a judge without a jury are also called “bench,” “jury-waived,” or “waiver” trials. LANGTON& THOMASH. COHEN, CIVILBENCH ANDJURYTRIALS INSTATECOURTS1, 2 (2005),available athttp://bjs.ojp.usdoj.gov/content/pub/pdf/cbjtsc05.pdf (90% of tort trials nationally in state court are jury trials, but only 36% of contract trials are jury trials).
25In contrast, 60% of circuit court criminal trials were jury trials in 2011. There were 107 criminal jury trials. STATE OFHAWAII, 2011 JUDICIARYANNUALREPORTSTATISTICALSUPPLEMENT, table 7 (2011),available at
terminating with a jury trial has not exceeded 1% since 1987. In fact, the percentage of civil cases terminating with a jury trial has not exceeded one-half a percent since 1996. Hawaii has not had more than twenty civil jury trial verdicts per year since 2002.For almost the last twenty years, the jury trial rate for torts has always exceeded the jury trial rate for contract cases.
As can be seen by Table 3 below, the percentage of all civil cases disposed of by trial (jury and non-jury) in our study years was less than 2% in 2007 and less than 3% in 1996. Specific types of cases, e.g., contract and tort, had different trial rates. The 2007 data allowed us to calculate a 1.6% civil trial rate for the reported fifty-one trials that year (twelve jury and thirty-nine non-jury trials)26resulting from the termination of 3,179 terminated civil cases.27Table 3A below shows that the percentage of cases disposed of by jury trial was very low in 2007—0.7% of tort cases, 0.2% of contract cases, 0.2% of “other” cases, and 0.2% of “all” cases. In 1996 the jury trial rates were slightly higher with rates of 1% for tort cases, 0.4% for contract cases, 0.5% for “other” cases, and 0.4% for “all” cases.28
Table 3
2007 Percent of Cases
Disposed of by Trial Verdict (Jury and Non-jury)
1996 Percent of Cases
Disposed of by Trial Verdict (Jury and Non-jury) Data Source: Hawaii Judiciary’s Annual Reports29
Tort 1% 2%
Contracts 1% 4%
Other 2% 3%
All Cases > 2% > 3%
http://www.courts.state.hi.us/docs/ news_and_reports_docs/annual_reports/Jud_Statistical_Sup_2011.pdf.
26Of these fifty-one total (jury and non-jury) trials, there were eight contact trials, thirteen tort trials, and thirty “other” trials.
27Many lawyers and judges have said that the number of completed jury trials reported in the Judiciary’s annual reports seems lower than their experience. We think the reason for this is that some cases that go to a trial verdict are actually resolved by a settlement soon after the verdict and are recorded in the court’s statistics in a non-trial termination category. Also, data entry for a trial completed in one fiscal year may not take place until the next fiscal year, depending on when final documents are submitted to the court.
28The number of dispositions by civil jury trials (93) and civil non-jury trials (294) in Hawaii in 1996 were the highest numbers in almost thirty years (see data in the appendix B).By reviewing the data for the past thirty years, we find that the civil trial rate is decreasing, especially for tort and contract cases. For example, while the contract case trial rate generally has been in the 2%–3% range over the past twenty-five years, for the past fifteen years the contract trial has been less than 2% and sometimes less than 1%. In the past twenty-five years, the tort trial rate has varied considerably. Twenty to twenty-five years ago, the tort trial rate was 5%–7%. However, for over twenty years, with the exception of 1995, the tort trial rate has been 2% or less, and sometimes less than 1%. In fact, a few times, including the past two years, the tort trial rate has been less than 1%. This Hawaii trend in trials seems to be following the trend documented by some national researchers on what has been called “The Vanishing Trial.”SeeMarc Galanter,The Vanishing Trial, DISP. RESOL. MAG., Winter 2004, at 3; see alsoGalanter,supranote 1.
29We used the Judiciary’s Annual Statistical Reports for the number of cases disposed of by trial each year. The Judiciary’s Annual Statistical Report provided the number of trials for each category of case. We calculated the percentage of trials and rounded to the nearest whole number.
Data Source: Docket Sheets for a sample of cases Foreclosure 0% 1% Table 3A 2007 Percent of Cases Disposed of by Jury Trial Verdict
1996 Percent of Cases
Disposed of by Jury Trial Verdict Data Source: Hawaii Judiciary’s Annual Reports
Tort 0.7% 1.0%
Contracts 0.2% 0.4%
Other 0.2% 0.5%
All Cases 0.4% 0.6%
Comparing Hawaii Civil Filings and Trial Rates with Federal Court Data: Fluctuating Filings and Vanishing Trials
Although accurate empirical data about settlement rates do not exist and therefore information about settlement is mainly anecdotal, the information about case filings and terminations is available. The patterns of filings and trial rates for Hawaii civil cases are similar to the patterns for federal courts.
Over 100 million lawsuits are filed in the United States each year. More precisely, in 2010 (the last year for which complete statistics are available), approximately 106 million cases were filed in state and federal courts in the United States.30The vast majority of court filings in the United States are in state courts, not federal courts. There were about 2 million cases in federal court—approximately 300,000 civil cases, almost 100,000 criminal defendants (federal courts report defendants, not cases), over 1.5 million bankruptcy cases, and other categories of post-conviction supervision and pretrial supervision31—and 104 million cases filed in state courts—including approximately 56 million traffic cases, 21 million criminal cases, 20million civil cases, 6 million domestic cases, and 2 million juvenile cases. Generally, less than 3% of state civil cases reach a trial verdict, and less than 1% of all civil dispositions are jury trials,32
30The State Court statistics are from NAT’LCENT.FORSTATECOURTS, EXAMINING THEWORK OFSTATECOURTS: AN ANALYSIS OF2010 STATECOURTCASELOADS(2012),available at
http://www.courtstatistics.org/Other-Pages/CSP2010.aspx(last visited Feb. 16, 2013). The federal court data are from the statistical report on the federal courts. Judicial Business of the United States Courts: Judicial Caseload Indicators, U.S. COURTS,
http://www.uscourts.gov/Viewer.aspx?doc=/uscourts/Statistics/FederalJudicialCaseloadStatistics/2011/front/IndicatorsMar 11.pdf (last visited Feb. 16, 2013). The trial rate for the over 300,000 terminated federal court civil cases was 1.1%.
31See Federal District Court Workload Increases in Fiscal Year 2011, U.S. COURTS(Mar. 13, 2012),
http://www.uscourts.gov/News/NewsView/12-0313/Federal_District_Court_Workload_Increases_in_Fiscal_Year_2011.aspx;Statistical Tables for the Federal Judiciary, U.S. COURTS(June 30, 2011), http://www.us courts.gov/Statistics/StatisticalTablesForTheFederalJudiciary/June2011.aspx.
32SeeNAT’LCENT.FORSTATECOURTS, EXAMINING THEWORK OFSTATECOURTS, 200322 (2004),available at http://bjs.ojp.usdoj.gov/index.cfm?ty=pbdetail&iid=3981.
although rates of non-jury trials can vary significantly across states.33Therefore, up to 97% of cases are resolved by means other than by trial, but of course not all of those 97%aresettled.
In the years between our two studies, Professor Marc Galanter published an article entitled “The Vanishing Trial.”34In that article Galanter statistically demonstrated that in the federal courts, over a period of forty years (1962–2002), federal civil filings35increased “by a factor of five” (going from approximately 50,000 to 258,000), while the absolute number of trials decreased 20%. Because the number of trials decreased as the number of filings increased, the result was a dramatic decrease in the percentage of cases that went to trial. Trial dispositions fell from 12% in 1963 to less than 2% in 2002.36Galanter’s research related to fluctuations in civil filings and trial rates in federal courts were similar to the information about Hawaii courts until 1998.
We supplemented Galanter’s data about federal court civil filings and trial rates, which only went up to 2002,with more recent data about the federal courts for the last decade to give us two data sets— Hawaii and the federal courts. Thus Chart 5 shows data for each court for over fifty years, from the early 1960s through 2011.37Although Galanter’s research reported that federal civil filings nationwide had increased by a “factor of five” in over forty years (1962–2002), in fact, the factor of five increase happened in only a little more than twenty years (1962–1985) and thereafter remained relatively stable. In fact, between 1985 and 2005, in only one year were federal civil filings higher than the 1985 number of filings.
Chart 5 also shows that the patterns for Hawaii and federal courts civil filings are similar (at least for the first forty years) showing a steady growth for twenty years after 1960, followed by a leveling off for the next twenty years. Since 1998, federal filings have had some ups and downs but were largely constant. However, since 1998, Hawaii cases showed a significant decrease for nine years, and then filings started to rise again. Since 2007, federal civil filings increased 7,000 to 10,000 cases (2% to 4%) per year. Since 2004 Hawaii civil filings also increased but increased at a higher rate (3% to 19%) than federal filings (although 2011 showed a downturn). As a point of comparison, nationally, state court filings have steadily increased since the year 2000, and are now 28% higher than the 2000 level.38
33Id.at 22 reports that 7% of cases were disposed of by non-jury trials in twenty-one unified and General Jurisdiction Trial Courts, including Hawaii. However, non-jury trial rates vary significantly from Tennessee with a 17% non-jury trial rate (seven states have non-jury trial rates of 10% or above) to Florida with a 0.5% non-jury trial rate. Hawaii was one of seven states with a 1% non-jury trial rate.
34SeeGalanter,supranote 1.See alsoGalanter,The Vanishing Trial, DISP. RESOL. MAG., Winter 2004, at 3. 35The civil filings that Galanter followed were only a minor percentage (less than 15%) of the total federal civil docket. Consistently, the highest percentage of filings in the federal docket is bankruptcy cases, which can be up to 75% of filings.
36Galanter,supranote 1, at 461, 533–34.
37We are using the data for Hawaii terminations, not filings, but we think that gives us comparable data on trial rates. 38SeeNAT’LCENT.FORSTATECOURTS, EXAMINING THEWORK OFSTATECOURTS: ANANALYSIS OF2009 STATE COURTCASELOADS8 (2011),available athttp://www.courtstatistics.org/Other-Pages/CSP2009.aspx.
Hawaii and Federal Civil Filings 1960-2011 0 50000 100000 150000 200000 250000 300000 350000 1 9 6 0 1 9 6 3 1 9 6 6 1 9 6 9 1 9 7 2 1 9 7 5 1 9 7 8 1 9 8 1 1 9 8 4 1 9 8 7 1 9 9 0 1 9 9 3 1 9 9 6 1 9 9 9 2 0 0 2 2 0 0 5 2 0 0 8 0 1000 2000 3000 4000 5000 6000 7000 8000 9000 10000 Federal Cases Hawaii Cases Hawaii Cases Federal Cases Chart 5
There is one other significant difference when comparing Hawaii with federal filings that is not apparent when using the Galanter data for comparison. When looking at “civil” filings, Galanter used the federal court statistics on “civil” filings, which do not include bankruptcy cases. Bankruptcy cases, at times, comprise three-quarters of the federal caseload (these cases tend to fluctuate with the economic climate). For example, in 1997, near the time of our first study, there were almost 1,500,000 bankruptcy cases filed in federal court.39In contrast, in 2007, there were 800,000 bankruptcy filings.40However, by 2010, federal bankruptcy filings were again over 1,500,000 per year. Hawaii civil filings include foreclosure cases, another type of case that varies with the economic conditions. At the time of our first study in 1996, 31% of the civil docket was foreclosure cases, but in 2007 only 5% of the docket was foreclosure cases. Currently, foreclosure cases are again a large component of the civil docket in Hawaii.41
“Vanishing Trials” in Hawaii Too
One of the most frequently reported findings from Galanter’s “vanishing trials” research was that the trial rate dramatically decreased in federal courts (from 12% in 1963 to less than 2% in 2002) in the
forty-39OFFICE OFHUMANRES.ANDSTATISTICS, STATISTICSDIVISION, FEDERALJUDICIALCASELOAD: RECENTTRENDS14 (2001),available athttp(last visited Feb. 2, 2013).
40Federal District Court Workload Increases in Fiscal Year 2011,supranote 31.
41Of the 7,013 civil cases filed in 2012, 4,138 were foreclosure cases—59% of the docket. Foreclosure cases are now the largest component of the civil docket.SeeTHEJUDICIARY: STATE OFHAWAII, 2012 JUDICIARYANNUALREPORT STATISTICALSUPPLEMENT, table 7 (2012),available athttp://www.courts.state.hi.us/docs/news_
plus years from 1960 until 2002.42We reviewed Galanter’s research, supplemented it by finding the federal trial rate through 2011, and then compared the Hawaii and federal trial rates.
The trial43rates for Hawaii and the federal courts from 1962 until 2011 are shown in Chart 6 below. The comparisons between the Hawaii and federal court patterns are even more similar for trial rates than they were for total filings. Both court systems started out with trial rates of over 10% and then saw those rates continuously decrease to where the trial rates in both systems now hover near 2%.
Hawaii courts obviously had their own “vanishing trials” experience. Chart 6 shows that after averaging a 20% trial rate from 1966-1968, the trial rate in Hawaii decreased, and since 1997, the trial rate has been less than 2% each year. Although not shown in Chart 6, the jury trial rate in Hawaii has been 1% or less for every year since 1984. Although people have asked, “Where have all the trials gone?,”44we do not attempt to answer that question in this article.
Hawaii and Federal Trial Rates in Percentages 1962-2011
0 5 10 15 20 25 30 1960 1964 1968 19721976 1980 19841988 199219962000 20042008
Hawaii Trial Rate Federal Trial Rate Percentage
Chart 6 Discerning Settlements from Dispositions
Settlements were the focus of our study. Although “settlement” might sound like a clear, simple concept, there is no judicial definition uniformly used by the courts for what is a “settlement.”45Those
42Since 1984, total federal civil filings have remained relatively constant, but the federal trial rate has continued to steadily decrease from 5% to 2%.
43Hawaii and the federal courts use slightly different measures for determining what is a “trial.” The federal courts include every case that begins trial as a “trial.” Hawaii courts, on the other hand, only count completed trials as “trials” and have a separate category in its statistics for trials not completed.
44SeeHadfield,supranote 1.
who previously studied settlements used varying definitions when they computed their settlement rates.46Settlement rates may differ because of which types of dispositions are counted as a settlement, and which cases are counted as having terminated.47For example, if default judgments and abandonment of claims (giving up and not proceeding with the lawsuit for any reason) are counted as settlements, that would increase the settlement rate (especially for contract cases, which have many more default judgments and abandonments than do tort cases).48 Furthermore, previous studies have shown that settlement rates vary by the type of case49—in fact, some researchers talk of a “hierarchy” of settlement rates.50In our study, we considered a case to be settled when it was terminated.
No matter what definition of settlement is used, the most difficult determination is deciding, based upon the court records, whether a case settled or not. The problem is that docket sheets do not track settlements. Instead, docket sheets list the title of the documents filed in court. To determine whether a case settled, 51we had to draw inferences based on the titles of the documents filed in each case.52Although there may be many documents filed in a case, usually only one document represents the final termination of a lawsuit.53
Resolution—an “agreement or arrangement ending a dispute.”SeeDOUGLASYARN, DICTIONARY OFCONFLICT RESOLUTION392 (1999). This definition of settlement requires that the parties accept some solution and refrain from further disputing the matter.See alsoEisenberg & Lanvers,supranote 1, at 114. Similarly, there is no uniformly used definition for what is a “court.” In fact, there are so many definitions of what is a “court” that the National Center for State Courts, has to itself define what is a court in order to say how many courts there are in the United States.SeeNAT’LCENT. FORSTATECOURTS, A NATIONALPERSPECTIVE FROM THECOURTSTATISTICSPROJECT: EXAMINING THEWORK OFSTATE COURTS, 2006 9 (2007).
46SeeHerbert M. Kritzer,Adjudication to Settlement: Shading in the Gray, 70 JUDICATURE161, 162–64 (1986).See alsoClermont,supranote 1, at 1053–56; Eisenberg &Lanvers,supranote 1;Galanter& Cahill,supranote 1, at 1339–40.
47SeeEisenberg & Lanvers,supranote1, at 116.
48SeeGolann,supranote 1 (a study of over 3,600 Massachusetts medical malpractice claims from 2006 to 2010 that showed that in 46.4% of malpractice cases and 58.6% of claims against individual defendants (there were 1.72 defendants per claim), the plaintiffs eventually dropped the case or claim without a decision or recovery).See alsoBaar,supranote 1. Based upon a study of civil cases in Toronto, Canada from 1973 to 1994, the study found that settlement is only one of three major outcomes other than trial. The other major non-trial outcomes are default and abandonment. Both default and abandonment (also called “no disposition”) each occurred more often than settlement.
49SeeCAROLJ. DEFRANCES& STEVENK. SMITH, CONTRACTCASES INLARGECOUNTIES: CIVILJUSTICESURVEY OF STATECOURTS8 (1996),available athttp://www.bjs.gov/content/pub/pdf/ccilc.pdf (showing a 49% settlement rate for contract cases and a 73% settlement rate for tort cases). Incidentally, this study of state courts of general jurisdiction in the Nation’s 75 largest counties included Honolulu. The City and County of Honolulu, which includes the entire island of Oahu, was the venue for over 80% of the cases in our studies. Urban Honolulu has 25% of Hawaii’s population; the City and County of Honolulu (the whole island of Oahu) has 70% of Hawaii’s population.Economic Development & Tourism, HAWAIIDEPARTMENT OFBUSINESS, http://hawaii.gov/dbedt/info/census/population-estimate (last visited Sept. 5, 2012).
50Tort cases tend to have the highest settlement rate, followed by contract cases; in federal court, the settlement rates for employment discrimination cases and constitutional torts are lower.SeeEisenberg & Lanvers,supranote 1, at 135.
51Id.at 127(lamenting that most “settlements are based on inferences without express information that a case settled”).
52Id.(“Most of the categories coded as settlements are based on inferences without express information that a case settled.”).
53Of course if there were multiple parties on either side of the case, the case may have terminated at different times for different parties. This is especially true if the case did not terminate with a trial verdict.
Termination of Hawaii Cases
When looking at the docket sheets for each case, we found nine methods of termination frequently listed on the docket sheets—trial verdict, default judgment, stipulated judgment, dismissal by court for inaction, dismissal by motion, notice of dismissal with prejudice, notice of dismissal without prejudice, stipulation for dismissal, court-annexed arbitration program (CAAP)54 award accepted, and “other.” These docket entries were what the lawyers titled each pleading or motion that was filed in a case. To draw what we think are logical inferences about which terminations were settlements, we reviewed the various types of terminations available, conferred with local practitioners and court personnel, and then concluded that “stipulation for dismissal,” 55“notice of dismissal with prejudice,” 56“stipulated judgment,”57and “acceptance of a Court-Annexed Arbitration Program (CAAP) award”58 were most likely settlements.59
Based on our discussions and experience, we decided that “dismissal by motion,”60“default judgment,”61and “dismissal by court for inaction,”62 were most likely not settlements. The first two
54The Court-Annexed Arbitration Program (CAAP) is Hawaii’s mandatory, non-binding arbitration program for tort cases with a probable jury award of $150,000 or less.SeeJohn Barkai& Gene Kassebaum,Pushing the Limits on Court-Annexed Arbitration: The Hawaii Experience, 14 JUST. SYS. J. 133 (1991),available at
http://papers.ssrn.com/sol3/papers.cfm?abstract_id=1435575; John Barkai& Gene Kassebaum,Using Court-Annexed Arbitration to Reduce Litigant Costs and to Increase the Pace of Litigation, 16 PEPPERDINEL. REV. 43 (1989),available at http://papers.ssrn.com/sol3/papers.cfm?abstract_id=1435560; John Barkai& Gene Kassebaum,The Impact of Discovery Limitations on Pace, Cost and Satisfaction in Court Annexed Arbitration, 11 U. HAW. L. REV. 81 (1989),available at http://papers.ssrn.com/sol3/papers.cfm?abstract_id=1435561.
55The “stipulation for dismissal” under Hawaii Rule of Civil Procedure 41(a) indicates that the parties came to an agreement to dismiss the case—in essence, that the case settled. Haw. R. Civ. P. 41.1.
56A “notice of dismissal with prejudice” under Hawaii Rule of Civil Procedure 41 may be requested by parties or ordered by the court. A party is unlikely to dismiss his own case with prejudice unless the case was settled.Id.
57“Stipulated judgments” are agreements drafted by the parties and submitted to the court for a judge to turn into a judgment. It is an agreement between the parties on what terms the case will terminate. Although cases terminated by “stipulated judgment” have the effect of court adjudication, they are in fact settlements.
58“Acceptance of a CAAP award” means that the parties accept the arbitrator’s non-binding award and do not request a trial de novo.
59The Bureau of Justice Statistics, part of the U.S. Department of Justice, also uses estimates based upon docket sheets to determine settlement rates. They call their statistic an “agreed settlement” or “agreed judgment.”See DEFRANCES& SMITH,supranote 49.
60“Dismissal by motion” includes a variety of different substantive motions including Rule 12(b) motions for judgment on the pleadings under Hawaii Rule of Civil Procedure 12(b), summary judgment motions under Hawaii Rule of Civil Procedure 56, and any disposition by a motion adjudicated by the court. These types of terminations do not generally indicate settlements.
61A “default judgment” can be requested against the defendant under Hawaii Rule of Civil Procedure 55 when the party against whom the judgment is sought does not respond. A “default judgment” is an adjudication on the merits, and we did not consider it a settlement. Haw. R. Civ. P. 55.
require a determination on the merits of the case. A dismissal for inaction means that, for whatever reason, the plaintiff did not comply with court-imposed deadlines to keep the case moving forward. A “notice of dismissal without prejudice”63could be either a settlement or a non-settlement. To be conservative, a “dismissal for inaction” and a “notice of dismissal without prejudice” were classified as non-settlements.
After reviewing the docket-sheet data and discussing the data with local practitioners, we concluded several things about these modes of termination. First, trying to determine whether cases settled from the docket sheets will always be problematic.64Nonetheless, the docket entries provide useful information. Second, the types of terminations vary among the various types of cases. In other words, tort cases show a different pattern of terminations than do contracts, foreclosures, and “other” cases. Finally, if courts and policymakers have a serious interest in promoting settlement, we encourage them to change some record keeping practices and track dispositions and settlements more explicitly.
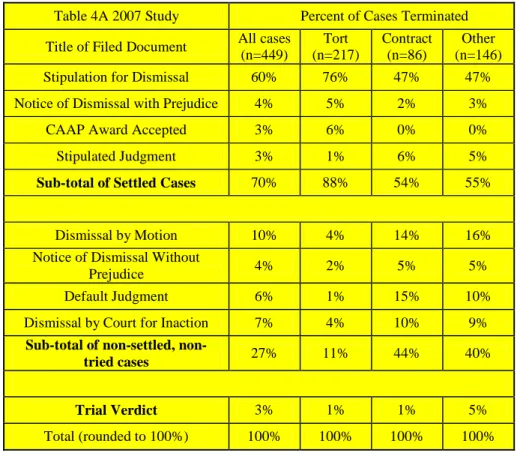
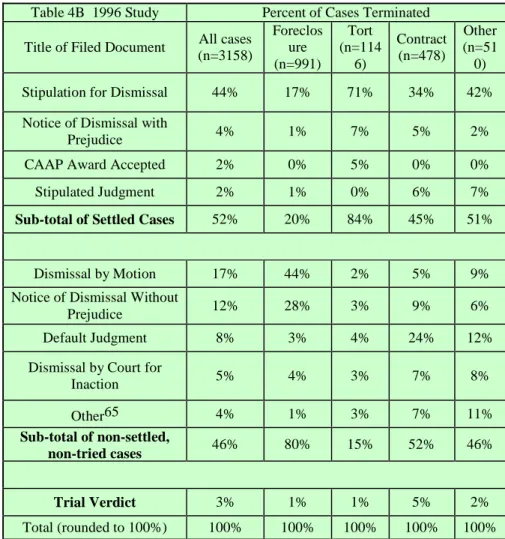
The termination data for the 2007 and 1996 studies are presented in Table 4A and 4B below. In those tables, we arranged the data to show (1) all the dispositions that we determined represent settlements, (2) those dispositions which represent non-settled/non-tried cases, and (3) trial verdicts.
29 can be entered against a plaintiff who fails to take any action after filing a complaint. Haw. R. Civ. P. 41.1.
63A “notice of dismissal without prejudice” under Hawaii Rule of Civil Procedure 41(a) allows a plaintiff to dismiss an action if it is filed before the return date, the service of an answer, or a motion for summary judgment. The court docket sheets do not provide any specific information as to why the notice was filed.Id.
64More than 25 years ago, Herbert Kritzer reached this same conclusion about docket sheet analysis with the Wisconsin Civil Litigation Research Project. Kritzer,supranote 46, at 163. The Bureau of Justice Statistics essentially compiles their statistics the same way we did—staff review each case file and code the information to determine disposition type.SeeDEFRANCES& SMITH,supranote 49.
Table 4A 2007 Study Percent of Cases Terminated Title of Filed Document All cases
(n=449) Tort (n=217) Contract (n=86) Other (n=146) Stipulation for Dismissal 60% 76% 47% 47% Notice of Dismissal with Prejudice 4% 5% 2% 3%
CAAP Award Accepted 3% 6% 0% 0% Stipulated Judgment 3% 1% 6% 5%
Sub-total of Settled Cases 70% 88% 54% 55%
Dismissal by Motion 10% 4% 14% 16% Notice of Dismissal Without
Prejudice 4% 2% 5% 5%
Default Judgment 6% 1% 15% 10% Dismissal by Court for Inaction 7% 4% 10% 9%
Sub-total of settled,
non-tried cases 27% 11% 44% 40%
Trial Verdict 3% 1% 1% 5%
Percentage of Cases That Settle and Those That Do Not
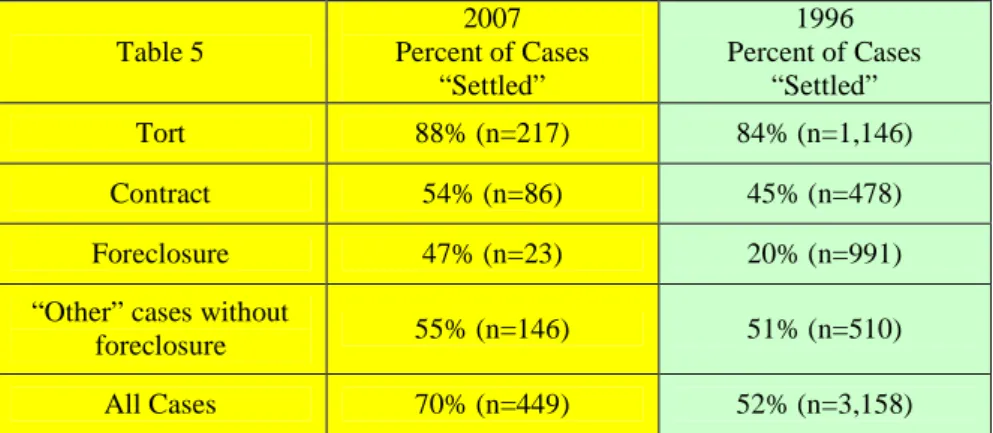
Using our classifications of modes of terminations to determine settlements, we concluded and report in Table 5 below, that in 2007,88% of tort cases, 54% of contract cases, 55% of “other,” and 70% of “all” cases settled. Our findings are in line with data from the 1992 study by the Bureau of Justice Statistics research which found a 73% settlement rate for torts and a 49% settlement rate for contract cases,65 and in line with settlement rates reported by other researchers.66
65The “other” was our “catch all” for documents titled with some case caption other than the ones we have listed. To be conservative, we classified “other” as non-settlements.
66SeeDEFRANCES& SMITH,supranote 49;see supranote 1.
Table 4B 1996 Study Percent of Cases Terminated Title of Filed Document All cases
(n=3158) Foreclos ure (n=991) Tort (n=114 6) Contract (n=478) Other (n=51 0) Stipulation for Dismissal 44% 17% 71% 34% 42% Notice of Dismissal with
Prejudice 4% 1% 7% 5% 2%
CAAP Award Accepted 2% 0% 5% 0% 0% Stipulated Judgment 2% 1% 0% 6% 7%
Sub-total of Settled Cases 52% 20% 84% 45% 51%
Dismissal by Motion 17% 44% 2% 5% 9% Notice of Dismissal Without
Prejudice 12% 28% 3% 9% 6%
Default Judgment 8% 3% 4% 24% 12% Dismissal by Court for
Inaction 5% 4% 3% 7% 8% Other65 4% 1% 3% 7% 11% Sub-total of non-settled, non-tried cases 46% 80% 15% 52% 46% Trial Verdict 3% 1% 1% 5% 2% Total (rounded to 100%) 100% 100% 100% 100% 100%
Table 5 2007 Percent of Cases “Settled” 1996 Percent of Cases “Settled” Tort 88% (n=217) 84% (n=1,146) Contract 54% (n=86) 45% (n=478) Foreclosure 47% (n=23) 20% (n=991) “Other” cases without
foreclosure 55% (n=146) 51% (n=510) All Cases 70% (n=449) 52% (n=3,158)
In 2007, the settlement rate had increased slightly for tort, contract, and “other” cases compared to our study in 1996, but increased more significantly for foreclosure (27%) and “all” (18%) cases.67Because Hawaii (and most other jurisdictions we know of) does not track settlement rates, except for our two data points of 2007 and 1996, we have no indication whether settlement rates fluctuate over time like filings do.
It is clear from our data that 95%or more of cases do not result in a settlement.68Although torts come close to a 90% settlement rate, for most other types of civil cases the settlement rate was only near 50%.
So what happens to the cases that do not end with a trial and do not settle? As seen in Table 5A below,11% of tort cases, 44% of contract cases, 40% of “other” cases, and 27% of “all” cases in our 2007 study were neither tried nor settled, which means they resolved by different means. This is not surprising because the data in Table 4A and 4B show that a higher percentage of contract and “other” cases terminated by motions (for instance, motions for summary judgment) and default judgments compared to tort cases. For example, in 2007, 14% of contract cases and 16% of “other” cases were dismissed by motion, compared to only 4% of tort cases. Likewise, 15% of contract cases and 10% of “other” cases terminated with default judgments compared to only 1% of tort cases.69Our findings are similar to findings from other researches such as the Bureau of Justice Statistics.70
67A major difference between the dockets in 2007 and 1996 was the percentage of foreclosure cases. Foreclosure cases were a small part of the 2007 study (5%) and had a settlement rate of 47%. In our 1996 study, foreclosure cases were a much larger percentage of the docket (31%) and had a settlement rate of only 20%. We believe that the general economic climate may have accounted for this difference in settlement rates for foreclosure cases. In difficult economic times, many foreclosure case filings end in a judgment of foreclosure, which accounts for a low settlement rate. In better economic times, such as during the time of the 2007 study, more home buyers were likely to be able to negotiate a settlement that might prevent a foreclosure judgment. Because foreclosure cases had a very low settlement rate and comprised almost one-third of the docket filings in 1996, having a higher settlement rate and being only 5% of the docket in 2007, greatly increased the settlement rate for “all” cases from 52% in 1996 to 70% in 2007.
68See supranote 1.
69In 1996, a more difficult economic climate than 2007, 24% of contract cases terminated by default judgment. 70The Bureau of Justice Statistics found, for tort and contract cases in the Nation’s 75 largest counties, that 26% of contract cases but only 3% of tort cases terminated by default judgment.SeeDEFRANCES& SMITH,supranote 49, at 8.
Table 5A 2007 Percent of Cases “Settled” Percent of Cases Tried71 Percent of Cases Not Tried and Not
Settled
Tort (n=217) 88% 1% 11%
Contract (n=86) 54% 1% 44%
Other (n=146) 55% 5% 40%
All Cases (n=449) 70% 3% 27%
Looking back at Table 4A, we see that termination by “stipulation for dismissal” (which we believe were the bulk of settlements) was more than twice as common as any other mode of termination.72The second most common method of case disposition was “dismissal by motion,” which was 10% of all cases terminated. Dismissal by motion is clearly adjudication and not a settlement. Disposition by motion was most commonly found in foreclosure cases (30%), but was also commonly found in contract cases (14%) and “other cases” (16%).Dismissal by motion was much less common in tort cases (4%).
“Default judgment” is especially worth noting because, although cases disposed of through “default judgment” represented only 6% of all the cases tracked, 15% of contract cases and 10% of “other” cases were disposed of in this way.73Assuming that default judgments indicate a lack of settlement, this termination method has a major impact on the settlement rate for contract and “other” cases.
Judicial Assistance and Settlement Conferences
Two survey questions asked about the use and effectiveness of judicial assistance and settlement conferences. Lawyers whose cases settled were asked if the settlement was reached with or without judicial assistance.74Often having a conference scheduled with a judge might increase the possibility of settlement, inducing lawyers to communicate with each other because of the impending conference.
As Table 6 indicates below, about one-fifth (21%) of lawyers indicated that their cases were settled with some judicial assistance, and slightly more than three-quarters (77%) of lawyers whose cases settled indicated that they reached a settlement without judicial assistance. Table 6 also shows that the 1996 data75on judicial assistance was almost identical with the 2007 data. In both studies, more than three-quarters of the cases settled without judicial assistance.
71The percent of cases tried is from the Hawaii Judiciary’s Annual Statistical Report.
72Three-quarters (76%) of tort cases and almost one-half (47%) of both contract and “other” cases were terminated by stipulations for dismissal.
73SeeOstrom et al.,supranote 32. The National Center for State Courts reported in a 7-state study in 2002 that 35% of terminated contract cases ended in a default.
74The term “judicial assistance” was not defined in the survey and therefore the interpretation of whether there was “judicial assistance “in a case probably varied between responding lawyers. “Judicial assistance” could be interpreted as events other than settlement conferences.
75In the 1996 study, a higher percentage of contract cases (32%) settled with “judicial assistance” than did non-motor vehicle torts (24%) or motor vehicle torts (18%). However, we were not able to calculate the frequency of judicial assistance for settled cases by type of case for the 2007 study because of the manner in which the data was collected.
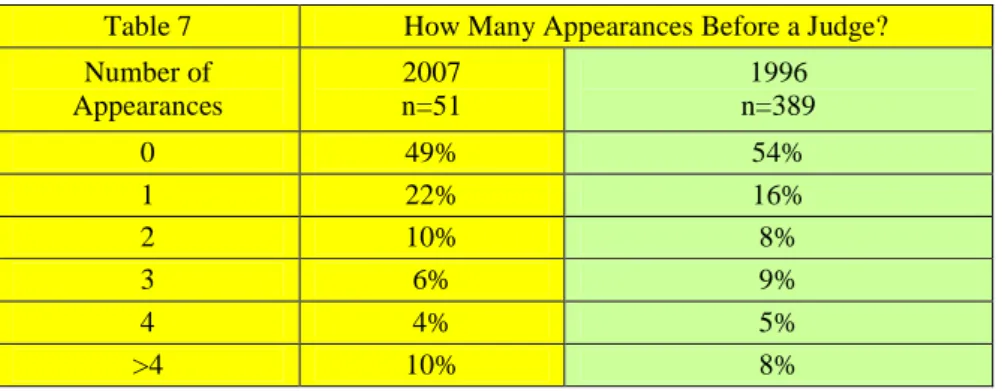
The survey asked about the total number of appearances before a judge, such as for motions, pretrial conferences, and settlement conferences. As can be seen from Table 7, in approximately one-half (49%) of the cases, lawyers did not appear before a judge. The data was consistent between the 1996 and 2007 studies.
Table 7 How Many Appearances Before a Judge? Number of Appearances 2007 n=51 1996 n=389 0 49% 54% 1 22% 16% 2 10% 8% 3 6% 9% 4 4% 5% >4 10% 8%
The survey specifically inquired about the total number of settlement conferences before a judge. As can be seen from Table 8, there were no settlement conferences in almost three-quarters (71%) of the cases. Again, the data was consistent between the 1996 and 2007 studies.
Table 8 How Many Settlement Conferences? Number of Conferences 2007 n=49 1996 n=384 0 71% 74% 1 12% 10% 2 4% 11% 3 6% 3% 4 4% 1% >4 0% 1% Table 6 2007
Settled With or Without Judicial Assistance
1996
Settled With or Without Judicial Assistance
Settled n=43 n=341
With Judicial Assistance 21% 23% Without Judicial
Assistance 77% 75%
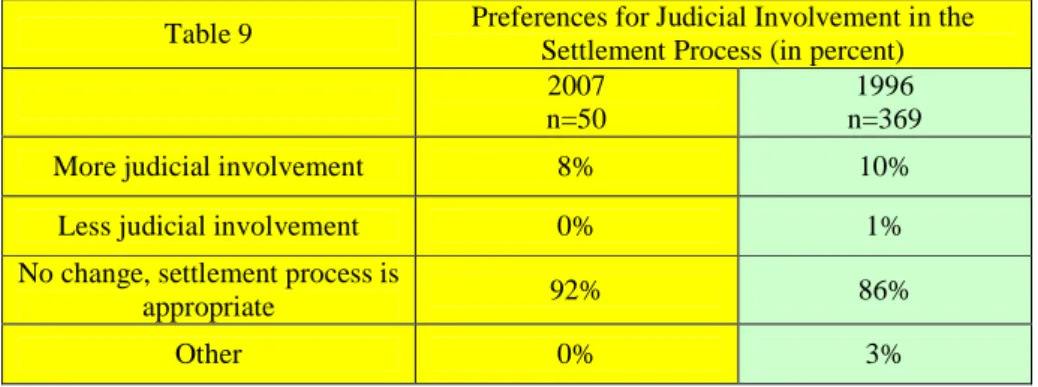
The lawyers were asked whether they wanted more judicial involvement in the settlement process. In 2007, the vast76majority of attorneys did not want more judicial involvement in the settlement process. Again, the responses in 1996 and 2007 were consistent.77
Table 9 Preferences for Judicial Involvement in the Settlement Process (in percent)
2007 n=50
1996 n=369 More judicial involvement 8% 10%
Less judicial involvement 0% 1% No change, settlement process is
appropriate 92% 86%
Other 0% 3%
Satisfaction with Settlement
The survey asked lawyers to indicate their satisfaction levels with the terms of the settlements and the settlement processes. We asked about satisfaction in two different ways because we thought it was possible that lawyers might like the settlement terms but that they might not like the settlement processor, in the alternative, might like the process but not like the terms of the settlement.
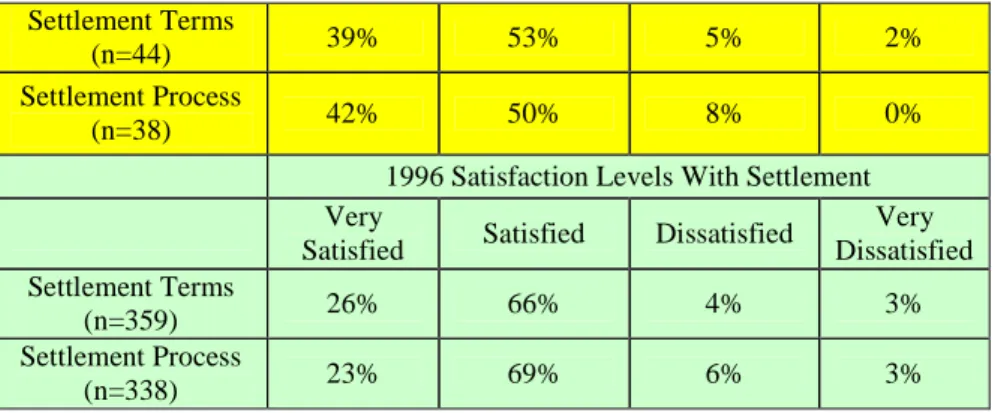
The lawyers did not seem to distinguish the terms of settlement from the process of settlement. If they liked one, they liked the other, and largely they liked both for settlements they negotiated. As seen in Table 10, in the 2007 study, 92% of lawyers were either “very satisfied” or at least “satisfied,” with both their settlement terms and settlement processes. In fact, compared to the 1996 data, the percentage of lawyers who were “very satisfied” with both the settlement terms and the settlement process had increased in the 2007 survey while the percentage of dissatisfied lawyers essentially remained the same. In fact, this finding may contradict the old adage that in a good settlement both parties should be somewhat dissatisfied.
Table 10 2007 Satisfaction Levels With Settlement Very
Satisfied Satisfied Dissatisfied
Very Dissatisfied
76We use “vast,” as used in the phrase “vast majority,” to mean statistics of 80% or more.
77We also used an open-ended survey question asking what could have been done to settle the case earlier. In response, 58% of lawyers indicated there was nothing that would have made the case settle earlier, 30% offered various ideas, and 12% of the lawyers surveyed did not answer the question. Suggestions included judge’s assistance (but only one such answer), opponent being more reasonable, a requirement that parties and insurers be present, having local counsel, earlier communication, and mandatory mediation.
Settlement Terms
(n=44) 39% 53% 5% 2%
Settlement Process
(n=38) 42% 50% 8% 0%
1996 Satisfaction Levels With Settlement Very
Satisfied Satisfied Dissatisfied
Very Dissatisfied Settlement Terms (n=359) 26% 66% 4% 3% Settlement Process (n=338) 23% 69% 6% 3% Factors in Settlement
Because we wanted to learn as much as possible about the factors affecting settlement, the longest and most complex question in the survey asked the lawyers to report on and rank the impact of methods of negotiation, meetings with and hearings before judges, and the use of ADR processes.
The survey offered a list of twelve specific events that might impact settlement and offered one additional choice listed as “other.” The lawyers were asked to check all of the listed events that occurred and then to rank which of the various events had the greatest impact on settlement.
The twelve events were grouped as follows: (1) Methods of negotiation: face-to-face negotiation between attorneys, face-to-face negotiation with attorneys and parties, telephone negotiation between attorneys, letter/fax negotiation between attorneys, e-mail 78 negotiation between attorneys, and communication with insurance agent; (2) meetings with and hearings before judges:motion for summary judgment, pretrial conference, and judicial settlement conference; and (3) various ADR processes: settlement conference, court-annexed arbitration program (CAAP) decision, binding arbitration, and mediation.
Data was analyzed by the following:(1) how often certain settlement events occurred;(2) how often various settlement events were ranked among the top three events influencing settlement;(3) what settlement event was ranked as the most important in each case; and (4) how frequently a settlement event was ranked as the most important settlement event compared to how often that event was ranked in the top three settlement events.
Table 11A below presents a summary of the factors in settlement for the 2007 study and Table 11B presents a similar summary for the 1996 study for comparison. Later tables will examine the data in greater detail and compare the two studies. Please note that the sample size for the 2007 study was quite limited—58 surveys indicated that events occurred and 47 surveys had a ranking for those events. The sample size for the 1996 study was much larger—380 surveys indicated events occurred and 230 surveys ranked those events.
The most frequently occurring events affecting settlement were negotiations that took place directly between counsel without the use of a third-party—a judge, mediator, or arbitrator. Third-party ADR
processes occurred much less frequently than did direct negotiations, but when these third-party processes did occur, they had a great impact on settlement.
Table 11A – Factors in Settlement
2007 data n=58 surveys indicated the events occurred; 47 surveys ranked the events
% Occurred % Ranked 1-3 % Ranked #1 Impact % ranked # 1 divided by #of times ranked at all Telephone negotiation between
lawyers 72% 72% 26% 35%
Face-to-face negotiation
between lawyers 57% 49% 17% 35%
Letter/fax negotiation between
lawyers 43% 32% 6% 20%
Court-annexed arbitration
(CAAP) 33% 32% 13% 40%
E-mail negotiation between
lawyers 31% 19% 4% 22%
Face-to-face negotiation with
lawyers and parties 24% 17% 11% 63%
Judicial settlement conference 17% 17% 13% 75%
Communication with insurance
agent 14% 11% 4% 40%
Motion for summary judgment 14% 11% 9% 80%
Pretrial conference 14% 6% 6% 100% Binding arbitration 7% 6% 4% 67% Mediation 2% 2% 2% 100% Other 7% 9% 9% 100% Table 11B. Factors in Settlement
1996 data n=380 surveys indicated the events occurred; 230 surveys ranked the events
% Occurred % Ranked 1-3 % Ranked #1 % ranked # 1 divided by # of times ranked at all Telephone negotiation between lawyers 80% 76% 32% 42% Letter/fax negotiation between lawyers 57% 51% 7% 14% Face-to-face negotiation between lawyers 49% 40% 14% 34% Communication with insurance agent 27% 24% 12% 51% Court-annexed arbitration (CAAP) 24% 21% 15% 69%
E-mail negotiation between
lawyers n/a n/a n/a n/a
Judicial settlement
The Most Frequently Occurring Settlement Events Chart 7 shows the frequency of the settlement events in 2007.
Face-to-face negotiation
with lawyers and parties 17% 17% 8% 50% Motion for summary
judgment 14% 10% 5% 55%
Pretrial conference 10% 7% 1% 13%
Mediation 4% 3% 2% 67%