IV. DEMOGRAPHICS - PATIENT MIX, REVENUES, EXCESS REVENUES
This section provides demographic information for the hospitals included in the study. Section IV.A reports insurance coverage based on questionnaire
responses. Section IV.B summarizes basic financial information (by revenue size) of the hospitals that reported revenues and expenses for their Form 990. Section IV.C provides financial information by community type. Section IV.D describes the demographic overlap of the community type and revenue size categories. Section IV.E provides a further breakdown by excess revenue categories.
A. Patient Insurance Coverage
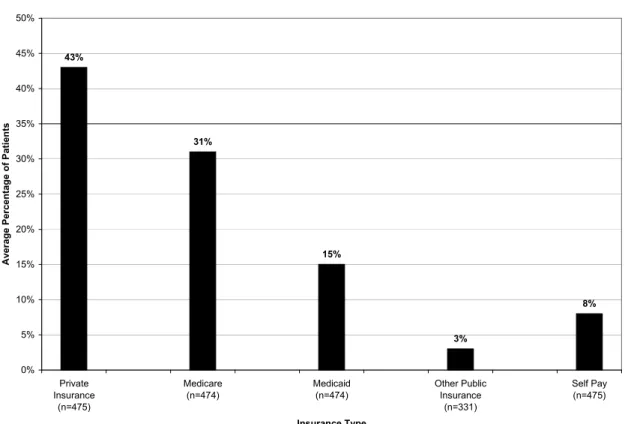
Based on 480 responses, the average percentage of patients with no insurance was 8%, with private insurance was 43%, with Medicare was 31%, with Medicaid was 15%, and with some other form of public insurance was 3%. Figure 1, below, displays the breakdown.
Figure 1. Average Percentage of Insurance Coverage
43% 31% 15% 8% 3% 0% 5% 10% 15% 20% 25% 30% 35% 40% 45% 50% Private Insurance (n=475) Medicare
(n=474) Medicaid(n=474) Other PublicInsurance (n=331) Self Pay (n=475) Insurance Type Av er ag e P erc en ta ge of P atie nts
B. Revenues and Excess Revenues By Revenue Size
This section classifies the hospitals into five revenue categories, and reports revenue, expense, and excess revenue information for these categories. Key findings of this section include the following:
1. The average and median total revenue amounts were $179 million and $89 million, respectively. The average and median excess revenue amounts were $8.3 million and $2.5 million, respectively.
2. The largest hospitals reported a disproportionately large percentage of aggregate total revenues. 7% of all hospitals (those with revenues over $500 million) reported 40% of aggregate total revenues.
3. Overall, excess revenues as a percentage of total revenues was 4.6%. Excess revenues as a percentage of total revenues was lowest for the group of hospitals with revenues under $25 million (3.3%), and increased with revenue size. Each revenue size category reported an aggregate excess revenue amount, as well as average and median excess revenue amounts, greater than zero.
4. 79% of all hospitals reported excess revenues. 39% reported excess revenues as a percentage of total revenues in the 0% to 5% range. 40% reported excess revenues as a percentage of total revenues in the over 5% range.
5. 21% of the overall group reported a deficit (total expenses greater than total revenues) or zero excess revenues. The percentage of hospitals reporting a deficit or zero excess revenues was greatest for the group of smallest hospitals (35%) and decreased with revenue size.
The aggregate annual revenues reported on Form 990 by the 488 hospitals was $87.5 billion. A relatively small number of larger hospitals reported a
disproportionately large portion of the overall reported revenues.
Figure 2, below, shows the distribution of hospitals by annual revenues and compares the percentages of hospitals in each revenue size group to the percentages of aggregate revenues reported by each group.
Figure 2. Distribution of Hospitals by Aggregate Annual Revenues
Respondent Profile Aggregate Reported Revenue
Annual Revenues # hospitals % of all $Billion
% of aggregate revenue Under $25M 85 17% $1.2 1% $25M to under $100M 173 36% $9.8 11% $100M to under $250M 133 27% $21.0 24% $250M to under $500M 61 13% $20.8 24% $500M and over 36 7% $34.7 40% Total 488 100% $87.5 100%
The smallest revenue size comprised 17% of the hospitals, but only 1% of the aggregate reported revenues. The largest group comprised 40% of aggregate revenues even though it comprised only 7% of the total number of hospitals. Figure 3, below, displays total annual revenues, total expenses, and the
excess/deficit revenues (difference between total revenues and total expenses) as reported on Form 990 for each category. Separate charts are provided below for total revenues and excess revenues.
Figure 3. Annual Total Revenues, Total Expenses, and Excess/Deficit Revenue by Revenue Size
Annual Total Revenues Annual Total Expenses Annual Excess/Deficit Revenue
Revenue Size Aggregate Average Median Aggregate Average Median Aggregate Average Median (Billion $) (Million $) (Million $) (Billion $) (Million $) (Million $) (Million $) (Million $) (Million $) Under $25M (N = 85) 1.224 14.4 15.2 1.184 13.9 15.0 40.6 0.5 0.3 $25M - Under $100M (N = 173) 9.795 56.6 56.2 9.425 54.5 52.8 370.2 2.1 1.7 $100M - Under $250M (N = 133) 20.985 157.8 152.2 20.184 151.8 146.9 801.0 6.0 4.9 $250M – Under $500M (N = 61) 20.829 341.5 330.2 19.903 326.3 310.9 925.9 15.2 16.2 $500M and Over (N = 36) 34.690 963.6 734.7 32.769 910.3 698.6 1,920.9 53.4 38.3 Overall (N = 488) 87.523 179.4 89.4 83.464 171.0 87.1 4,058.5 8.3 2.5
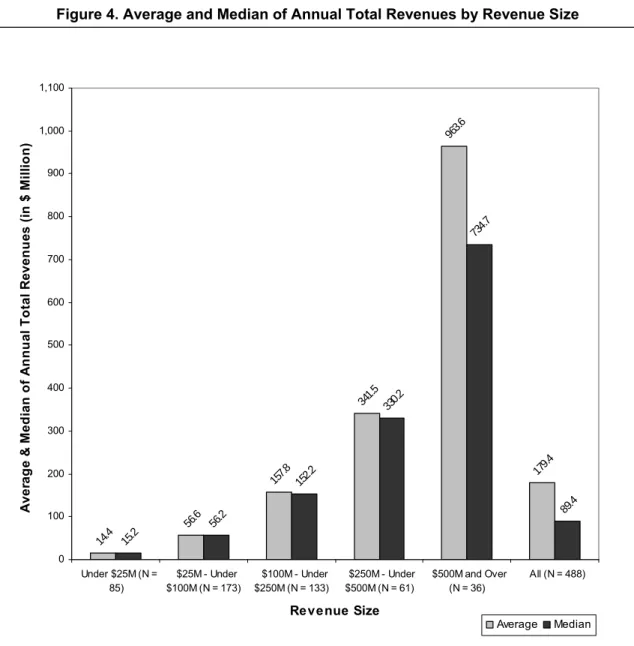
The average total annual revenue, as reported on the respondents’ Forms 990, Line 12, was $179 million, and the median was $89 million. Each revenue size category reported positive numbers for average and median excess revenues. The charts below display the average and median total revenues and excess revenue by revenue size category.
Figure 4. Average and Median of Annual Total Revenues by Revenue Size 14.4 56.6 157.8 341.5 963.6 179.4 15.2 56.2 152.2 330.2 734.7 89.4 0 100 200 300 400 500 600 700 800 900 1,000 1,100 Under $25M (N = 85) $25M - Under $100M (N = 173) $100M - Under $250M (N = 133) $250M - Under $500M (N = 61) $500M and Over (N = 36) All (N = 488) Revenue Size A ve rag e & M ed ian o f A nn ual T ot al R eve nu es (i n $ M ill io n) Average Median
In general, the average and median amounts are relatively close within each of the different groups. The difference between the average and median for hospitals with revenues of $500 million and over, however, varies more than for the others. This indicates that some relatively large hospitals have total
revenues that are much higher than the median total revenues for the $500 million and over group.
Figure 5. Average and Median of Annual Excess Revenue by Revenue Size 0.5 2.1 6.0 15.2 53.4 8.3 0.3 1.7 4.9 16.2 38.3 2.5 0 10 20 30 40 50 60 Under $25M (N = 85) $25M - Under $100M (N = 173) $100M - Under $250M (N = 133) $250M - Under $500M (N = 61) $500M and Over (N = 36) All (N = 488) Revenue Size A ver ag e & M ed ian o f A nn ua l E xce ss R eve nu e ( in $ M ill io n) Average Median
Figure 6, below, shows the reported aggregate excess revenues as a percentage of aggregate total revenues for each revenue size category and overall. These calculations are based on aggregate amounts reported in Figure 3 above. For example, the overall 4.6% figure represents $4.1 billion of aggregate excess revenues divided by $87.5 billion of aggregate total revenues.
Figure 6. Excess Revenue as a Percentage of Total Revenue
Revenue Size Excess revenue as a percentage of total revenue Under $25 million (N = 85) 3.3% $25 million to $100 million (N = 173) 3.8% $100 million to $250 million (N = 133) 3.8% $250 million to $500 million (N = 61) 4.4% Over $500 million (N = 36) 5.5% Total (N = 488) 4.6%
The aggregate excess revenue as a percentage of aggregate total revenue generally increased across the categories, from a low of 3.3% for the under $25 million category to a high of 5.5% for the over $500 million category. The overall average was 4.6%.
Figure 7, below, shows the distribution of negative/positive excess revenues as a percentage of revenues.
Figure 7. Distribution of Excess Revenue as a Percentage of Annual Total Revenue by Revenue Size
Excess Revenues as Percentage of Total Revenues Range All
0% or Negative Positive to < 2.5% 2.5% - < 5% 5% - < 10% 10% & Over
% of all % of % of % of % of % of
hospitals revenue revenue revenue revenue revenue
Revenue Size N N size N size N size N size N size Under $25M 85 17 30 35 13 15 11 13 19 22 12 14 $25M - Under $100M 173 36 39 23 29 17 41 24 43 25 21 12 $100M - Under $250M 133 27 25 19 30 23 29 22 39 29 10 8 $250M and Over 97 20 10 10 19 20 18 19 40 41 10 10 All 488 100 104 21 91 19 99 20 141 29 53 11
Figure 7, above, shows that overall 21% of the hospitals reported total expenses greater or equal to total revenues, and 39% of the hospitals reported excess revenues as a percentage of total revenues in the range of greater than 0% to 5%. 40% of all hospitals reported excess revenues as a percentage of total revenues of at least 5%; 11% reported excess revenues of at least 10% of total revenues.
The percentage of hospitals reporting a deficit or zero excess revenue decreased as revenue size increased. The $500 million and over revenue size had the smallest percentage of hospitals reporting zero or a deficit.38
38
The two largest revenue sizes were combined to prevent potential identification of respondent
C. Revenues and Excess Revenues by Community Type
This section classifies the hospitals into four community types, and reports revenue, expense, and excess revenue information for these categories. Key findings of this section include the following:
1. Rural hospitals generally reported smaller total revenues and excess revenues than did other community types. The rural community types had a disproportionately small percentage of aggregate total revenues (30% of the hospitals, 10% of aggregate revenues), while the high population community type had a disproportionately large percentage of aggregate revenues (19% of hospitals, 41% of aggregate revenues).
2. Each community type reported aggregate excess revenues and average and median excess revenues as a percentage of total revenues greater than zero. CAHs reported the smallest average and median total revenues ($29 million and $20 million, respectively) and the smallest average and median excess revenue amounts ($1.0 million and $0.5 million, respectively). High population hospitals reported the largest average and median amounts, both for total revenues ($389 million and $196 million, respectively) and for excess revenues ($17.5 million and $4.2 million, respectively).
3. CAHs reported the smallest percentage of excess revenues as a
percentage of total revenues (3.5%); rural (non-CAH) hospitals reported the largest percentage (6.0%). 34% of CAHs reported a deficit (total expenses greater than total revenues) or zero excess revenue compared to 13% for rural (non-CAH) hospitals and 21% overall.
The table below shows the distribution of hospitals and aggregate total revenues by community types.
Figure 8. Distribution of Hospitals and Total Revenues by Community Type Respondent Profile Aggregate Reported Revenue
Community Type # % $Billion %
High Population 93 19% $36.2 41%
Rural – CAH 68 14% $2.0 2%
Rural – Non CAH 78 16% $7.3 8%
Other 249 51% $42.1 48%
Total 488 100% $87.5 100%
The rural community types had a disproportionately small percentage of aggregate total revenues while the high population community type had a
disproportionately large percentage of aggregate revenues. The other urban and suburban category comprised approximately half of the number of hospitals and overall reported total revenues.
Figure 9, below, includes the aggregate, average and median total revenues, total expenses, and excess of revenues over expenses by community type. Figure 10 and Figure 11 display total revenues and excess revenues by community type.
Figure 9. Annual Total Revenues, Total Expenses, and Excess/Deficit Revenue by Community Type
Annual Total Revenues Annual Total Expenses Annual Excess/Deficit Revenue
Aggregate Average Median Aggregate Average Median Aggregate Average Median Community
Types
(Billion $) (Million $) (Million $) (Billion $) (Million $) (Million $) (Million $) (Million $) (Million $) High Population (N = 93) 36.184 389.1 195.8 34.557 371.6 196.7 1,627.5 17.5 4.2 Rural - CAH (N = 68) 1.965 28.9 19.6 1.896 27.9 19.3 69.3 1.0 0.5 Rural - Non CAH (N = 78) 7.256 93.0 67.7 6.823 87.5 64.8 433.3 5.6 3.4 Others (N = 249) 42.117 169.1 113.9 40.189 161.4 109.7 1,928.4 7.7 3.1 Overall 87.523 179.4 89.4 83.464 171.0 87.1 4,058.5 8.3 2.5
Figure 10. Average and Median Annual Total Revenue by Community Type 389.1 28.9 93.0 169.1 179.4 195.8 19.6 67.7 113.9 89.4 0 50 100 150 200 250 300 350 400 450 High Population (N = 93)
CAH (N = 68) Rural - Non CAH (N = 78) Others (N = 249) All (N = 488) Community Type A ve ra ge & M ed ia n o f A nn ua l T ot al R eve nu es (i n $ M illi on ) Average Median
The CAHs reported the smallest average and median revenue amounts of any community type. The average annual total revenue for hospitals in the high population group is more than double the average annual total revenue for hospitals in the other urban and suburban category, the next largest group, and more than double the average annual total revenue for the entire group of hospitals.
The high population group shows the largest difference between average revenue and median revenue. This deviation indicates that there are a number of extremely large hospitals (relative to the others in the group) located in high population areas.
Figure 11. Average and Median Annual Excess Revenue by Community Type 17.5 1.0 5.6 7.7 8.3 4.2 0.5 3.4 3.1 2.5 0 2 4 6 8 10 12 14 16 18 20 High Population (N = 93)
CAH (N = 68) Rural - Non CAH (N = 78) Others (N = 249) All (N = 488) Community Type A ver ag e & M ed ia n o f A nn ua l E xce ss R eve nu e ( in $ M ill io n) Average Median
As was the case with total revenues, the greatest variation between average and median excess revenue amounts was with the high population group.
The table below shows the reported excess revenues as a percentage of total revenues for each community type. These calculations are based on aggregate amounts reported in Figure 9, above. For example, the overall 4.6% figure represents $4.1 billion of aggregate excess revenues divided by $87.5 billion of aggregate total revenues.
Figure 12. Excess Revenue as a Percentage of Total Revenue by Community Type
Community Type Excess revenues as a percentage of total revenue
High population (N = 93) 4.5%
Rural - CAH (N = 68) 3.5%
Rural - Non CAH (N = 78) 6.0%
Others (N = 249) 4.6%
All 488 hospitals 4.6%
The overall measure of excess revenues as a percentage of total revenues was 4.6%. All four community types reported revenues greater than expenses for the year. The CAH community type reported the smallest percentage of excess revenues as a percentage of total revenues (3.5%) and rural (non-CAH) hospitals reported the largest percentage (6%). High population and other urban and suburban hospitals were approximately at the overall percentage.
Figure 13, below, shows the distribution of negative/positive excess revenues as a percentage of revenues by community type.
Figure 13. Distribution of Excess Revenues as a Percentage of Annual Total Revenue by Community Type
Excess Revenue as Percentage of Revenue Range All
0% or Negative Positive to < 2.5% 2.5% - < 5% 5% - < 10% 10% & Over Community Type N hospitals % of all N % of community type N % of community type N % of community type N % of community type N % of community type High Population 93 19 20 22 24 26 20 22 21 23 8 9 CAH 68 14 23 34 7 10 15 22 17 25 6 9 Rural - Non CAH 78 16 10 13 12 15 11 14 32 41 13 17 Others 249 51 51 20 48 19 53 21 71 29 26 10 All 488 100 104 21 91 19 99 20 141 29 53 11
CAHs reported the largest percentage of hospitals with a deficit or zero excess revenues, and other rural hospitals reported the smallest.
D. Relationship between Community Type and Revenue Size
The figures below show the overlap of community type and revenue size within the respondent hospitals. For example, in Figure 15, the middle vertical bar in the under $25 million revenue size shows there are 50 rural hospitals (CAH and non-CAH) under $25 million in revenue size. Figure 15 shows the distribution of community types across the revenue size categories, and Figure 16 shows the distribution of revenue size across community types.
Figure 14. Number of Hospitals by Revenue Size and Community Type
Under $25 million $25 -$100 million $100 - $250 million Over $250 million Total High Population 3 20 33 37 93 CAH/Rural Non-CAH 50 72 17 7 146 Other 32 81 83 53 249 Total 85 173 133 97 488
Figure 15. Number of Hospitals by Community Type and Revenue Size
3 20 33 37 50 72 17 7 32 81 83 53 0 10 20 30 40 50 60 70 80 90 Under $25M
(n=85) $100M (n=173)$25M under $250M (n=133)$100M under Over $250M (n=97) Revenue Size Numbe r of Ho sp ital s
Figure 16. Number of Hospitals by Revenue Size and Community Type 3 50 32 20 72 81 33 17 83 37 7 53 0 10 20 30 40 50 60 70 80 90
High Population(n=93) Critical Access/Rural Non-CAH (n=146) Other (n=249) Community Type Nu mber of Ho spi tal s Under $25M (n=85) $25M under $100M (n=173) $100M under $250M (n=133) Over $250M (n=97)
As might be expected, there generally was a strong correlation between community type and revenue size. Most rural hospitals (84%) reported total revenues under $100 million. 75% of high population hospitals reported total revenues over $100 million, and high population hospitals constituted 58% of these reporting total revenues over $500 million.39 More than 20% of high population hospitals and more than 5% of other urban and suburban hospitals were in the over $500 million revenue size. More than 55% of CAHs were in the lowest revenue size.
E. Groupings by Excess Revenues
The previous sections reported revenues and excess revenues based on revenue size and community type categories. This section classifies the 488 hospitals into five categories based on the amounts of the excess revenues over expenses reported on the Forms 990. Overall, the hospitals reported $4.1 billion of excess revenues. Figure 17, below, shows the distribution of hospitals and aggregate excess revenues by these five excess revenue categories.
39
The two groups of rural hospitals and the two largest revenue sizes were combined in the
Figure 17. Distribution of Hospitals and Aggregate Excess Revenue by Excess Revenue Size
Respondent Profile Aggregate Reported Excess Revenue
Annual Excess Revenues # % $M %
$0 or under 104 21% $-373 -9% $1 to under $2.5M 138 28% $158 4% $2.5M to under $7.5M 109 22% $484 12% $7.5M to under $15M 60 12% $647 16% $15 M and over 77 16% $3,143 77% Total 488 100% $4,059 100%
The table shows the bulk of reported excess revenues was reported by a
relatively small group of hospitals. The group of hospitals reporting $15 million or more of excess revenues comprised 16% of the hospitals, but reported 77% of the aggregate excess revenues.
The table below displays total revenues, total expenses, and the excess/deficit revenues for each excess revenue category listed above. Figure 19 and Figure 20 display total revenues and excess revenues by excess revenue category.
Figure 18. Annual Total Revenues, Total Expenses, and Excess/Deficit Revenues by Excess Revenue Size
Annual Total Revenues Annual Total Expenses Annual Excess/Deficit Revenue
Excess Revenue
Size Aggregate Average Median Aggregate Average Median Aggregate Average Median (Billion $) (Million $) (Million $) (Billion $) (Million $) (Million $) (Million $) (Million $) (Million $) $0 or Under (N = 104) 10.525 101.2 57.1 10.898 104.8 59.5 -373.3 -3.6 -1.6 $1 - Under $2.5M (N = 138) 7.543 54.7 32.5 7.385 53.5 32.0 158.3 1.1 1.2 $2.5M - Under $7.5M (N = 109) 13.389 122.8 83.3 12.905 118.4 76.9 484.1 4.4 4.0 $7.5M - Under $15M (N = 60) 12.798 213.3 178.8 12.151 202.5 168.7 646.6 10.8 10.8 $15M or Over (N = 77) 43.268 561.9 386.7 40.126 521.1 357.2 3,142.9 40.8 29.5 Overall (N=488) 87.523 179.4 89.4 83.464 171.0 87.1 4,058.5 8.3 2.5
Figure 19. Average and Median Annual Total Revenue by Excess Revenue Size 101. 2 54.7 122.8 213.3 561. 9 179.4 57.1 32.5 83.3 178.8 386. 7 89.4 0 100 200 300 400 500 600 700 $0 or Under (N = 104) $1 - Under $2.5M (N = 138) $2.5M -Under $7.5M (N = 109) $7.5M -Under $15M (N = 60) $15M or Over (N = 77) All (N = 488)
Excess Revenue Size
A ve ra ge & M edia n of A nnua l Tot al R ev enue s ( in $ M illion ) Average Median
Figure 20. Average and Median Annual Excess Revenue by Excess Revenue Size -3.6 1.1 4.4 10.8 40.8 8.3 -1.6 1.2 4.0 10.8 29.5 2.5 -4 6 16 26 36 46 $0 or Under (N = 104) $1 - Under $2.5M (N = 138) $2.5M - Under $7.5M (N = 109) $7.5M - Under $15M (N = 60) $15M or Over (N = 77) All (N = 488)
Excess Revenue Size
A ve ar ge & M edia n of A nnua l E xcess R eve nu e ( in $ M ill ion) Average Median
Figure 19 shows that hospitals with deficits or the smallest excess revenues tended to be those with lower total revenues (under $123 million average, under $83 million median).
Figure 21, below, shows the distribution of negative/positive excess revenues as a percentage of annual revenues by excess revenue sizes.
Figure 21. Distribution of Excess Revenue as a Percentage of Annual Total Revenue by Excess Revenue Size
Excess Revenue as a Percentage of Annual Revenue Range
All 0% or
Negative Positive to < 5% 5% - < 10% 10% or Over
% of all % of % of % of % of
hospitals revenue revenue revenue revenue
Excess Revenue Size
N N size N size N size N size Negative & 0 104 21 104 100 0 - 0 - 0 - $1 - Under $2.5M 138 28 0 - 104 75 26 19 8 6 $2.5M - Under $7.5M 109 22 0 - 55 51 40 37 14 13 $7.5M - Under $15M 60 12 0 - 20 33 29 48 11 18 $15M or Over 77 16 0 - 11 14 46 60 20 26 All 488 100 104 21 190 39 141 29 53 11
Most of the hospitals in the $1 to under $7.5 million ranges (64%) reported excess revenues under 5% of total revenues. Most of the hospitals in the $7.5 million or over ranges (55%) reported excess revenues in the 5% to under 10% level.