Prepared By:
Rohem Adagbon
& Melissa Gu
Georgian College
Research Analyst
Post-Grad Program
Prepared By:
Rohem Adagbon
& Melissa Gu
Georgian College
Research Analyst
Post-Grad Program
D
ERHAKI
RELAND ● Global Executive Search & Management AssessmentCo-Sponsored By
:
2013 National Salary Survey
Combined Report
Advertising & Promotion Agency Report
Digital Advertising & Marketing
Marketers, Clients & CPG Report
Marketing Research Report
Media Companies, Publishers & Broadcasters
Page 2
D
ERHAKI
RELAND ● Global Executive Search & Management Assessment 2013 DERHAK / Georgian National Salary SurveyAcknowledgements
The 2013 National Salary Survey report was prepared by Georgian
College Research Analyst Post-Graduate students: Rohem Adagbon
and Melissa Gu, with the sponsorship of D
ERHAKI
RELANDExecutive
Search and participation from the following professional associations:
Association of Canadian Advertisers (ACA),
Canadian Marketing Association (CMA),
Canadian Public Relations Society (CPRS),
Interactive Advertising Bureau of Canada (IAB), and
Public Affairs Association of Canada (PAAC).
Special thanks go to the following people for their contribution to
survey development, quality control and compilation of the salary
tables: Jeff Cole (Research Analyst Post-Graduate Program
Coordinator, Georgian College), Jacquelyn Salnek (Research Analyst
Program Professor, Georgian College), Wayne Percy (Sr. Partner,
D
ERHAKI
RELANDExecutive Search) and Jonathan Pientka (HR Intern
– Humber College).
Notes about this Report:
We have attempted to include as many
positions as possible and sources of data as possible including the
CPG Survey, Digital and Traditional Ad Agency reports etc. In a few
cases we received less than 4 responses including Junior to Senior
resulting in extremely broad salary ranges.
Table of Contents
Introduction ... 3
Methodology & Sampling ... 3
Definition of Terms ...
4
Salary Survey Findings ... 4
Advertising Salary Tables ... 6
Digital Salary Table ... 8
Digital Salary Table ... 8
Marketers & CPG Salary Tables ... 10
Marketing Research Salary Tables ... 12
Media, Publishers & Broadcaster Salary Tables ... 14
Public Affairs & Public Relations ... 16
Compensation Benefits ... 18
Confidentiality
The 2013 survey is developed and managed by Georgian
Post-Graduate Research Analyst program students: Rohem Adagbon and
Melissa Gu, who analyzed and produced the final report under the
guidance of Professors Jeff Cole and Jacquelyn Salnek as part of a
Major Research project. Results were kept completely confidential to
only Melissa and Rohem.
Our sponsor, D
ERHAKI
RELAND; Canada’s ONLY Privacy Certified
Search or Recruiting firm, did not have access to any of the raw data.
Page 3
D
ERHAKI
RELAND ● Global Executive Search & Management Assessment 2013 DERHAK / Georgian National Salary SurveyMethodology & Sampling
The 2013 project was administered through an online survey hosted
on FluidSurveys Platform. The survey was deployed on April 30
th,
2013 and was extended to a final closure date of July 10
th, 2013.
Multiple email invites were sent to over 600 companies through the
co-sponsor organizations and Derhak Ireland contacts. The invitation
lists included contact information of Human Resources
representatives and Executives located countrywide; for a combined
total of approximately 600 companies / employers and 4500 individual
contacts.
Following initial survey deployment for all surveys, three sets of email
reminders were sent the weeks of May 19 & 26, June 9
th& 16 and
July 9
th& 10
th. Word document versions of individual salary surveys
were sent to partial and incomplete responses along with email
reminders. Finally, telephone follow-up and validation was conducted
for the salary survey on July 8
thand 18
th. The total of 136 ‘complete’
responses for the Salary Survey resulted in a 95% confidence level
with a ± 8 margin of error for the salary survey. Overall, the team
successfully elicited 554 responses for the Hiring Trends survey with
a completion rate of approximately 20% of the total contacts.
Introduction
Welcome to the 2013 D
ERHAK/
Georgian National Salary
Survey project. The objective of this project is to produce a
national-level report with reliable and most up-to-date information on salary
band and company-wide benefits of marketing services related job
positions across six main sectors in the marketing industry which
includes:
Traditional Advertising Agencies
Digital and Online Agencies,
Media Companies: Publishers & Broadcasters
Client Advertisers and Marketers,
Market Research,
Public Relations and Public Affairs.
As the employment market is dynamic and is continuously changing,
companies need to develop a competitive employment and
compensation strategy. This project provides valuable salary
information and is offered as a hiring and compensation planning
guide for Human Resources (HR) Managers and Executives across
Canada.
For additional information or for copies of previous salary surveys,
visit:
www.Derhak.com
> Salary Surveys
Page 4
D
ERHAKI
RELAND ● Global Executive Search & Management Assessment 2013 DERHAK / Georgian National Salary SurveySalary Survey Findings
Participant Company Overview by Industry Sectors
By Sector: a third of the 136 companies that responded and
participated in the study were Client Marketers (35% or 48
companies) progressing through to Digital only Advertising Agencies
(10% or 14 agencies) and then Media Companies at 9% were the
least represented sectors.
By Location
: The response rate to the survey invitations was much
higher in Ontario (75% - home of most of the national head offices)
than in other regions; with the Prairies (12%) and Maritimes (10%)
having the least number of participants.
35%
17%
15%
14%
10%
9%
Proportion of Participants by Sector Client Marketer
Market Research Agency
Traditional Advertising Agency
Public Relations Agency
Digital (Online) Advertising Agency
Media AgencyMediaCompanies
Definition of Terms
For the purposes of this survey, the following industry sector and
salary definitions have been provided.
Industry Sector Definitions
Advertising Agency (Traditional)
This sector refers to agencies that provide advertising services on behalf of a client
organization. This also includes: media-buying, ad, promotional and event agencies.
Digital Advertising Agency
Also called online advertising, refers to agencies that strictly provide online advertising services on behalf of a client organization. Typically includes digital media-buying departments.
Marketers, Clients & CPG
This sector pertains to any company that uses agencies to advertise or market their products. This includes: CPG, Banking/Financial, Retail, Telco, Automotive and Pharma.
Market Research Refers to agencies that provide market research services to a Client organization. This also includes data collection and data analysis agencies.
Media Companies: Publishers & Broadcasters
Refers to media companies such as publishers and broadcasting companies.
Public Relations & Public Affairs Agencies
Refers to agencies that provide public
communications and affairs services. This includes government relations and communications
agencies.
Salary Refers to the total compensation salary for the
position. It includes base pay, bonus/commission and cash component of profit sharing plan.
BC 25% Prairies 12% Ontario 75% Quebec 21% Maritimes 10%
Page 5
D
ERHAKI
RELAND ● Global Executive Search & Management Assessment 2013 DERHAK / Georgian National Salary SurveyNotably, company size distribution differed within each sector (
See
chart below
). The majority of the large companies (more than 500
employees) were from the Client Marketer and Media Companies;
while micro (1-4 employees) company participants have highest
presence in the Market Research and PR / PR sectors. The data
findings are weighted to companies in the marketing industry with
sizes similar to those listed above.
6% 48% 39% 14% 38% 42% 39% 44% 74% 57% 17% 25% 9% 6% 21% 29% 38% 33% 4% 11% 5% Client
Marketer AgencyMedia ResearchMarket Agency Public Relations Agency Traditional Advertising Agency Digital (Online) Advertising Agency
Company Size Distribution within Sectors
Large 500+ Medium 100-499 Small 5-99 Micro 1-4
By Company Size
: The survey included participating companies of all
sizes, which have been grouped by the number of employees,
according
to
Canadian
Industry
Statistics
employee
size
classifications. Close to half (47%) of participants are from small
companies with 5-99 employees. Medium and Large employers
represent 37% of the participants but a much higher percent of the
employee population.
See details of company size distribution below.
Company Size Distribution
Company size
% of Total
Participant
Companies
# of
Companies
Micro: 1-4
employees
17%
23
Small: 5-99
employees
47%
62
Medium: 100-499
employees
17%
22
Large: 500+
employees
20%
26
Total
100%
133**
Page 6
D
ERHAKI
RELAND ● Global Executive Search & Management Assessment 2013 DERHAK / Georgian National Salary SurveyCorporate Functions
Cont’d MINIMUM MAXIMUM AVERAGE MEDIAN
Administrative Assistant $30,000 $52,000 $38,074 $35,000 Receptionist $30,000 $60,000 $42,208 $40,150 Office Manager $35,000 $75,000 $58,206 $60,000 Marketing Coordinator $32,000 $40,000 $36,313 $36,250 Director of Marketing $75,000 $100,000 $87,500 $87,500 Vice President, Marketing/Business Development $150,000 $260,000 $202,000 $200,000 Accounts Payable / Receivable Coordinator $30,000 $51,500 $40,650 $40,000 Accountant $36,000 $72,620 $49,586 $48,000 Controller $60,000 $120,000 $88,429 $86,000 Vice President of Finance $117,500 $140,000 $128,188 $127,500 Recruiter $32,000 $82,250 $50,153 $46,795 Administrator/Executive Assistant * $48,650 $72,000 $59,217 $57,000 Human Resources Manager $45,000 $100,000 $64,100 $60,000 Training and Recruitment Coordinator $50,000 $82,250 $68,375 $70,000 Human Resources Director/Assistant VP $65,000 $119,500 $87,813 $85,000 Vice President of Human Resources * $181,000 $209,842 $195,421 $195,421
NOTE: Due to the 20% completion rate (only 1 in every 5 job positions answered on average by survey respondents), some surveyed positions are omitted from these tables as un-reportable; some other positions such as (junior and senior levels of a given function) have been merged where necessary to permit reporting, resulting in some unusually wide salary ranges shown. Please consider the average or median results.
Advertising Agency Salary Tables
(Including Traditional Full Service, Promotional Agencies; excluding Digital & New Media only Agencies)
Salary tables are organized by the 6 identified sectors. For each table, Minimum,
Maximum, Average and Median salary information is displayed in each column and
positions are displayed in rows. Positions are organized by function and sub-functions,
and sorted in ascending order by median salary. Positions with low samples are
represented with an asterisk (*)
POSITIONS BY
FUNCTION MINIMUM MAXIMUM AVERAGE MEDIAN
Corporate Management
Partner* $100,000 $175,000 $131,667 $120,000 Executive Vice President $65,000 $250,000 $155,796 $150,000 CFO $80,000 $308,200 $168,600 $155,000 COO $100,000 $225,000 $165,000 $162,500 Managing Partner $100,000 $280,000 $187,000 $180,000 President/Owner/CEO $130,000 $550,000 $326,841 $300,000
Corporate Functions
Services & Support
Manager $32,000 $92,800 $47,543 $38,000 PC Support Specialist $22,000 $75,000 $48,965 $50,000 Systems Administrator $37,500 $73,500 $54,846 $55,000 Network Administration Manager $45,000 $94,000 $69,367 $69,200 Vice President, Technology Strategy $90,000 $115,000 $101,000 $100,000 Public Relations Manager/Consultant * $36,000 $75,000 $51,333 $43,000 Public Relations/ Communication Director * $60,000 $104,500 $85,833 $93,000 * LOW SAMPLE SIZE
Page 7
D
ERHAKI
RELAND ● Global Executive Search & Management Assessment 2013 DERHAK / Georgian National Salary SurveyMedia Media/Broadcast Assistant * $30,000 $40,000 $35,000 $35,000 Media Coordinator $34,000 $40,400 $37,940 $40,000 Media Strategist * $36,000 $80,000 $58,000 $58,000 Digital Planner/Strategist $36,000 $112,700 $71,140 $72,000 Media Planning Supervisor/Manager * $73,000 $115,000 $92,000 $88,000 Media/Planning Buyer Director $65,000 $90,000 $77,500 $77,500 Vice President of Media/Media Director * $135,000 $149,500 $142,250 $142,250
Creative MINIMUM MAXIMUM AVERAGE MEDIAN
Copy Writer $28,000 $114,000 $67,016 $65,300 Art Director $40,000 $105,000 $74,586 $72,000 Designer $28,000 $80,000 $52,949 $54,000 Senior Designer $46,000 $145,000 $78,500 $70,000 Web Producer $45,000 $110,000 $76,000 $80,000 Creative Producer $36,000 $95,000 $58,250 $51,000 Creative Director/VP $50,000 $216,000 $132,312 $125,000
* LOW SAMPLE SIZE
Account Management MINIMUM MAXIMUM AVERAGE MEDIAN
Account Coordinator $32,000 $48,000 $37,750 $36,750 Account
Manager/Supervisor $30,000 $86,800 $55,225 $54,000 Account Director $100,000 $120,000 $89,226 $90,000 Group Account Director $100,000 $156,600 $120,145 $115,000 Client Service
Director/VP $87,300 $216,000 $142,222 $142,000 Senior Vice President of
Client Service $105,000 $295,000 $175,741 $165,000
Project Management MINIMUM MAXIMUM AVERAGE MEDIAN
Project Assistant * $35,000 $37,500 $36,250 $36,250 Project Manager $42,000 $91,000 $59,265 $50,000 Senior Project Manager $45,000 $110,000 $65,229 $53,600 Project Director $55,000 $80,000 $68,000 $70,000 Production Assistant $32,000 $40,000 $36,700 $37,500 Senior Production Manager $43,000 $78,000 $54,167 $50,500 Production Manager $40,000 $88,000 $59,933 $57,550 Production Director $50,000 $88,700 $67,283 $67,500 Strategy Account Planner/Integrated Program Manager/Director $50,000 $75,000 $59,961 $59,460 Strategic Planner $41,000 $125,000 $78,000 $75,000 Research/Insights Manager $45,000 $105,000 $77,143 $80,000 Director of Strategy $95,000 $185,000 $129,200 $120,000 Vice President, Strategy/Insight $125,000 $175,000 $150,500 $150,000 NOTE: Due to the 20% completion rate (only 1 in every 5 job positions answered on average by survey respondents), some surveyed positions are omitted from these tables as un-reportable; some other positions such as (junior and senior levels of a given function) have been merged where necessary to permit reporting, resulting in some unusually wide salary ranges shown. Please consider the average or median results.
Page 8
D
ERHAKI
RELAND ● Global Executive Search & Management Assessment 2013 DERHAK / Georgian National Salary SurveyAccount Management Account Coordinator $35,000 $55,000 $42,167 $40,000 Integrated Program Manager/Planner $51,000 $70,000 $63,333 $65,000 Account Manager/Supervisor $56,000 $100,000 $66,249 $63,000 Account/Client Service Director $80,000 $183,712 $128,329 $135,000 Senior Vice President of
Client Service * $175,000 $295,000 $235,000 $235,000
Project Management
Project Assistant $45,000 $68,792 $55,662 $54,428 Project Manager $60,000 $119,153 $79,577 $80,000 Senior Project Manager $80,000 $129,570 $107,209 $110,000 Project Director $120,000 $197,843 $156,961 $155,000 Production Manager $70,000 $90,000 $79,667 $79,000 Production Director * $110,000 $130,000 $120,000 $120,000 Strategy Business Analyst $85,000 $101,847 $93,057 $94,935 Strategic Planner $50,000 $110,000 $70,607 $65,000 Research/Insights Manager $50,000 $161,000 $99,200 $105,000 Director of Strategy $120,000 $240,000 $168,640 $150,000 Vice President, Strategy/Insight * $185,000 $292,500 $225,833 $200,000 Media
Digital Media Specialist $38,000 $85,000 $58,250 $55,000 Sr. Social Media
Strategist $58,000 $106,000 $73,714 $71,000 Director, Digital Media $90,000 $140,000 $113,750 $112,500
NOTE: Due to the 20% completion rate (only 1 in every 5 job positions answered on average by survey respondents), some surveyed positions are omitted from these tables as un-reportable; some other positions such as (junior and senior levels of a given function) have been merged where necessary to permit reporting, resulting in some unusually wide salary ranges shown. Please consider the average or median results.
Digital Advertising Agency Salary
Tables
Salary tables are organized by the 6 identified sectors. For each table, Minimum,
Maximum, Average and Median salary information is displayed in each column and
positions are displayed in rows. Positions are organized by function and sub-functions,
and sorted in ascending order by median salary. Positions with low samples are
represented with an asterisk (*)
POSITIONS BY
FUNCTION MINIMUM MAXIMUM AVERAGE MEDIAN
Corporate Management President/Owner/CEO $175,000 $500,000 $373,600 $410,500 Corporate Functions IT Manager/Systems Administrator $65,000 $120,000 $91,703 $92,000 Vice President, Technology $100,000 $270,000 $182,000 $180,000 Administrative Assistant * $33,000 $37,492 $35,246 $35,246 Marketing Coordinator * $35,000 $60,000 $45,000 $40,000 Vice President, Marketing $120,000 $333,334 $212,056 $184,500 Accounts Payable / Receivable Coordinator $39,400 $58,191 $45,023 $41,250 Accountant/Financial Manager $61,500 $120,000 $80,375 $70,000 Controller/VP of Finance/CFO $85,000 $180,000 $131,550 $122,750 Training and Recruitment $40,000 $120,000 $69,772 $60,000 Human Resources
Manager $55,000 $100,000 $72,678 $68,500 Human Resources
Director/VP $90,000 $198,147 $137,787 $131,500 * Low Sample Size
Page 9
D
ERHAKI
RELAND ● Global Executive Search & Management Assessment 2013 DERHAK / Georgian National Salary SurveyAd Operations Ad Operations Specialist * $38,000 $75,000 $56,500 $56,500 Director, Ad Operations * $107,069 $110,000 $108,535 $108,535 Development & Technology Database Administrator * $50,000 $87,000 $68,500 $68,500 Flash Developer $55,000 $75,000 $69,000 $75,000 Application Developer $58,000 $117,500 $84,437 $86,341 Database Developer/Manager $75,000 $120,000 $97,366 $90,000 Technical/Information Architect $60,000 $130,000 $83,588 $85,000 Systems Integrators $77,500 $110,000 $91,125 $88,500 Systems Architect $92,000 $144,995 $123,951 $129,405 Web Designer * $60,000 $94,500 $79,833 $85,000 Web/Interface Developer $57,500 $150,382 $88,074 $84,818 Quality Assurance Analyst $57,750 $89,881 $75,346 $83,750 Business Analyst $93,726 $102,500 $98,394 $98,675 Director of Technology $120,000 $192,247 $139,312 $122,500 * Low Sample Size
NOTE: Due to the 20% completion rate (only 1 in every 5 job positions answered on average by survey respondents), some surveyed positions are omitted from these tables as un-reportable; some other positions such as (junior and senior levels of a given function) have been merged where necessary to permit reporting, resulting in some unusually wide salary ranges shown. Please consider the average or median results.
Paid Search Marketing & Search Engine
Optimization MINIMUM MAXIMUM AVERAGE MEDIAN
SEM/SEO Specialist $34,400 $60,000 $49,888 $50,000 Campaign Manager $39,000 $58,000 * * SEO Optimization Strategist $44,000 $57,000 $50,078 * SEO/SEM Account Strategist $45,000 $80,000 $67,500 $72,500 Director, Search * $77,500 $120,000 $98,750 $98,750 Vice President, Search $100,000 $200,000 $150,000 $150,000
Web Analytics
Reporting Analyst $40,000 $75,000 $53,428 $49,356 Web Analyst $40,000 $77,464 $61,866 $65,000 Senior Web Analyst $57,750 $100,000 $82,350 $84,000 Director, Web Analytics * $120,000 $140,000 $130,000 $130,000
Creative Designer $40,000 $70,000 $50,393 $45,000 Senior Designer $55,000 $100,000 $77,856 $78,212 Web Producer * $65,000 $95,000 $81,667 $85,000 UX Designer $50,000 $120,000 $91,250 $97,500 Jr. Copy Writer $35,000 $51,000 * * Copy Writer $40,000 $125,000 $71,376 $67,500 Online Editor $51,000 $83,000 $65,745 * Art Director $60,000 $125,000 $93,738 $101,771 Creative Director $95,000 $222,747 $154,655 $150,000 VP, Creative * $120,000 $220,000 $180,000 $200,000 Branded Content Community Manager $24,000 $75,000 $48,800 $40,000 Content Producer Jr to Sr $37,000 $200,000 $96,167 $85,000 Content Manager $47,000 $66,000 $55,974 *
Page 10
D
ERHAKI
RELAND ● Global Executive Search & Management Assessment 2013 DERHAK / Georgian National Salary SurveyCorporate Functions
Cont’d MINIMUM MAXIMUM AVERAGE MEDIAN
Bilingual Customer Care
Representative $32,500 $50,500 $42,850 $43,100 Customer Care Representative $29,000 $60,000 $45,694 $47,500 Customer Care Administrator $25,000 $55,000 $43,857 $45,000 Public Relations Consultant $96,800 $136,100 $115,300 $114,150 Receptionist $25,000 $62,149 $40,922 $40,000 Office Manager $30,000 $84,100 $58,871 $57,000 Marketing Coordinator $30,000 $76,800 $50,445 $49,250 Assistant Brand/Product Manager $40,000 $75,000 $59,200 $61,000 Brand/Product Manager $52,000 $127,000 $79,548 $74,000 Mkt. Project Manager $42,800 $130,000 $80,344 $77,500 Advertising Manager $48,400 $171,000 $84,012 $77,500 Senior Brand/Product Manager $65,000 $159,200 $99,369 $95,500 Director of Marketing/Advertising $64,000 $290,000 $127,561 $113,600 Assistant Vice President
of Marketing/Advertising $95,000 $160,000 $113,857 $110,000 Vice President of
Marketing/Advertising $110,000 $403,600 $183,010 $150,000
NOTE: Due to the 20% completion rate (only 1 in every 5 job positions answered on average by survey respondents), some surveyed positions are omitted from these tables as un-reportable; some other positions such as (junior and senior levels of a given function) have been merged where necessary to permit reporting, resulting in some unusually wide salary ranges shown. Please consider the average or median results.
Client Marketer Salary Tables
Salary tables are organized by the 6 identified sectors. For each table, Minimum,
Maximum, Average and Median salary information is displayed in each column and
positions are displayed in rows. Positions are organized by function and sub-functions,
and sorted in ascending order by median salary. Positions with low samples are
represented with an asterisk (*)
POSITIONS BY
FUNCTION MINIMUM MAXIMUM AVERAGE MEDIAN
Corporate Management CFO/Senior VP of Finance and Administration $96,000 $822,874 $253,021 $160,000 Senior Vice-President
Sourcing and Supply Chain
$84,000 $673,399 $296,880 $234,000 Senior Vice-President
Sales and Marketing
$96,000 $803,546 $264,770 $235,000 CEO $144,000 $2,611,591 $714,318 $246,000 President $125,000 $1,025,900 $321,856 $250,000 Partner/Managing Partner $120,000 $500,000 $258,000 $250,000 COO $130,000 $982,792 $507,723 $459,050 Corporate Functions
Services & Support
Staff $25,000 $56,000 $40,867 $40,000 PC Support Specialist $39,500 $105,000 $61,788 $55,250 Services & Support
Manager $45,000 $110,000 $68,750 $60,000 Network Manager $60,000 $99,300 $75,717 $67,500 System Administrator $42,000 $94,100 $71,692 $72,600 IT Manager $55,000 $169,500 $106,947 $101,000 Vice President, Technology Strategy $67,078 $396,000 $199,163 $190,250
Page 11
D
ERHAKI
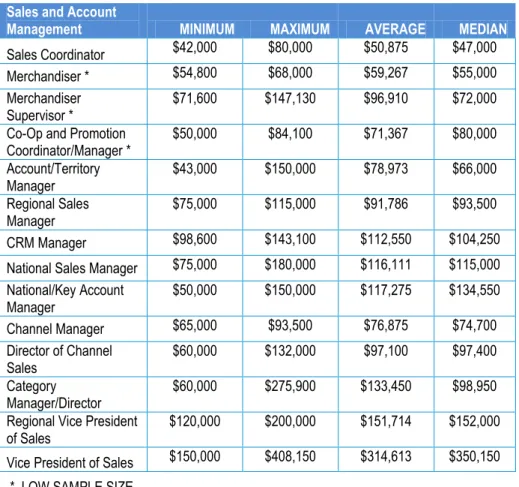
RELAND ● Global Executive Search & Management Assessment 2013 DERHAK / Georgian National Salary SurveySales and Account
Management MINIMUM MAXIMUM AVERAGE MEDIAN
Sales Coordinator $42,000 $80,000 $50,875 $47,000 Merchandiser * $54,800 $68,000 $59,267 $55,000 Merchandiser
Supervisor * $71,600 $147,130 $96,910 $72,000 Co-Op and Promotion
Coordinator/Manager * $50,000 $84,100 $71,367 $80,000 Account/Territory Manager $43,000 $150,000 $78,973 $66,000 Regional Sales Manager $75,000 $115,000 $91,786 $93,500 CRM Manager $98,600 $143,100 $112,550 $104,250 National Sales Manager $75,000 $180,000 $116,111 $115,000 National/Key Account Manager $50,000 $150,000 $117,275 $134,550 Channel Manager $65,000 $93,500 $76,875 $74,700 Director of Channel Sales $60,000 $132,000 $97,100 $97,400 Category Manager/Director $60,000 $275,900 $133,450 $98,950 Regional Vice President
of Sales $120,000 $200,000 $151,714 $152,000 Vice President of Sales $150,000 $408,150 $314,613 $350,150 * LOW SAMPLE SIZE
Corporate Functions
Cont’d MINIMUM MAXIMUM AVERAGE MEDIAN
Graphic Designer $49,000 $85,000 $65,423 $62,400 Design Manager $50,000 $99,800 $77,833 $76,000 Web Master/SEO/On-Line Manager $60,000 $99,000 $79,820 $78,000 Research Analyst $45,000 $62,000 $54,451 $55,000 Marketing Research Manager $65,000 $156,868 $88,678 $85,000 Consumer Insights /Research Director $81,000 $160,000 $98,625 $91,875 Loyalty Program Manager $48,000 $119,000 $74,171 $72,000 Accounts Payable/Receivable Coordinator $35,000 $96,000 $51,988 $48,000 Accountant $46,000 $99,100 $67,917 $64,900 Financial Officer $64,000 $188,000 $113,725 $104,000 Controller $82,000 $125,000 $103,092 $106,100 Vice President of Finance $130,000 $711,100 $281,850 $197,500 Administrator/ Executive Assistant $33,200 $65,000 $53,089 $57,000 Recruiter $42,000 $107,000 $68,100 $67,700 Human Resources Manager $65,500 $101,300 $88,320 $95,700 Human Resources Director $62,000 $162,000 $138,417 $155,150 Senior Director of Human
Resources $87,000 $239,600 $153,960 $133,700 Assistant Vice President
of Human Resources
$161,000 $200,000 $180,800 $181,100 Vice President of Human
Resources * $240,000 $277,000 $258,500 $258,500 NOTE: Due to the 20% completion rate (only 1 in every 5 job positions answered on average by survey respondents), some surveyed positions are omitted from these tables as un-reportable; some other positions such as (junior and senior levels of a given function) have been merged where necessary to permit reporting, resulting in some unusually wide salary ranges shown. Please consider the average or median results.
Page 12
D
ERHAKI
RELAND ● Global Executive Search & Management Assessment 2013 DERHAK / Georgian National Salary SurveyCorporate Management
Cont’d MINIMUM MAXIMUM AVERAGE MEDIAN
Accounts Payable / Receivable Coordinator $39,700 $60,000 $40,000 $44,360 Executive Assistant /Administrator $45,000 $56,000 $53,500 $52,000 Accountant $46,000 $74,000 $57,500 $58,750 Recruiter/Benefits
Manager/HR Manager & Director $47,000 $75,200 $67,000 $65,442 Financial Manager /Officer /Controller $67,500 $89,000 $78,000 $77,500 Vice President, Human
Resources * $158,000 $160,000 $159,000 $159,000 Account Management (Field Suppliers) Account Coordinator * $40,000 $50,000 $45,000 $45,000 Senior Analyst $42,000 $66,000 $52,000 $53,000 Account Supervisor /Manager * $60,000 $60,000 $60,000 $60,000 Research Consultant /Research Manager * $75,000 $80,000 $77,500 $77,500 Account Director /Research Director $65,000 $80,000 $74,000 $73,250 Vice President * $150,000 $185,000 $168,333 $170,000 * LOW SAMPLE SIZE
NOTE: Due to the 20% completion rate (only 1 in every 5 job positions answered on average by survey respondents), some surveyed positions are omitted from these tables as un-reportable; some other positions such as (junior and senior levels of a given function) have been merged where necessary to permit reporting, resulting in some unusually wide salary ranges shown. Please consider the average or median results.
Marketing Research Salary Tables
Salary tables are organized by the 6 identified sectors. For each table, Minimum,
Maximum, Average and Median salary information is displayed in each column and
positions are displayed in rows. Positions are organized by function and sub-functions,
and sorted in ascending order by median salary. Positions with low samples are
represented with an asterisk (*)
POSITIONS BY
FUNCTION MINIMUM MAXIMUM AVERAGE MEDIAN
Corporate Management
Owner $70,000 $300,000 $125,000 $150,833 Partner
/ Managing Partner * $140,000 $200,000 $170,000 $170,000 Executive Vice President/
COO $100,000 $260,000 $175,000 $179,244 CFO/ Vice President of
Finance $125,500 $260,000 $233,130 $200,506 President/CEO $100,000 $325,000 $260,209 $249,532 Corporate Functions IT Junior Analyst / PC Support Specialist $34,800 $75,000 $47,412 $51,134 Systems Administrator /IT Manager $59,000 $100,000 $83,000 $76,536 Vice President, Technology * $130,500 $160,000 $145,250 $145,250 Receptionist $26,500 $35,500 $34,800 $32,540 Administrative Assistant $35,000 $71,500 $49,080 $49,797 Office Manager $31,200 $87,500 $45,000 $50,046 Marketing Coordinator $35,000 $55,000 $45,000 $44,333 Marketing Director * $64,000 $93,300 $78,650 $78,650 Vice President of Marketing * $106,050 $140,000 $111,000 $119,017
Page 13
D
ERHAKI
RELAND ● Global Executive Search & Management Assessment 2013 DERHAK / Georgian National Salary SurveyProject Management
(Field Suppliers) MINIMUM MAXIMUM AVERAGE MEDIAN
Call Centre Supervisor * $30,000 $35,000 $32,500 $32,500 Assistant Call Centre
Manager * $42,000 $80,000 $45,000 $55,667 Project Delivery/Execution Interviewer $21,000 $26,500 $25,500 $24,857 Logistics Coordinator/Specialist * $24,500 $46,000 $35,250 $35,250 Field Coordinator $35,900 $62,500 $43,500 $45,233 Team Lead * $34,000 $70,000 $52,000 $52,000 Panel Administrator * $45,000 $53,300 $47,800 $48,700 Panel Supervisor/Manager $51,100 $70,250 $56,000 $58,292 Data Analyst $32,000 $56,000 $47,500 $46,380 Programmer $39,000 $60,300 $48,300 $49,920 Project Analyst $48,000 $63,000 $53,000 $54,200 Senior Programmer $54,000 $90,000 $80,000 $74,800 Coder * $21,300 $33,100 $28,000 $27,467 Coding Team Lead/Manager/Data Manager $42,000 $52,500 $48,500 $47,875 Operations Manager $76,000 $100,000 $88,000 $88,000 Operations Director $90,000 $103,000 $95,000 $95,400 Vice-President Operations $94,500 $190,000 $113,000 $127,625
* LOW SAMPLE SIZE
NOTE: Due to the 20% completion rate (only 1 in every 5 job positions answered on average by survey respondents), some surveyed positions are omitted from these tables as un-reportable; some other positions such as (junior and senior levels of a given function) have been merged where necessary to permit reporting, resulting in some unusually wide salary ranges shown. Please consider the average or median results.
Account Management
(Custom Research) MINIMUM MAXIMUM AVERAGE MEDIAN
Client Service Associate * $42,000 $46,000 $43,000 $43,667 Client Services Manager * $45,000 $54,200 $49,600 $49,600 Account Executive
/Manager $51,700 $110,000 $60,000 $68,643 Research Analyst
/Associate $40,000 $65,000 $45,000 $48,333 Senior Research Manager
/Senior Consultant $61,400 $120,000 $77,500 $80,300 Omnibus Director * $82,700 $93,480 $85,000 $87,060 Senior Research Director
/Assistant Vice President $86,150 $133,000 $116,250 $112,356 Qualitative Recruiter * $40,000 $41,600 $40,800 $40,800 Focus Group/Facility Coordinator * $46,000 $53,000 $49,600 $49,533 Moderator/Senior Moderator $60,000 $120,000 $79,000 $85,500 Vice President, Qualitative/Quantitative Research $109,000 $156,000 $137,500 $136,370 Statistical Analyst $35,000 $80,000 $47,000 $52,250 Senior Analyst/Senior Data
Analyst $55,000 $92,200 $69,600 $71,760 Vice President, Analytics $110,000 $140,000 $121,000 $123,000
Project Management (Custom Research) Facilities Manager * $43,000 $47,000 $45,000 $45,000 Production Specialist $39,600 $58,500 $50,000 $48,930 Research/Project Coordinator $39,400 $59,000 $50,000 $49,067 Program/Project Manager $45,700 $70,000 $60,000 $57,559 Project Director $62,000 $75,000 $68,500 $68,500 Senior Project Director $75,000 $90,000 $82,500 $82,500
Page 14
D
ERHAKI
RELAND ● Global Executive Search & Management Assessment 2013 DERHAK / Georgian National Salary SurveyHuman Resources MINIMUM MAXIMUM AVERAGE MEDIAN
Training and Recruitment
Coordinator * $47,752 $59,120 $50,000 $52,291 Executive Assistant $51,341 $66,200 $58,000 $57,347 Benefits/Human Resources Manager $87,667 $117,673 $108,518 $105,059 Human Resources Director $115,000 $150,000 $133,747 $133,416 Assistant Vice President
of Human Resources * $163,287 $224,205 $199,359 $195,617 VP Human Resources * $252,000 $294,580 $266,000 $270,860
Creative, Editorial & Content
Graphics Designer $30,000 $76,609 $50,000 $55,293 Web Producer $42,000 $85,239 $77,095 $71,649 Online/Senior Editor $36,000 $63,450 $51,926 $50,617 Copy Writer $35,000 $78,900 $67,873 $56,503 Multimedia Editor $38,854 $70,783 $61,500 $59,501 Online Reporter/Writer $30,000 $72,257 $68,568 $60,510 Art Director $55,000 $85,000 $79,630 $74,574 Editor-in-Chief $76,300 $119,774 $103,868 $99,438 Sales
Customer Service Rep $38,900 $60,300 $45,000 $47,421 Buying
Manager/Supervisor * $62,000 $77,200 $62,600 $67,267 Account Manager/Sales
Executive $55,000 $225,000 $101,717 $107,411 Senior Account Manager $66,200 $255,000 $114,962 $121,594 Director, Client Services $70,000 $149,000 $112,500 $111,000
Marketing Marketing Coordinator $41,000 $47,000 $42,100 $43,050 Product/Brand/Marketing Manager $45,000 $99,000 $72,019 $75,639 Brand/Marketing/ Senior Product Manager $60,400 $102,284 $88,843 $83,105 Sr Marketing Manager/ Director of Marketing $80,000 $160,000 $107,409 $115,388 VP Marketing * $125,000 $157,000 $141,000 $141,000 * Low Sample Size
Media Companies: Publishers &
Broadcaster Salary Tables
POSITIONS BY
FUNCTION MINIMUM MAXIMUM AVERAGE MEDIAN
Corporate Management Vice President/Senior VP * $126,000 $205,000 $131,900 $154,300 Executive VP /COO $150,000 $375,000 $200,000 $219,000 CFO/ VP of Finance $140,000 $454,965 $283,972 $275,526 President/CEO $250,000 $595,000 $340,000 $375,500 Corporate Functions PC Support Specialist $45,200 $66,344 $54,700 $56,209 Services & Support
Manager * $55,000 $81,200 $60,000 $65,400 Sr. Systems Administrator $58,952 $71,000 $67,535 $66,140 IT Manager $40,000 $112,000 $79,802 $78,272 Technical Manager * $78,498 $85,092 $83,359 $82,316 Network Administration Manager * $45,000 $140,000 $92,500 $92,500 Vice President, Technology Strategy $95,000 $349,998 $206,000 $214,250 Public Relations Manager/Consultant $76,381 $83,841 $79,282 $79,528 Director Public Relations/Communications $98,025 $128,668 $106,574 $109,960 Receptionist $28,000 $51,941 $36,800 $37,148 Administrative Assistant $28,000 $55,744 $45,185 $44,305 Office Manager * $42,000 $65,700 $60,099 $55,933 Accounts Payable / Receivable Coordinator $30,000 $57,777 $47,050 $46,570 Accountant $55,000 $71,338 $66,992 $65,550 Financial Manager/Officer $69,500 $90,984 $82,622 $82,616 Controller $67,358 $162,000 $93,092 $105,870 NOTE: Due to the 20% completion rate (only 1 in every 5 job positions answered on average by survey respondents), some surveyed positions are omitted from these tables as un-reportable; some other positions such as (junior and senior levels of a given function) have been merged where necessary to permit reporting, resulting in some unusually wide salary ranges shown. Please consider the average or median results.
Page 15
D
ERHAKI
RELAND ● Global Executive Search & Management Assessment 2013 DERHAK / Georgian National Salary SurveyDigital Positions in
Traditional Advertising
Agencies
POSITIONS BY
FUNCTION MINIMUM MAXIMUM AVERAGE MEDIAN
Corporate Functions
IT Manager $58,000 $125,000 $92,250 $95,000
Media
Digital Media Buyer $35,300 $60,000 $45,075 $42,500 Online Community
Manager * $40,000 $63,300 $51,650 $51,650
Creative
UX Designer * $55,000 $79,250 $67,125 $67,125
For Additional Information; Salary Reports of other segments or other
years, please visit the
D
ERHAKI
RELANDwebsite: www.Derhak.com
and check under Clients > Salary Surveys
Development &
Technology MINIMUM MAXIMUM AVERAGE MEDIAN
Interface Developer $42,000 $62,000 $59,569 $55,785 Web Designer $56,083 $74,500 $61,158 $63,600 Flash Developer $42,000 $84,000 $66,247 $64,623 Database Developer * $42,000 $90,000 $68,000 $66,667 Web Developer $61,158 $85,000 $68,411 $69,868 Database Administrator/ Manager * $60,000 $85,000 $65,406 $70,135 Information Architect $69,476 $75,487 $71,916 $72,199 Application Developer $65,336 $77,891 $74,085 $72,515 Project Manager $53,200 $92,500 $73,978 $74,055 Senior Project Manager/Director, Project Management $85,000 $115,509 $109,788 $103,591 Program Manager/ Director $83,000 $132,365 $109,000 $107,491 Director, Technology * $80,000 $160,000 $126,774 $122,258
Paid Search Marketing & Search Engine Optimization
SEO/SEM Strategist $44,000 $57,000 * * Search Engine Developer/Specialist * $45,000 $75,000 $60,000 $60,000 VP Search Engine Mkt $108,000 $153,000 * * Overall Operations QA Analyst $42,000 $80,000 $50,604 $55,802 Project Coordinator/ Operations Manager * $45,000 $100,000 $75,000 $73,333 Ad Operations Ad Operations Specialist/Technical Specialist * $56,200 $64,400 $57,519 $59,373 Manager, Ad Operations * $66,000 $107,000 $86,500 $86,500 Public Relations Communications Manager/Supervisor * $55,000 $72,800 $64,700 $64,167 * Low Sample Size
Page 16
D
ERHAKI
RELAND ● Global Executive Search & Management Assessment 2013 DERHAK / Georgian National Salary SurveyCorporate Functions
Cont’d MINIMUM MAXIMUM AVERAGE MEDIAN
Accounts Payable / Receivable Coordinator $42,500 $55,000 $45,000 $47,300 Financial Officer/Manager $55,000 $72,000 $63,500 $63,500 Administrator/ Executive Assistant $50,000 $75,000 $67,500 $65,250 Accountant/Controller $74,000 $128,500 $101,000 $96,100 Benefits/ Human Resources Manager $110,000 $140,000 $125,000 $125,000 Director/ VP of Human Resources $109,500 $325,000 $212,500 $215,750 Account Management Public Relations/ External Relations Consultant $22,000 $73,500 $55,000 $50,278 Communications Officer/Specialist /Advisor $46,500 $85,000 $65,000 $66,500 Public Affairs /Communications Director $91,600 $104,000 $96,500 $97,150 Account Coordinator/ Associate Consultant $22,000 $50,000 $35,000 $34,455 Account Manager/Executive * $55,000 $60,000 $60,000 $58,333 Senior Account Manager $75,000 $87,000 $77,000 $79,000 Account Director $67,500 $100,000 $95,000 $89,375 Vice President $125,000 $180,000 $146,000 $135,000 Senior Vice President * $140,000 $150,000 $145,000 $145,000 * LOW SAMPLE SIZE
Public Relations & Public Affairs
Salary Tables
Salary tables are organized by the 6 identified sectors. For each table, Minimum,
Maximum, Average and Median salary information is displayed in each column and
positions are displayed in rows. Positions are organized by function and sub-functions,
and sorted in ascending order by median salary. Positions with low samples are
represented with an asterisk (*)
POSITIONS BY
FUNCTION MINIMUM MAXIMUM AVERAGE MEDIAN
Corporate Management
Owner $55,000 $200,000 $125,000 $122,500 President/CEO $85,000 $500,000 $250,000 $247,517 Executive Vice President $175,000 $320,000 $260,000 $251,000 Partner/ Managing
Partner * $250,000 $300,100 $275,050 $275,050 CFO/ Vice President of
Finance $168,000 $375,000 $335,000 $303,250
Corporate Functions
PC Support Specialist * $50,000 $65,000 $57,500 $57,500 Services & Support
Manager * $57,000 $72,000 $65,000 $64,667 IT/Technical Support Specialist $53,500 $82,000 $65,000 $67,333 Vice President, Technology Strategy * $260,000 $375,000 $320,000 $318,333 Receptionist/ Office Manager $34,000 $45,000 $37,000 $39,000 Administrative Assistant/Marketing Coordinator $37,500 $55,000 $47,500 $46,375 Marketing Communications Manager $77,000 $140,000 $110,000 $115,400 Marketing/Creative Director $118,000 $200,000 $160,000 $160,600
Page 17
D
ERHAKI
RELAND ● Global Executive Search & Management Assessment 2013 DERHAK / Georgian National Salary Survey
For Additional Information; Salary Reports of other segments or other
years, please visit the
D
ERHAKI
RELANDwebsite: www.Derhak.com
and check under Clients > Salary Surveys
Project Management MINIMUM MAXIMUM AVERAGE MEDIAN
Digital & Social Media Coordinator * $40,000 $95,000 $67,500 $67,500 Team Supervisor/Leader Manager * $95,000 $140,000 $117,500 $117,500 Support and Management Roles Customer Experience/Analytics * $48,000 $105,000 $85,000 $79,333 Social Media Strategist * $55,000 $105,000 $85,000 $81,667
Advertising Agency Staff Public Relations Manager/Consultant* $36,000 $75,000 $51,333 $43,000 Public Relations/ Communications Director* $60,000 $104,500 $85,833 $93,000
Client Side Roles
Web Master/SEO/
On-Line Manager $60,000 $99,000 $79,820 $78,000 Public Relations
Consultant $96,800 $136,100 $115,300 $114,150 CRM Manager $98,600 $143,100 $112,550 $104,250 * LOW SAMPLE SIZE
NOTE: Due to the 20% completion rate (only 1 in every 5 job positions answered on average by survey respondents), some surveyed positions are omitted from these tables as un-reportable; some other positions such as (junior and senior levels of a given function) have been merged where necessary to permit reporting, resulting in some unusually wide salary ranges shown. Please consider the average or median results.
Page 18
D
ERHAKI
RELAND ● Global Executive Search & Management Assessment 2013 DERHAK / Georgian National Salary SurveyBy Company Size: Larger Companies Lead in All Benefits
Predictably, size of the company plays a key role in the type of
benefits offered. As company size increases, the more
comprehensive the benefits plan offered becomes. In particular,
larger companies (over 500 employees) are more likely to provide
pension plan (74%) compared to the less than 40% of companies that
offer the same within all other company size groups. This is likely due
to the amount of resources and the types of employees (i.e. part time
vs. full time employees) present within smaller companies compared
to larger companies.
24% 39% 74% 30% 17% 44% 56% 58% 43% 17% 59% 61% 84% 55% 26% 89% 100% 100% 80%Micro 1-4 Small 5-99 Medium 100-499 Large 500+ Total Industry Companies of Different Sizes Benefit Offers
Extended Health Benefits Education Benefit Car Allowance Pension Plan
Compensation Benefits
Entire Industry Overview - Extended Health Benefits is No.1
In general, 4 in 5 employers (79%) choose to invest in overall
wellness of their employees by providing extended health benefits.
These include: Dental care (98%), Drug (97%), Vision (82%) and
Massage (79%) coverage; while less than half (48%) offer wellness
benefits. This indicates that companies within the Canadian
Marketing industry have highly developed and comprehensive
extended health benefits plans. Participant companies are also
supportive of employee career development with over half offering
education benefits (55%). Car allowance (43%) and Pension Plan
(30%) were the least popular options.
30% 43% 55% 79% Pension
Plan AllowanceCar EducationBenefit ExtendedHealth Benefit Proportion of Companies
Offer Benefits - Total Industry
98% 97%
82% 79%
48%
Dental
Care Drug Vision Massage WellnessBenefit Type of Extended Health
Benefits Offered - Total Industry
Page 19
D
ERHAKI
RELAND ● Global Executive Search & Management Assessment 2013 DERHAK / Georgian National Salary SurveyPension Plans Offered
The top three most frequently offered pension plans are: Grouped
Registered Retirement Savings Plan (54%), Defined Contribution Plan
(40%), and Defined Benefit Pension Plan (34%). This suggests that
companies in the Canadian Marketing industry do not generally use
pension plans as an incentive to retain talent and are divided on the
type of pension plan to offer.
Though less than half (43%) of total participating companies provide
car allowances, this number is still more than those that provide
pension plans overall. Gas or mileage reimbursements (72%) and
monthly car allowance (66%) are the most common types of car
allowance.
54% 40% 34% 23% 14% 11% Group Registered Retirement Savings Plan DefinedContribution Plan Defined BenefitPension Plan Savings PlanEmployee Deferred ProfitSharing Plan Employee SharePurchase Plan
Types of Pension Plan Offered - Total Industry
By Sector: Media / Publisher & Client Marketer Leading Benefits
Providers
Due to the high presence of large companies (more than 500
employees) in Media / Publisher / Broadcasters and Client Marketer
sectors, these sectors are leading benefits providers and are higher
than the overall industry standard (See below). Both of these sectors
are especially dominant in certain types of benefits. Following the
conclusions about large company size and increased benefits
offerings above, a high proportion (75%) of Media / Publishers
surveyed provided a pension plan while Client Marketer companies
(74%) lead in education benefits. Traditional Advertising agencies
(74%) lead in offering a car allowance. Digital agencies, Market
Research agencies and PR / PA agencies are below total industry
standards across all benefits; Market Research agencies have the
lowest percentage of overall benefits offering among all sectors.
75% 44% 16% 25% 19% 9% 30% 58% 56% 74% 25% 25% 13% 43% 50% 74% 58% 50% 50% 35% 55% 100% 85% 95% 75% 63% 61% 79% Media
Agency MarketerClient AdvertisingTraditional Agency Digital (Online) Advertising Agency Public Relations Agency Market Research Agency Total Industry Benefits Offered by Sector vs. Total Industry Standard
Extended Health Benefits Education Benefit Car Allowance Pension Plan
Page 20
D
ERHAKI
RELAND ● Global Executive Search & Management Assessment 2013 DERHAK / Georgian National Salary SurveyTuition Support Prevalent
Over half (55%) of participating companies are willing to support
employee development by providing education benefits. Specifically,
almost all companies (92%) choose to fully or partially support tuition
fees incurred from job-related education.
For additional information or for copies of previous salary
surveys, visit:
www.Derhak.com
> Salary Surveys
Gas/Mileage Reimbursement Most Common
Though less than half (43%) of total participating companies provide
car allowances, this number is still more than those that provide
pension plans overall. Gas or mileage reimbursements (72%) and
monthly car allowance (66%) are the most common types of car
allowance
Page 21
D
ERHAKI
RELAND ● Global Executive Search & Management Assessment 2013 DERHAK / Georgian National Salary Surveywww.Derhak.com
Our Appreciation to:
Thank you to the Georgian RAP Program Post-Grad Students who did most of the work,
Rohem Adagbon & Melissa Gu
D
ERHAKI
RELAND●
Global Executive Search
65 International Blvd. Suite 100,Toronto, ON, M9W 6L9