A BUOYANCY IN THE COMMODITY TRADING –
A ROAD MAP
Dr.(Mrs.)S.KALAISELVI,
Lecturer and Head,
P G Department of Commerce with Computer Applications, Vellalar College for Women, Erode, India
ABSTRACT
Commodity trading is nothing but trading in commodity derivatives (futures or options). Commodity derivatives are traded at the commodity exchanges. There are currently 2 major commodity exchanges NCDEX (National Commodity and Derivative Exchange) and MCX (Multi-Commodity Exchange). Gold, Silver, Agri-commodities including grains, pulses, spices, oils and oilseeds, mentha oil, metals and crude are some of the commodities that the exchanges deal in. Trading in commodities futures is quite similar to equity futures trading. Commodity market is a promising avenue for investments offering huge opportunities and enabling diversification of portfolio. Commodity
tradingis a kind of financial trading in which primary products, such as food, metals and
energy, are bought and sold. Trading in commodities is mostly undertaken on contracts that are based on such commodities. Commodities trading is also called futures trading. India, among the top five producers of most of the agricultural commodities and a leading consumer of bullion and energy products, would immensely benefit from a robust commodity futures market. While the commodity derivatives markets have been in existence in the country for a while now, the gradual withdrawal of prohibition on futures trading since 2003 has paved way for the development of new exchanges and adoption of modern technologies and international practices. The agricultural commodities dominated the futures trading market in the initial years, bullion and metals have overtaken in terms of volumes post 2006-07. Future may bring to focus energy and electricity-sector-oriented products. The efficacy of the futures markets to deliver benefits to the economy can be enhanced through a strong regulatory framework, wide-spread dissemination of futures and spot prices all over the country and education, training and awareness programmes for the various stakeholders, particularly the farmers. Limited direct participation by farmers in the future markets has resulted in the potential benefits being restricted to traders, large corporates and speculators. Attention would need to be given to complex contract designs, lack of access to price information, restricted credit access, etc. that have limited farmers’ participation. This paper gives a birds eye view on the commodity trading in the global scenario.
Keywords : National Commodity and Derivative Exchange (NCDEX), Multi-Commodity
Exchange (MCX), Nation-wide Multi-Commodity Exchanges (NMCE), Forward Markets
Commission (FMC), Dow Jones AIG Commodity Index (DJAIG), Reuters/Jefferies Commodity Research Bureau (RJCRB) and Exchanged-Traded Funds (ETFs)
INTRODUCTION
Commodity trading is nothing but trading in commodity derivatives (futures or options). Commodity derivatives are traded at the commodity exchanges. There are currently 2 major commodity exchanges NCDEX (National Commodity and Derivative Exchange) and MCX (Multi-Commodity Exchange). Gold, Silver, Agri-commodities including grains, pulses, spices, oils and oilseeds, mentha oil, metals and crude are some of the commodities that the exchanges deal in. Trading in commodities futures is quite similar to equity futures trading. Commodity market is a promising avenue for investments
offering huge opportunities and enabling diversification of portfolio. Commodity tradingis a kind of
financial trading in which primary products, such as food, metals and energy, are bought and sold. Trading in commodities is mostly undertaken on contracts that are based on such commodities. Commodities trading is also called futures trading.
Some famous commodity exchanges are the Chicago Climate Exchange, Hedge Street Exchange, CME Group, Central Japan Commodity Exchange, Dubai Mercantile Exchange, Tokyo Commodity Exchange and London Metal Exchange. There are two different types of markets for commodity trading. Spot markets are where immediate trading takes place. This includes personal purchases as well as spot trading on a much larger scale like trading in oil or large quantities of gold. The other market involves future trading. Here, a contract is traded, rather than the commodity. International commodity trading is a multi-billion dollar business, and on average, the number of trades executed on commodity exchanges are about five times as much as those on major stock exchanges.
Origin of Commodity market: The history of organized commodity futures market in India goes back to the nineteenth century when the cotton trade association started futures trading in 1875 followed by derivatives trading in oilseeds in Bombay (1900), raw jute and jute goods in Calcutta (1912), wheat in Hapur (1913) and bullion in Bombay (1920). Post independence, the Indian constitution listed the subject of “Stock Exchanges and Futures Markets” under the union list and a legislation called Forward Contract Act 1952 was enacted, on the basis of recommendations of the Shroff Committee providing legal framework for organized forward trading. The first organized future trading was by the India Pepper and Spices Trade Association (IPSTA) in Cochin in 1957. However, futures trade was prohibited in most of the commodities thereafter. Since then both the Dantawala Committee (1966) and the Khusro Committee (1980) have recommended the revival of futures trading in agricultural commodities.
After the 1991 reforms, the Government set up a Committee in 1993 headed by Dr.K.N. Kabra to examine the role of futures trading. The committee recommended that futures trading in 17 commodities be permitted. Further, National Agricultural Policy (2000) and the expert committee on strengthening and developing Agricultural Marketing (2001, Guru Committee) supported commodity futures trading. In February 2003, the government revoked the ban and accepted most of the recommendations allowing futures trading in 54 commodities in bullion and agricultural sectors. Responding positively to the favourable policy changes, several Nation-wide Multi-Commodity Exchanges (NMCE) were up since 2002, using modern practices such as electronic trading and clearing. The Forward Markets Commission (FMC) regulates these exchanges.
Structure of Commodity Market in India: Trading in commodity market takes place in two distinct forms such as the Over-The-Counter (OTC), which is basically spot market and the exchange-based market. Further, as in equities, there exists the spot where participation is restricted to people who are involved with that commodity, such as the farmer, processor, wholesaler, etc. and the derivatives segments where trading takes place through the exchange-based markets like equity derivatives. At present, there
are 25 exchanges operating in India and carrying out futures trading activities in as many as 146 commodity items. As per the recommendation of the FMC, the Government of India recognized the National Multi-Commodity Exchange (NMCE), Ahmedabad; Multi Commodity Exchange (MCX) and National Commodity and Derivative Exchange (NCDEX), Mumbai, as nation-wide multicommodity exchanges. NMCE commenced in November 2002 and MCX in November 2003 and NCDEX in December 2003. Unlike the stock markets, the commodity markets in India have a single product (only futures) and a single user (only traders including corporates).
Growth of Commodity Futures Market: The volume of trade has increased exponentially since 2004-05 to reach Rs. 40.65 lakh crore in 2007-08. Almost 95% of this is accounted for by the two national exchanges viz., Mumbai (MCX), with around 75 % share and NCDEX, with 20 % share. There are more than 3000 members registered with the exchanges. More than 20,000 terminals spread over more than 800
towns/cities of the country provide access to the trading platforms (EC, 2008). Gold, silver and petroleum
crude recorded the highest turnover in MCX; while in NCDEX, soya oil, guar seed and soyabean was dominant; in NMCE, pepper, rubber and raw jute were the most actively traded commodities. Though in India, agricultural products dominate the commodity sectors, trading in non-agricultural commodities has been dominating particularly, from 2006-07 onwards. The trading volumes of non-agricultural commodities have shot up almost twice that of agricultural commodities during the same period. Overall, the Indian commodity market has shown tremendous growth in terms of both value and the number of commodities traded in the last five years. As the largest commodity futures exchange during 2006-07, both in terms of turnover and number of contracts, the growth of MCX is comparable with some of the international commodity futures exchanges such as Dow Jones AIG Commodity Index (DJAIG) and Reuters/Jefferies Commodity Research Bureau (RJCRB).
COMMODITY FUTURES TRADING
Commodity futures trading in India is not a new concept. India has a very rich tradition in commodity futures. Until late 60’s the country had vibran futures market in castor seed, mustard, linseed, sesame seed, coconut oil, groundnut seed, turmeric, cotton, raw jute, jute goods, wheat, rice, sugar, gold and silver etc. In1939, the Indian government banned futures trading in several commodities because of 2nd World War. After independence, the government enacted Forward Contract(Regulation) Act, 1952, set up Forward Market Commission in 1953 and started futures trading in several commodities.
Agricultural commodities which are actively traded in commodity futures market in India are namely Natural rubber (RSS 4), Black Pepper, Guarseed, Guar gum, Castor seed, Soy oil, Soybean, Cardamom, Raw Jute, Cotton and Rapeseed etc. Other staple agro commodities which have initiated but need to concentrate more are wheat, rice, pulses etc. In comparison with the commodity futures market of more developed countries, Indian commodity futures market, which has set up modern institutions (Demutualised nation wide multi-commodity exchanges) and adopted the best practices of electronic trading and clearing, is in an ascent/developing stage.
Advantages of Commodity Futures as an Investment Vehicle
Potential for large profits in a short period of time.
Much lower relative commissions.
Commodity speculation offers an important advantage over such illiquid vehicles as real estate and
collectibles.
Commodity trading is not complicated, so that we can diversify throughout all important segments
The futures markets help farmers in taking correct decisions in regard to the crops to be sown and sale of the crops. The farmers can also bargain for more remunerative prices for their produce based on their knowledge of futures prices.
It allows farmers, other producers, processors, merchandisers, exporters and others to hedge the
price risks at a small cost.
Futures markets enable a person who desires less risk (the hedger) to shift risk to another person
(the speculator), who is willing to accept the risk in exchange for an expected profit.
Futures markets also enable hedgers with opposite positions in the market to trade with each other.
Speculators with opposing views regarding price movement in the future also trade with each other
in the futures market.
COMMODITY EXCHANGES – A SNAP SHOT
Today, there are more than 50 commodity exchanges worldwide trading in more than 100 products. The major products come under five broad categories: precious metals (gold, silver, platinum, etc); industrial metals (copper, nickel, aluminium, zinc etc); agricultural commodities (wheat, corn, cotton, oilseeds, coffee, cocoa, sugar, etc); livestock (pork bellies, cattle, etc); and energy (crude oil, natural gas, petrol, diesel, etc). Oil makes up the world's largest commodity futures market (daily turnover on the New York Mercantile Exchange (NYMEX) alone totals about $15 billion), followed by coffee, steel, gold and wheat.
Freight futures are also traded on the Norwegian Futures and Options Clearing house and the Nymex while the Chicago Mercantile Exchange offers contracts on temperature, useful for hedging ag-ricultural commodity or energy prices. Futures contracts can be used to bet on spot prices three months to five years, depending on the commodity. Many commodity exchanges have acquired a global reputation for trading in specific commodities, because they may be located in key areas of production or consump-tion of that commodity. Brazil is a large producer and exporter of sugar and coffee, so futures prices on the commodity exchanges there have become key to deciding prices for other producers around the world.
Similarly, Americans are big consumers/producers of wheat, maize and soybeans, so their futures prices on the CBOT set the trend for the rest of the world. CBOT, until recently, dominated the world market in agricultural futures, but since the early part of this decade, has conceded ground to Chinese exchanges, which have emerged as strong rivals in the trading of grains and soybeans. In metals, the London Metal Exchange, the Tokyo Commodity Exchange and the Nymex account for almost all futures trading in metals although the new Shanghai Futures Exchange is fast becoming a force to reckon with (China is one of world's biggest consumers of industrial metals). Similarly, gold and oil have key trading centres in New York, London and Singapore.
With exchanges criss-crossing through different time zones from Canada to Singapore, commodity futures worth billions of dollars change hands round the clock. In recent years, the commodity markets have spawned a multitude of derivative products ranging from futures and options, index-linked instruments to exchange-traded funds, all of which helped make them more accessible to investors already familiar with equity and currency-linked derivatives. During the boom, investors used these instruments freely to punt on rising prices. In 2000, the number of daily oil futures contracts traded on the Nymex averaged 4,70,000 (each contract is for 1,000 barrels of oil). At the peak of the oil mania (2007-08), those daily contracts shot up to a jaw-dropping 15,00,000. Trading is now back to 11,60,000 contracts or so but vividly exemplifies how investors were playing commodities back then. Indeed, despite oil prices falling off a cliff, interest in futures remains high. Futures trading volumes have eased from the frantic pace of the
last year, but combined futures and options open interest the size of the crude oil market - is only own about 3 per cent from a year ago.
COMMODITY INVESTMENT – SO ME EVIDENCES
Commodities are a good complement to traditional stock and bond investments. A much-publicised 2007 study by the US Commodity: futures Trading Commission reported that despite the rapid financial innovations taking place in the commodities markets, there was little statistical evidence to show that the 'negative co-relation' between commodity and equity benchmarks had changed significantly. A negative co-relation means that asset prices move inversely to each other: when one gains, the other loses and vice-versa. The study, which covered 17 years starting from 1991, also found that equity and commodity investment prices did not seem to share a common driving force over long-time period.
Pimco one of the world's leading fixed income managers, points out that
between 1970 and 2005, there were seven years in which the S&P 500 handed in negative returns, while there were eight years in S&P Goldman Sachs Commodity Index produced negative returns. However, only twice over that 35-year period did both indices produce negative returns in the same year. Commodities rank among the few asset classes that actually benefit from inflation. In an inflationary environment, commodities are known to outperform other financial assets which would be under pressure due to higher interest rates. Between 1992 and 2008, the 30-day volatility averaged 13 per cent for the DJAlG commodity index and 20 per cent for the S&P Goldman Sach's commodity index. In the same period, the volatility of the S&P 500 - an equity benchmark - averaged 16 per cent. More significantly, volatility continues to be very high right now.
EXCHANGED – TRADED FUNDS (ETFs)
One good method is to invest in Exchanged-Traded Funds (ETFs). Globally, they're extremely popular: UK investment bank Barclays Capital recently estimated the assets in commodity ETFs to be worth $52 billion, compared with the $56 billion held in indices such as the S&P GSCI. There are three kinds of ETFs available to investors today. A vast majority of them are similar to index mutual funds: they track the performance of a specific market segment by following its index - for example, the S&P GSCI. Each unit of an ETF is called a share. These shares can be bought and sold just like ordinary shares on an exchange.
Other ETFs may hold a commodity as their underlying asset, allowing investors to invest directly in the commodity. For instance, a gold ETF could have physical stockpiles of gold, in proportion to the value of its outstanding shares. However, an ETF share will not trade at the same price as a barrel of oil. But if the price of oil moves up by 10 per cent, theoretically the value of an ETF share should also move up by a similar percentage. Some ETFs also invest in commodity futures. The Power Shares DB Energy Fund (a well-known American ETF for crude), for instance, participates in futures contracts for light sweet crude oil, heating oil, brent crude, gasoline and natural gas. Globally, ETFs exist for all sorts of commodities from oil and gas and grains to livestock and precious metals.
A report by EFT provider state street global advisors counted 22 commodity ETFs on US exchanges out of 701 ETFs of all types in October 2008. Those 22 funds held about $26 billion at month's end, some 5 per cent of all ETF assets. That was down 21 per cent from September 2008, a drubbing that exceeded October's 16.8 percent decline in the S&P 500, which suffered its worst month since October 1987. Recent reports suggest more commodity ETFs have sprung up since then.
in India, ETFS exist only for gold. Five fund houses Benchmark Asset Management, UTI Mutual FUnd, Kotak Mahindra Mutual FUnd, Reliance Capital Asset Management and Quantum Mutual FUnd -launched ETFs in the past two years, which now boast about Rs 750 crore in assets under management. In the past 12 months, all of them gained about 20 per cent, aided by a more than 20 per cent fall in the value of the rupee against the dollar.
OUT LOOK ON TEN KEY COMMODITIES Crude Oil
Crude oil is the most actively traded futures market in the world. The production of crude oil is
concentrated the hands of a few nations. The Middle East is the biggest producer of crude oil, accounting for a third of global output; it is also home to about two-thirds of the world's one trillion barrels of proven reserves. Saudi Arabia alone is said to possess 20 per cent of the world's proven reserves - and is called the central banker of the oil market. Russia, the US, Iran, China and Mexico are other top producers. The US, China, Japan, Russia and India are the biggest consumers. Overall prices are heavily influenced by the actions of 11 key oil producers that make up the Organisation of Petroleum Exporting Countries (Opec), a cartel that meets regularly to decide production quotas keeping in mind estimated future demand. Opec controls 35-40 per cent of global oil production. The world consumes about 80-86 million barrels of oil a day. Asia, the Middle East and South America are expected to account for 90 per cent of future demand growth.
Silver
Silver has been used since ancient times to make currency coins, ornaments, jewellery and
uten-sils. Peru is currently the world's biggest silver-mining nation, followed by Mexico, China, Chile and Australia. Mexico's Fresnillo is the world's largest primary silver producer. Most silver is mined as a by-product of mining copper, gold, lead or zinc. While called a precious metal, silver's biggest demand actually comes from industrial use. About 65 per cent of global demand arises from the electronics and photography industries, while about five per cent comes from investment demand. According to experts, silver occurs 17 times as much as gold in nature. But their prices rarely reflect that fact. Silver prices are, in fact, terribly volatile and often rise or fall more than gold in percentage terms.
In India, silver is the most heavily traded commodity after gold, accounting for nearly 20 per cent of turnover on the MCX, which also happens to be the world's second largest exchange for silver trading. Hindustan Zinc is India's largest silver producer.
Aluminium
Aluminium is the most used metal in the world, with applications in the auto industry (40 per cent), pack aging (28 per cent) and construction. As with many other industrial metals, China is the lynchpin in this market, accounting for a third of global consumption and production. Globally, the aluminium mining industry is highly concentrated with the top five companies - Rio Tinto-Alcan, Alcoa, UC Rusal, Chalco and BHP Billiton accounting for 46 per cent of total annual production. Aluminium futures are traded very actively on the London Metals Exchange and its futures price for three-month delivery is benchmark for aluminium contracts around the world.
In India - the lowest-cost producer in the world - aluminium futures are traded on the MCX, NCDEX and NMCE. Nalco, Hindalco and the Vedanta group account for all the aluminium production capacity in the country. Unlike global demand patterns, however, the key driver for aluminium in India is the power sector.
Copper
Copper is the third-most used metal in the world, after aluminium and steel. Its main use is in electrical wiring but it is also used in the construction, telecom and automobile industries. It can also be used to make many useful alloys. About 15 million tonnes (mt) of copper are produced every year. Chile, Peru, the United States, Canada, Zaire, Zambia and Poland are the largest producer of the red metal. The US used to be the biggest consumer, but China has taken over that spot in the recent past. Other big consumers include Western Europe and Japan. Copper prices on the London Metals Exchange are con-sidered the global benchmarks for pricing and hedging most of the world's copper transactions.
India accounts for about 3 per cent of the copper market, with a 4,00,000 tonnes per annum in-dustry. It used to be a net importer of the industrial metal, but with increasing production from local companies, India has emerged as a net exporter in recent years. The two biggest private-sector producers are Sterlite Industries and Birla Copper, while the main state-run company is Hindustan Copper. Their focus has primarily been on companies in construction, electric power cabling, telecommunications and auto making. Estimates suggest that telecom monoliths BSNL and MTNL consume about 10 per cent of the copper produced in the country. Copper futures are traded on the MCX, NMCE and NCDEX in India.
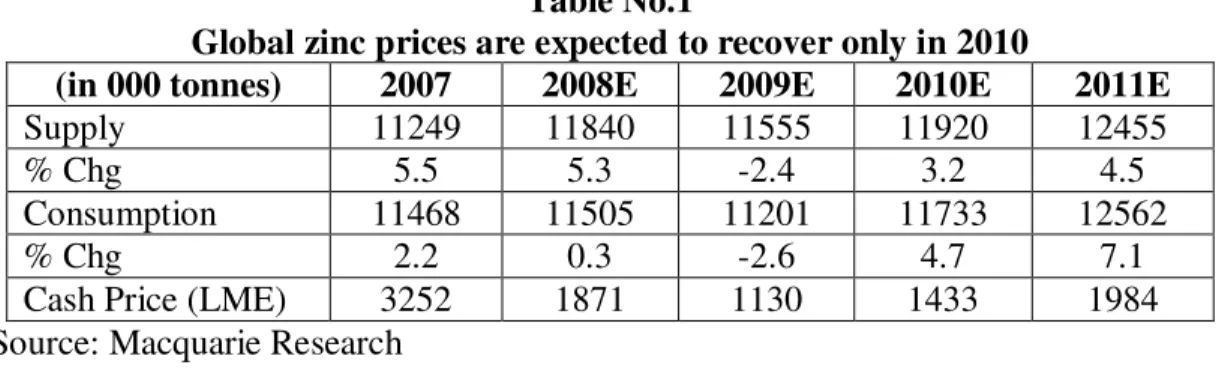
Zinc
Zinc is the fourth-most used metal in the world. It is primarily used to galvanise steel that, coating steel to prevent corrosion. China is the largest producer of the bluish-white metal (32 per cent), followed by Australia, Peru, the US, Canada and Mexico. Global annual production of refined zinc totals about 11 million tonnes (mt). The major exporters of refined zinc are Canada (about 25 per cent), followed by Australia (about 19 per cent), Spain and North Korea. The world's largest zinc producer is Nyrstar, born from the merger of Australia's Oz Minerals and Belgium's Umicore. About 70 per cent of the world's zinc originates from mining, while the rest comes from recycling. Construction and transportation account for 70 per cent of global demand.
Industry experts say global zinc consumption is growing by 2-3 per cent a year, driven by the increased use of galvanized steel in emerging economies. The US used to be the world's top consumer, but has conceded the crown to China, which lays claim to about 32 per cent of output. Zinc prices on the LME set prices for contracts in the metal around the world. Zinc was one of the first industrial metals to peak in 2007; by 2008, prices were already 42 per cent lower from a year ago, averaging $1,889 a tonne on the LME. World refined zinc supply was estimated to have exceeded demand by 195,000 tonnes in 2008, according to the International Lead and Zinc Study Group.
India is a relatively small player in the global zinc industry, but it is also one of its fastest-growing markets. In 2008, India consumed 500,000 tonnes of zinc. Hindustan Zinc is India's largest zinc producer and all the zinc production in the country is in the hands of private-sector players. Zinc futures are traded on the NCDEX and MCX.
Table No.1
Global zinc prices are expected to recover only in 2010
(in 000 tonnes) 2007 2008E 2009E 2010E 2011E
Supply 11249 11840 11555 11920 12455
% Chg 5.5 5.3 -2.4 3.2 4.5
Consumption 11468 11505 11201 11733 12562
% Chg 2.2 0.3 -2.6 4.7 7.1
Cash Price (LME) 3252 1871 1130 1433 1984
Sugar
Sugar is one of the world's most heavily-traded commodities. About 75 per cent of the total sugar produced is consumed in the countries in which it is produced the rest is traded around the globe. Around 150 million tonnes (mt) of sugar is produced every year, with Brazil, India, China and the US leading the list of producers. Brazil is the largest exporter of sugar in the world, selling more than 55 per cent of its produce overseas. Other big exporters include the European Union, Thailand, Australia and China. The largest sugar importer is Russia, followed by Indonesia and the European Union.
India is the second-largest producer of sugar in the world after Brazil, but does not export as much. It produces about 16 mt tonnes of sugar annually, with about half the output coming in from Uttar Pradesh and Maharashtra. Sugar prices are widely tracked on the New York Board of Trade, the Intercontinental Exchange (ICE) and the London International Financial Futures Exchange (Liffe).
Coffee
Coffee is the world's most widely-traded commodity after petroleum. It is also the most heavily traded agricultural commodity in the world. The biggest producers are Brazil, Vietnam, Columbia and Indonesia, while the US and Europe are the top consumers. There are two main varieties of coffee Arabica and Robusta. Because of its high yields and low costs, Robusta is a favourite with large commercial coffee companies, despite being harshly acidic and having a rather woody flavour compared with Arabica. In 2008, Robusta coffee and Brazilian naturals claimed about 63 per cent of the global market, while Arabica took the rest. Coffee is mainly traded on the New York and London futures exchanges. Ninety per cent of the world's coffee trade takes place in green (unroasted) coffee beans.
India accounts for less than 5 per cent of global coffee production and exports more than 80 per cent of its annual output. It has three main coffee-growing regions: the southern states of Karnataka, Kerala and Tamil Nadu; Andhra Pradhesh and Orissa off the Eastern Ghats; and in the east, the seven states of Assam, Manipur, Meghalaya, Mizoram, Tripura, Nagaland and Arunachal Pradesh. Until 1995, coffee was marketed solely by the Coffee Board of India. Only recently were private sector companies given permission to market coffee themselves. Nevertheless, coffee trading does not elicit much enthusiasm among Indian traders partly because the sector is highly export-oriented. NMCE is the primary exchange that offers coffee futures trading. In India, coffee production is estimated to have declined to 250,000 tonnes in the season ending September 2009, down from the earlier forecast of 276,000 tonnes, according to the All India Coffee Exporters' Association.
T op 10 cof f ee Producers 3 3 11 9 8 4 3 3 3 2 2 0 5 10 15 2 0 2 5 3 0 3 5
Exhibit–1 Wheat
Wheat is the most widely grown cereal in the world. The top five biggest cultivators are Europe, China, India, the US and Russia. About 1520 per cent of global output is internationally traded, led by top exporters America, Australia, Canada, Europe and Argentina. India has the largest area in the world under wheat cultivation but is only the third largest cultivator after Europe and China.
Most of the world's wheat is grown as winter wheat in the northern hemisphere, but Canada, Kazakhstan, Russia, and the US have large spring wheat production, which is planted much later. In the southern hemisphere, Australia and Argentina plant after the northern hemisphere's spring wheat. The main global exchanges for wheat trading are the Chicago Board of Trade (CBOT), the Kansas Board of Trade and the Winnipeg Commodity Exchange in Canada. Overall, India produces about 65-75 mt of wheat a year, which also accounts for about 70 per cent of the country's winter crop. The major wheat-producing states are Uttar Pradesh, Punjab, Haryana, Madhya Pradesh, Rajasthan and Bihar.
Soy Beans
Soy beans are Very heavily traded on international exchanges. One of the most Important sources of vegetable oil and protein worldwide, soybean and its by products are the main ingredients in many meat and dairy substitutes. While soybean oil is one of the most widely used ingredients in food processing, soybean meal is a principal ingredient in animal feed. In recent years, global demand for soy products has risen substantially. Chinese demand, in particular, has become a powerful influence in the global market. The biggest producers of soybeans are the US, Brazil, Argentina, China and India. More than 50 per cent of the world's soybeans are grown in Brazil and Argentina, and a large share of their production is bound for Europe and Asia.
The global exchanges known for soybean futures are the Chicago Board of Trade (US), Tokyo Grain Exchange (Japan), Dalian Commodity Exchange (China) and Brazil Mercantile and Futures Exchange. The great majority of the world's soybeans are processed by the soybean crushing industry to produce crude soybean oil and soybean meal in the ratio of 18 per cent and 82 per cent respectively. Prices of soybean are driven primarily by soy meal prices although there is strong demand for both ingredients, which are used separately in various applications. India produces nearly 9 mt of soybeans a year (about 7 per cent of global output) and its leading producers are Madhya Pradesh, Maharashtra and Rajasthan. Madhya Pradesh has nearly five million hectares under cultivation for this crop. Andhra Pradesh is a small but highly efficient producer of soybeans. Overall, India's soybean production yields, are far lower than other countries.
Chick Pea
Chickpea is one of the most important - pulse crops in the world. It makes up about 20 per cent of world pulse production, with only dry beans and peas claiming bigger shares of the market. India is the largest producer and consumer of chickpeas (locally known as Chana) in the world, accounting for 64 per cent of the market; in recent years, it has also become the world's biggest importer. Annual production in India is estimated at around 6.5 million tonnes (mt) and accounts for about 45 per cent of India's total output of pulses. Other major chickpea producing countries include Turkey (8 per cent of output), Pakistan (6 per cent) and Australia (4 per cent).
There are two kinds of chickpeas based on colour and shape: desi, which accounts for 85-90 per cent of global chickpea production, and kabuli, which accounts for 10-15 per cent. Within India, Madhya Pradesh leads the list of chickpea growing states and accounts for 38 per cent of total production. Other big producers are Rajasthan, Uttar Pradesh, Maharastra and Andhra Pradhesh. Andhra Pradesh,
incidentally, also boasts the highest yields in production - more than one tonne per hectare. The top six producing states account for nearly 90 per cent of the crop, whose season runs from November to October.
Sober Look at the Risks
Reward and risk are always related. It is unrealistic to expect to be able to earn above-average investment returns without taking above-average risks as well. Most people are naturally risk averse. They don't like to take big risks, especially financial risks. Commodity trading has the reputation of being a highly risky endeavor. It is true that a high percentage of traders eventually lose money. Many people have lost substantial sums. There is a famous old line about the best way to make a small fortune trading commodities . . . start with a big one. Managing the risks of trading is a very important part of any trader's success. Although the risks can be managed, they can never be eliminated.
In The Elements of Successful Trading, Robert Rotella puts it this way: "Trading is a business of making and losing money. Any trade, no matter how well thought out, has a chance of becoming a loser. Many people think the best traders don't lose any money and have only winning trades. This is absolutely not true. The best traders lose a lot of money, but they eventually make even more over time."
COMMODITY TRADING IN INDIA
The commodity trading in India has become very popular among the traders and retail investors in the recent times. The commodity derivatives constitute an important part of the commodity futures trading in the Indian financial market. The commodity derivatives are preferred for the reason that they provide the investors with a better opportunity of diversifying their portfolios in addition to what the bonds, shares, and real estates offer.
Commodity trading through future contracting has been beneficial for the Indian economy in a number of ways. Commodity trading in futures market comes in handy to minimize the risks arising out of fluctuations in demand and supply conditions. It also helps to preserve the benefits derived from profitable economic activities. The multi-commodity exchanges have been quite helpful for the Indian retailers, because these national level exchanges enable them to carry out commodity trading through futures contract even when they do not have any physical stock of the same.
The Multi Commodity Exchange of India Ltd, the National Multi Commodity Exchange of India Ltd and the National Commodity and Derivative Exchange are the three multi-commodity exchanges that are functional in India. All these three exchanges make use of electronic settlement and trading systems to ensure secured and hassle-free commodity trading.
To participate in the commodity futures trading, the traders and retail investors need to take the help of the registered equity brokers of the respective exchanges. The ISJ Comdesk (ISJ Securities), Refco Sify Securities, Sunidhi Consultancy, and ICICI commtrade (ICICI direct) are some of the well-known brokers that operate in the commodity exchanges of India. Both cash-settled and delivery mechanisms can be used for commodity trading in India.
Indian markets have recently thrown open a new avenue for retail investors and traders to participate: commodity derivatives. For those who want to diversify their portfolios beyond shares, bonds and real estate, commodities is the best option. Trading in commodity derivatives on exchange platforms is an instrument to achieve price discovery, better price risk management, besides helping macro-economy with better resource allocation. Since the inception (2003) of national online trading on multi-commodity
CONCLUSION
India, among the top five producers of most of the agricultural commodities and a leading consumer of bullion and energy products, would immensely benefit from a robust commodity futures market. While the commodity derivatives markets have been in existence in the country for a while now, the gradual withdrawal of prohibition on futures trading since 2003 has paved way for the development of new exchanges and adoption of modern technologies and international practices. The agricultural commodities dominated the futures trading market in the initial years, bullion and metals have overtaken in terms of volumes post 2006-07. Future may bring to focus energy and electricity-sector-oriented products. The efficacy of the futures markets to deliver benefits to the economy can be enhanced through a strong regulatory framework, wide-spread dissemination of futures and spot prices all over the country and education, training and awareness programmes for the various stakeholders, particularly the farmers. Limited direct participation by farmers in the future markets has resulted in the potential benefits being restricted to traders, large corporates and speculators. Attention would need to be given to complex contract designs, lack of access to price information, restricted credit access, etc. that have limited farmers’ participation.
REFERENCES
Baltagi, B.H., Li, D., Li, Q., (2006) “Transaction Tax and Stock Market Behavior: Evidence from an Emerging Market”, Empirical Economics, 31(2), pp.393-408.
Bhattacharya, H. (2007) “Commodity Derivatives market in India”, Economic and Political Weekly, March.
Indian Institute of Management (2008), “Impact of Futures Trading in Wheat, Sugar, Pulses and Guar seed on Farmers”, Bangalore.
Nath, G.C. and T. Lingareddy (2008): “Commodity Derivative Market and its Impact on Spot Market”, Available at SSRN: http://ssrn.com/abstract=1087904.
Nitesh Ranjan (2005) Role of Commodity Exchanges, Futures & Options - A Case Study.
Robin K. Chou and George H. K. Wang (2006). “Transaction Tax and Market Quality of the Taiwan Stock Index Futures” Journal of Futures Markets, 26 (12), 1195-1216.
Sahi, Gurpreet S. (2006): “Influence of Commodity Derivatives on Volatility of underlying" (2006)”. Available at SSRN: http://ssrn.com/abstract=953594.
Sahu, D (2008), “Does Securities Transaction Tax Distort Market Microstructure? Evidence from Indian Stock Market”. papers.ssrn.com/sol3/papers.cfm
Table 2
Commodity Group wise Value of Trade
(Rs. Lakh Crores)
Commodity Groups 2004-05 2005-06 2006-07 2007-08
Bullion and Other Metals 1.80 (31.47) 7.79 (36.15) 21.29 (57.90) 26.24 (64.55) Agriculture 3.90 (68.18) 11.92 (55.31) 13.17 (35.82) 9.41 (23.15) Energy 0.02 (0.35) 1.82 (8.45) 2.31 (6.28) 5.00 (12.30) Others 0.00 (0.00) 0.02 (0.09) 0.001 (0.00) 0.00 (0.00) Total 5.72 (100.00) 21.55 (100.00) 36.77 (100.00) 40.65 (100.00)
Note: Figures in parenthesis indicate percentage to total value. Adopted from EC (2008) report
Table 3
Turnover in Commodity Futures Market
(Rs. Crores) Exchange 2004 2005 2006 2007 Multi Commodity Exchange (MCX) 165147 961633 1621803 2505206 NCDEX 266338 1066686 944066 733479 NMCE (Almadabad) 13988 18385 101731 24072 NBOT (Indore) 58463 53683 57149 74582 Others 67823 54735 14591 37997 All Exchanges 571759 2155122 2739340 3375336 % of GDP 18.3 61.0 90.0 Source: www.finc.gov.in
Table 4
Volume of Trade in Major Commodity Derivative Market
Major Exchanges 2003-04 2004-05 2005-06 2006-07
New York Mercantile
Exchange (NYMEX) 163.15 204.6 (25) 276.2 (35) 353.3 (28)
Dalian Commodity
Exchange 88.3 99.17 (13) 120.7 (19) 185.5 (54)
Chicago Board of Trade
(CBOT) 599 674.6 (12) 805.8 (19) 945.7 (20)
Tokyo Commodity
Exchange (TOCOM) 74.4 61.8 (-17) 63.7 (3) 47.7 (-26)
London Metals Exchange
(LME) 71.9 78.3 (9.3) 86.9 (11) 92.5 (7)
Shanghai Futures
Exchange (SHFE) 40.57 33.7 (-16.7) 58.1 (72) 85.5 (48)
Multi Commodity
Exchange (MCX) 20.4 45.63 (122) 68.9 (51)
National Commodity & Derivatives Exchange (NCDEX)
51.5 53.27 (4) 34.5 (-34)
Chicago Mercantile
Exchange (CME) 805 1090.3 (35) 1409 (29) 2804 (50)
Source: Futures Industry Association, Various years. Notes: Figures in the Brackets are % Change.