Research Article
Research on the Technology of Plugging Gushing Water in the
Vertical Shaft under Complicated Conditions
Chuanyang Jia
,
1,2Hailong Wang,
1,2Haiquan Liu,
3Guibin Zhang,
1,2and Kaihua Sheng
41School of Architecture, Linyi University, Linyi 276000, China
2Linyi City Key Lab of Appraisement and Strengthening in Building Structures, Linyi 276000, China 3Baodian Coal Mine, Yanzhou Coal Mining Company Limited, Yanzhou 273513, China
4State Key Laboratory of Mining Disaster Prevention and Control Co-founded by Shandong Province and the Ministry of Science
and Technology, Qingdao 266590, China
Correspondence should be addressed to Chuanyang Jia; [email protected]
Received 3 November 2020; Revised 24 November 2020; Accepted 5 December 2020; Published 14 December 2020
Academic Editor: Bin Gong
Copyright © 2020 Chuanyang Jia et al. This is an open access article distributed under the Creative Commons Attribution License, which permits unrestricted use, distribution, and reproduction in any medium, provided the original work is properly cited.
The shaft is the throat of the mine construction, and it is easily disturbed by gushing water, which affects the mine construction
progress. Aiming at technical problems under complex hydrogeological conditions in coal mines, such as vertical shaft lining rupture and serious gushing water, single-liquid and double-liquid cement grouting materials are invalid for multiple plugging of gushing water. Combining with geological data to analyze the conditions of the aquifers and water-blocking layer in the shaft,
adopting the multifunctional digital electrical method and digital flow measuring instrument can accurately grasp the flow
direction andflow velocity and further obtain the aquifer parameters of the main and auxiliary shafts. At the same time, based
on the FLAC numerical simulation software, research on the stress, displacement, and plastic failure of the shaft surrounding
rock under different water pressures (0.5 times, 1 time, and 2 times the hydrostatic pressure) and comparative analysis of the
influence of the water bodies on the shaft surrounding rock are carried out. On this basis, the following are the objectives: (1)
research the mechanical properties of polymer chemical material Malisan N and the mechanism of grouting to plugging gushing water and strengthening surrounding rock, (2) formulate the grouting drilling layout and construction technology for the
topsoil and bedrock section of the main and auxiliary shafts, and (3) carry out long-term monitoring of the water inflow. The
monitoring data showed that the measured water inflow was less than 0.05 m3/h after the grouting of the shaft surrounding
rock, which achieved the purpose of preventing the shaft linings from rupturing, plugging the gushing water, and stabilizing the aquifer water pressure.
1. Introduction
Shaft engineering is one of the main projects of mine con-struction; the shaft construction accounts for about 5% of the mine underground engineering quantity and 40%~50% of the mine construction time. The shaft engineering con-struction speed directly affects the construction of roadway engineering, surface engineering, and electromechanical installation engineering [1–5]. Therefore, accelerating the shaft construction speed is an important part of shortening the mine construction time. At the same time, the shaft is the throat of the entire mine construction; its design and con-struction quality are directly related to the success or failure
of the mine construction [6]. The hydrogeological conditions of many mines in our country are complex, with a large num-ber of aquifers and rich water content. Besides, a large amount of water in the shaft during the shaft construction seriously affects the construction speed and quality of the shaft engineering [7–12]. The freezing method is used in the construction of shafts, and the construction of shaft lin-ings mostly adopts reinforced concrete materials to form double-layer or composite sandwich structures. When the construction of the freezing section is completed, the shaft linings are affected by the melting and settlement of the fro-zen surrounding rock, the poor concrete quality, and the con-solidation and settlement of aquifers at the bottom of the
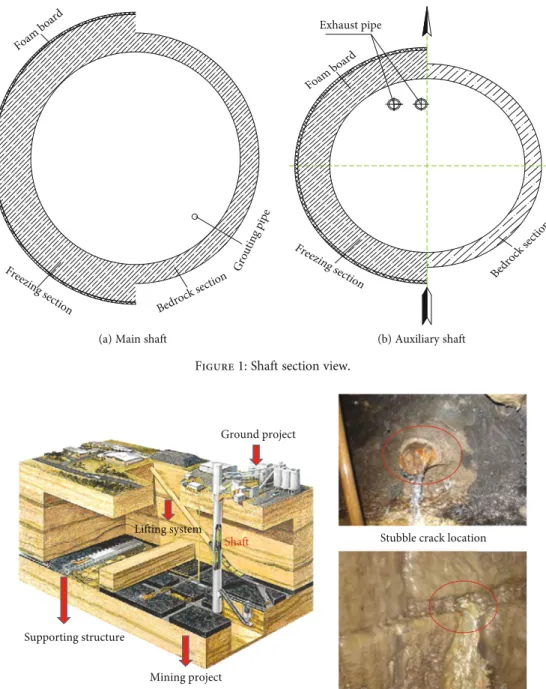
topsoil due to drainage; it is easy to cause shaft lining cracks and water (sand) leakage at the stubble [13–15]. The depths of the main and auxiliary shafts of the coal mine are, respec-tively, 390 m and 398 m, the shaft diameter is 5 m, and the topsoil thickness is 250 m. The topsoil section of the shaft adopts short segment excavation; the excavation section height is 1.00 m; installing the inner layer to form double-layer shaft linings, there are annular gaps in many parts of the shaft linings; the cement slurry isfilled between the shaft linings. The bedrock section of the shaft is constructed by the short section excavation and masonry mixed operation method; the height of the excavation and masonry section is 3.20m. The sections of the main and auxiliary shafts are shown in Figure 1. The hydrogeological conditions of the shaft are complicated, and the common method [16–18]
behind the shaft lining grouting is used to plug the water out-let point at the stubble of the bedrock section, and the water plugging effect is not ideal. After grouting, the measured water inflow of the shaft reaches 6 m3/h, the topsoil section is 4 m3/h, and the bedrock section is 2 m3/h. Especially when the temperature is lower than -10°C, the gushing water from the shaft linings is more obvious; the range of water inflow reaches 8~10 m3/h. The water outlet points of the topsoil sec-tion are concentrated in the annular gap (shaft depth 90~110 m, 180~210 m), and the water outlet points of the bedrock section are concentrated near the stubble (shaft depth 270~300 m, 320~360 m). There are more water outlet points in the topsoil section than in the bedrock section, and the water inflow is relatively large. The shaft gushing water is shown in Figure 2.
Freezing section
Bedrock section
Grouting pipe Foam board
(a) Main shaft
Freezing section
Bedrock section
Foam board Exhaust pipe
(b) Auxiliary shaft
Figure1: Shaft section view.
Stubble crack location
Annular crack position Supporting structure
Ground project
Lifting system
Mining project Shaft
Properly handling the shaft gushing water problem is an important task during the rapid construction and operation of the vertical shaft. It is necessary to carry out the grouting between or behind the composite shaft linings in time to plug the cracks; the inner and outer shaft linings can bear the ground pressure and water pressure together to improve the overall bearing capacity of the shaft linings and further ensure the safety of the shaft and the working environment. According to the water seepage characteristics of the shaft, this paper researches the serious gushing water in the vertical shaft under complex hydrogeological conditions, and the repeated plugging effect is not obvious. A series of processes are taken, such as analyzing the gushing water mechanism [19–22], selecting grouting materials, determining the grout-ing plan, and developgrout-ing plugggrout-ing technology, so as to improve the mine production environment and realize safe production, which is of great significance.
2. Complex Hydrological Analysis
2.1. Geological Structure around the Shaft.The underground data reveals that there are a large number of faults, and 27 faults are exposed. The maximum fault vertical distance is
58 m, and the width is 0.5 m. Most of the faults do not contain water, and only a few faults have water dripping and weak water abundance. However, from the analysis of the distribu-tion of leaky boreholes, there are more leaking points near the fault, indicating that the rocks near the fault are relatively broken and the fractures are developed, resulting in relatively enhanced water richness on both sides of the fault.
The main shaft inspection hole is located in the YF7 fault fracture zone, and the auxiliary shaft inspection hole is located on the upper plate of the YF7 fault. The fault trend is SW and is inclined NW, the dip angle is 70°, and the fault drop near the shaft is 70-80 m.
2.2. Shaft Bedrock Aquifer.In the Quaternary loose soil layer, the clayey soil with poor water conductivity and the sandy soil with good water permeability alternately exist. The hydraulic connection between the Quaternary and the shaft is strong, and the groundwater has a strong replenishment capacity for the shaft. The effluent stratum is the fractured aquifer of the Upper Jurassic Mengyin Formation sandstone, the Permian Shihezi Formation sandstone, and the Shanxi Formation sandstone, with weak water content and difficult drainage.
2.3. Shaft Barrier. The Quaternary is mainly composed of
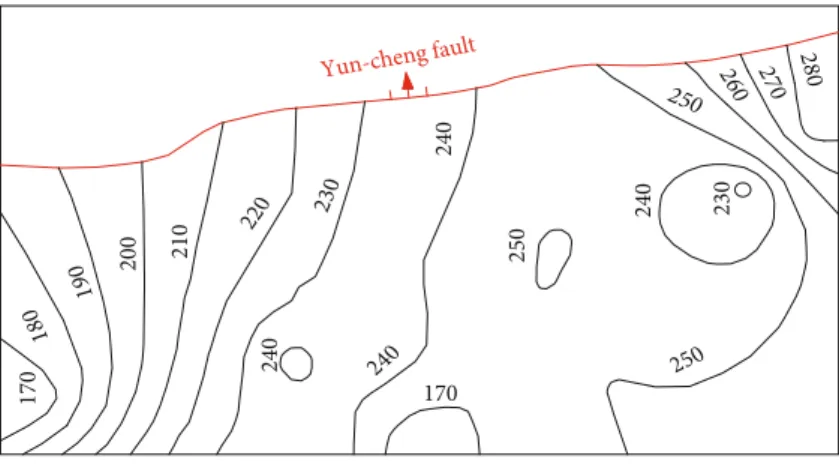
clay, sandy clay, and gravel layers, with a thickness of 251.70~253.27 m. The stratum is thick in the east and south-east and thin in the west and northwest, as shown in Figure 3. The clay has strong swelling properties and forms a relative aquifer. In the other two inspection holes, the Upper Shihezi Formation is dominated by claystone and mudstone, which can be used as a relative aquifer, which is squeezed and dislo-cated, causing cracks to develop and weakening water barrier performance.
2.4. Shaft Water Gush Analysis.The shaft linings in the top-soil section adopt double-layer reinforced concrete, and there are gaps between the inner and outer shaft linings. After the completion of the shaft construction, due to the poor initial
filling effect and the thawing of the frozen shaft linings, groundwater enters the inner and outer shaft lining spaces through the construction joints of the outer shaft linings. The single-layer shaft linings in the bedrock section
170
180 190
200 210
220 230
240
240
170
250
240
250
260 270 280
230
250 240
Yun-cheng fault
Figure3: Quaternary contour map.
W
S
E N
groundwater directly gush into the shaft, but the topsoil sec-tion is affected by water pressure, and groundwater flows through the weak part of the inner shaft linings, resulting in serious gushing water. The main reason is that the blasting excavation of the shaft produces discontinuous plastic dam-age within a certain range of the surrounding rock, and the presence of hydraulic connection channels in the aquifer of the topsoil section results in the occurrence of cross-grouting and new gushing water points during the cross-grouting and plugging process. On the other hand, the melting of the frozen soil around the shaft linings caused part of the forma-tion to liquefy, and the topsoil secforma-tion produces consolida-tion and settlement. The overall downward movement of the formation around the shaft is not synchronized with the vertical displacement of the shaft linings, which results in additional vertical additional stress [23–26] on the surface of the shaft linings. At the same time, when the temperature rises, the concrete of the shaft linings undergoes heat expan-sion and cold contraction, causing the gap to close, and the surrounding rock causes vertical compressive stress on the shaft linings, which causes the shaft linings to continue along
with weak points such as stubble or annular gaps causing damage [27, 28].
3. Monitoring of Water Flow Direction
and Velocity
3.1. Water Flow Direction Monitoring.To improve the effect of grouting and plugging gushing water, it is necessary to obtain data such as water flow direction and velocity. The water flow direction monitoring adopts a multifunctional digital electrical method, and a three-pole detection device is selected. To accurately control the water flow direction, 12 exploration lines are equally divided radially on the plane with the borehole as the center, and the angle between the lines is 30°. The plane layout is shown in Figure 4. Measure and record the electrical resistivity (potential difference) under natural conditions in a clockwise direction (N-E-S-W), and repeat salinization of shaftfluids in the borehole to observe the resistivity and potential changes; according to the changes in resistivity before and after salinization in dif-ferent directions, the direction of resistivity decrease is the water flow direction, and the time consumed of resistivity reduction divided by the distance moved on the plane is the water velocity. The flow direction of the Quaternary water is 150°(ES60°), and theflow velocity is 0.73 m/h. The specific data is shown in Table 1, and the water flow direction is shown in Figure 5.
3.2. Flow Monitoring
3.2.1. Measurement Range and Flow Measurement Method.
The range of the main shaft for flow monitoring is 290.00~380.05 m; the auxiliary shaft is 253.27~283.00 m (wind oxidation zone), 290.00~410.00 m; and the mixed static water level is 15.06 m.
Combined with the observation of pumping beforeflow measurement, the data shows that the pumping volume is small. The spot measurement method is adopted, and the distance between the measurement points is 2 m; when the waterflow changes, the measuring point spacing is encrypted
Table1: Original record form.
Original (salt time 18:00) Salinity (measure time 21:00) Salinity (measure time 1:30)
Number Direction Resistivity (Ω·M) Number Direction Resistivity (Ω·M) Number Direction Resistivity (Ω·M)
1 0°(N) 84.44 1 0°(N) 84.46 1 0°(N) 84.50
2 30° 79.75 2 30° 79.77 2 30° 79.70
3 60° 79.73 3 60° 79.70 3 60° 79.68
4 90°(E) 60.98 4 90°(E) 52.54 4 90°(E) 49.26
5 120° 63.33 5 120° 46.91 5 120° 37.53
6 150° 56.29 6 150° 37.53 6 150° 28.15
7 180°(S) 51.60 7 180°(S) 39.87 7 180°(S) 32.37
8 210° 51.63 8 210° 44.57 8 210° 37.53
9 240° 56.28 9 240° 56.25 9 240° 56.20
10 270°(W) 65.68 10 270°(W) 65.66 10 270°(W) 65.70
11 300° 70.37 11 300° 70.39 11 300° 70.40
12 330° 77.40 12 330° 77.41 12 330° 77.38
W
S
E N
Depth (m)
Histogram (1 : 300)
286.00 290.00
316.20
219 mm
168 mm Casing
326.20 330.10
335.50
342.40 346.10 349.85 352.50 354.75 357.45 360.45 363.20 366.80 368.60
373.10
380.05
Mudstone Siltstone Fine-grained sandstone
Sandy mudstone Conglomerate Magmatic rock
(a) Histogram
Q (L/s) 0
290
300
310
320
330
340
350
360
370
380
390
0.01 0.005
Depth (m)
Natural flow curve
Mixed static water level depth 14.10m
(b) Naturalflow
290
300
310
320
330
340
350
360
370
380
390
Q (L/s) 0.006 0.004 0.002 00.002 0.004 0.006Q (L/s)
Flow direction
Water level rise 14.63mm
Monitoring water flow curve (Injection)
Depth (m)
(c) Water injection
to 0.5 m, which is convenient for accurately dividing the depth and thickness of the aquifer.
3.2.2. Test Analysis.According to thefield measurement data, the natural and water injectionflow curve of the main shaft in the natural state is drawn, as shown in Figure 6.
Comprehensive analysis of the natural and water injection
flow measurement curve data in Figure 6 shows the following: (1) Monitoring the shaft section under static conditions, no waterflow greater than the start-up sensitivity of the instrument was found, and theflow rate was zero, indicating that the static water level of the aquifer is not much different, or there is only one aquifer (2) Under mixed water injection conditions, when the
mixed water injection level is stable at +0.53 m (uplifted by 14.63 m), the wellhead water injection volume is 0.005347 L/s. The conversion data shows
that there are two confined aquifers, and because the static water level is lower than the water injection head, it appears as water absorption
(3) The depths of the two aquifers are 332.90~337.65 m and 349.40~351.20m, and the thickness is 4.75 m and 1.80 m, respectively
For the main shaft inspection hole, combined with the Dupuit formula (1), according to the analysis of flow mea-surement curves during static and water injection, the parameters of the two aquifers are shown in Table 2.
K= 31:6224Q lgRMS−lnr,
R= 10:2SpffiffiffiffiK,
ð1Þ
Table2: Main shaft aquifer parameters.
Level Top depth (m) Bottom depth (m) Thickness (m) Mixed dynamic water level conditions coefficientPermeabilityK
(m/d)
Influence
radiusR(m)
Layerflow (L/s) Cumulativeflow (L/s)
1 332.90 337.65 4.75 -0.001788 -0.005123 0.00167 6.10
2 349.40 351.20 1.80 -0.003335 -0.003335 0.009756 14.74
Q (L/s) 0.000
240
Monitoring water flow (Hydrostatic)
0.0510 0.1020
Rock
formation
Depth
250
260
270
280 252.95
272.05
Gravel aquifer
h(m) 1:200
Monitoring water flow (Injection)
Water-blocking layer Water-blocking layer
Figure7: Flow monitoring diagram in the wind oxidation section of the auxiliary shaft.
Table3: Water inflow of each measuring point. Depth (m) inNatural waterflowQ(L/s) S= 49inflow:31 mQ(L/s)water
250.00 0 0.1019
252.00 0 0.1019
252.50 0 0.1019
253.00 0 0.1019
254.00 0 0.0966
256.00 0 0.0859
258.00 0 0.0752
260.00 0 0.0646
262.00 0 0.0539
264.00 0 0.0432
266.00 0 0.0325
268.00 0 0.0218
270.00 0 0.0112
270.50 0 0.0085
271.00 0 0.0058
271.50 0 0.0019
272.00 0 0.0008
272.50 0 0
273.00 0 0
274.00 0 0
276.00 0 0
278.00 0 0
280.00 0 0
282.00 0 0
whereK is the permeability coefficient, m/d;Qis the flow, L/s;Ris the influence radius, m;r is the shaft radius, m;M is the aquifer thickness, m; andSis the drawdown, m.
The comprehensive measuring analysis curve in the wind oxidation zone of the auxiliary shaft is shown in Figure 7, and the water inflow of the measurement point is shown in
Table 3. It can be seen from Figure 7 and Table 3 that in the natural state, theflow rate is zero and there is no abnormal phenomenon. At the same time, observe the water level stabil-ity andflow changes during the pumping process. WhenSis 49.31 m, the water inflow from the wellhead is 0.102 (L/s). The aquifer in the wind oxidation zone (sand gravel) appears
Depth (m)
Histogram (1 : 400)
287.50 290.00 305.30
329.80
334.50 339.20 339.90 341.20
346.90 356.50
362.80
379.50 382.70 384.10 385.90 393.10 395.40 397.00 400.30 402.60
409.00
108 mm
168 mm
Medium grain sandstone Siltstone Fine-grained sandstone
Sandy mudstone Coal
(a) Histogram
Q (L/s) 0 0.005 0.01 Natural flow curve
290 300 310 320 330 340 350 360 370 380 390 400 410
Mixed static water level depth 13.98m
Depth (m)
(b) Naturalflow
Q (L/s)0.03 0.02 0.01 0 0.01 0.02 0.03Q (L/s) Monitoring water flow curve (Pumping)
290 300 310 320 330 340 350 360 370 380 390 400 410
Water level drops 36.8mm
Flow direction
Depth (m)
(c) Water pumping
to be producing water, with a horizon range of 252.95 m-272.05 m, and the water inflow is 0.1019 (L/s). The natural and pumpingflow measurement data show that the horizon is in a static water state below 272.05 m, indicating that this zone is a water barrier.
The natural and pumpingflow curve in the natural state of the bedrock section is shown in Figure 8. Theflow moni-toring data shows the following:
(1) Under static conditions, no water inflow greater than the start-up sensitivity of the instrument was found in the measurement section, and the flow rate was zero, indicating that the static water level of the aqui-fer is not much different, or there is only one aquifer (2) Under mixed pumping conditions, when the water level is stable at 50.81 m, the water inflow from the shaft head is 0.01678 L/s
(3) It is measured by conversion data that there are two aquifers (confined aquifers) in the whole hole, which are expressed as gushing water. The depths of the two aquifers are 334.70~340.40 m and 357.10~360.90 m, and the thickness is 5.70 m and 3.80 m, respectively. The parameters of the two aquifers in the auxiliary inspection hole are calculated by the Dupuit formula as shown in Table 4
4. Numerical Simulation of the Groundwater
Seepage Field
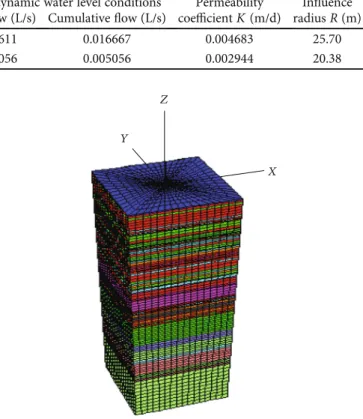
4.1. Numerical Model Establishment.Combining the
geolog-ical conditions and the structure of the shaft, theXand Y directions of the calculation model are 150 m, and the Z direction is 500 m. The model is divided into 115080 units and 116443 nodes. Horizontal constraints are imposed on the side boundary of the model; horizontal and vertical con-straints are imposed on the bottom boundary. To compre-hensively analyze the stress field, deformation, and failure characteristics of the shaft surrounding rock, a combination model of different rock formations and water pressures is established. The top surface of the water-bearing rock mass is based on the water level line as the upper boundary, and the water outlet point is near the stubble of the shaft. Thefi s-sures in the rock are the main runoffchannels for groundwa-ter and are important parts of grouting and plugging. At the same time, to facilitate the calculation, thefloor elevation of the water-bearing rock mass is set to a fixed value, and a three-dimensional numerical calculation model is adopted. The grid diagram is shown in Figure 9.
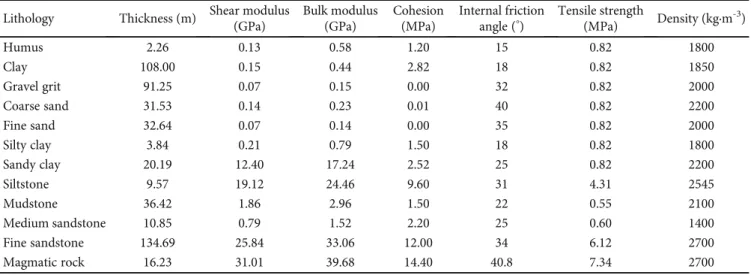
According to thefield geological drilling data and rock mechanics test results, the Mohr-Coulomb yield criterion
and the solid-liquid coupling calculation model are used. The lithological physical and mechanical parameters of the rock layer are shown in Table 5.
4.2. Simulation Calculation Scheme. This simulation
con-siders the effect of the water bodies and adopts the solid-liquid coupling calculation mode. After the static calculation is stable, the coupling calculation is performed to consider the influence of the confined water. The simulation advances 5 m as a calculation time step to realize segmented construc-tion, and the water pressure is set to 0.5 times, 1 time, and 2 times of the original hydrostatic pressure.
4.3. Simulation Result Analysis
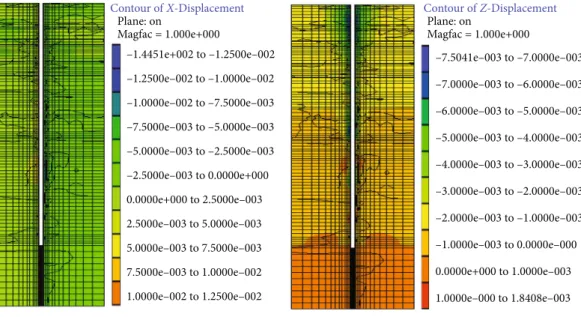
4.3.1. Regardless of Solid-Liquid Coupling. Figures 10–12 show the stress, displacement, and deformation of the shaft surrounding rock without considering the action of water bodies. Figure 10 reveals that there is a nonlinear relationship between stress change and depth, showing a wavelike state. The maximum tensile stress is 1.85 MPa, and the maximum compressive stress is 3.67 MPa. Figure 11 shows that the hor-izontal displacement is symmetrical along the shaft section. The direction of the displacement vector points to the inner shaft lining. There is a nonlinear relationship between the change in horizontal displacement and the shaft depth, and the maximum horizontal displacement is 14 mm. The verti-cal displacement shows a decreasing trend with the increase of the shaft depth. The maximum vertical displacement
X Z
Y
Figure9: Three-dimensional numerical calculation model. Table4: Auxiliary shaft aquifer parameters.
Level Top depth (m) Bottom depth (m) Thickness (m) Mixed dynamic water level conditions coefficientPermeabilityK
(m/d)
Influence
radiusR(m)
Layerflow (L/s) Cumulativeflow (L/s)
1 334.70 340.40 5.70 0.011611 0.016667 0.004683 25.70
mostly occurs in the shallow part of the shaft, and the maxi-mum sinking value is 7.5 mm.
Figure 12 shows the deformation and failure of the shaft surrounding rock without considering the action of the water bodies. The surrounding rock deformation is due to the stress release caused by the shaft construction, resulting in secondary stress distribution. Plastic failure occurs in some sections, and the damage points are concentrated in the upper part of the shaft, which is consistent with the cur-rent water outlet point.
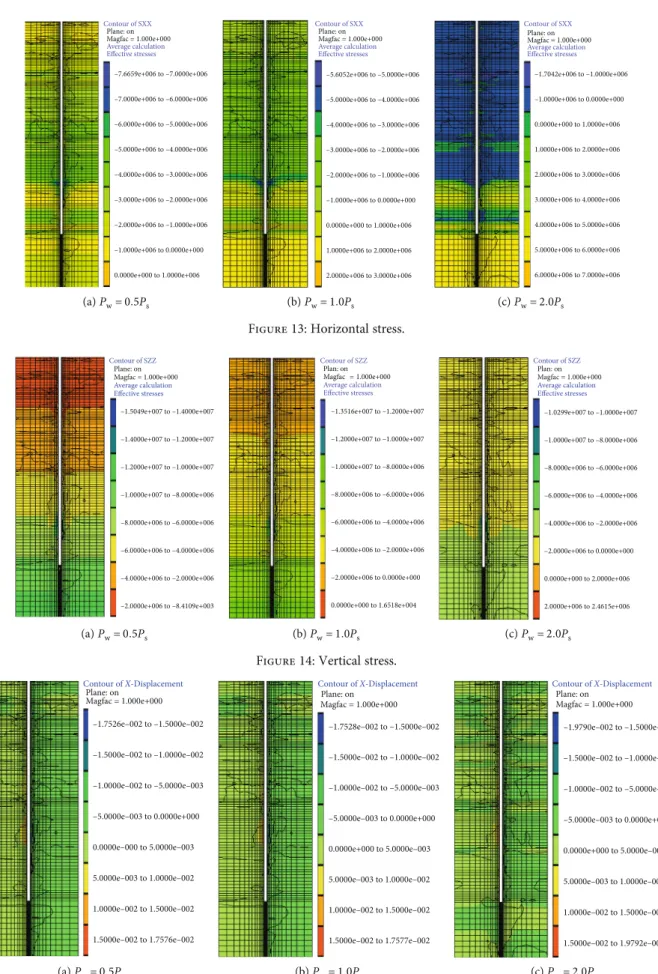
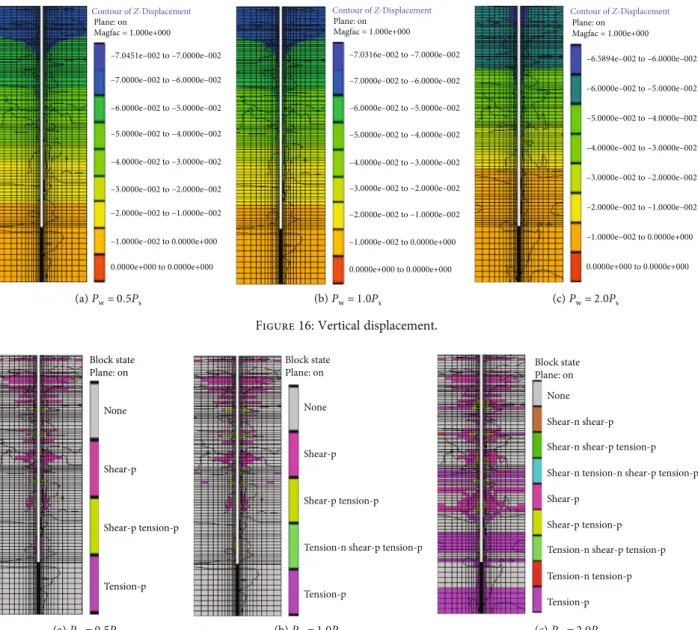
4.3.2. Simulation Analysis considering Coupling.Figures 13– 17, respectively, describe the stress, displacement, and plastic failure changes in the shaft surrounding rock, considering the action of the water bodies, and the water pressure is 0.5, 1, and 2 times the original hydrostatic pressure.
Figures 13 and 14 show that there is a nonlinear rela-tionship between the surrounding rock stress and shaft depth. At the same time, the stress changes in local sections are relatively large, which shows that there is a great rela-tionship with the lithology of the shaft surrounding rock. The horizontal stress simultaneously appears with tensile stress and compressive stress in different areas of the shaft, the maximum tensile stress is 1.54 MPa, and the maximum compressive stress is 4.28 MPa. In general, the stress of the surrounding rock increases with the water pressure increase, and the horizontal stress increases by 3.89 times.
Figures 15 and 16 show that there is a nonlinear rela-tionship between the displacement of the surrounding rock and the shaft depth. With the increase of water pressure, the horizontal displacement of the shaft surrounding rock increases, while the vertical displacement decreases When
Table5: Lithological physical and mechanical parameters.
Lithology Thickness (m) Shear modulus
(GPa)
Bulk modulus (GPa)
Cohesion (MPa)
Internal friction angle (°)
Tensile strength
(MPa) Density (kg·m
-3)
Humus 2.26 0.13 0.58 1.20 15 0.82 1800
Clay 108.00 0.15 0.44 2.82 18 0.82 1850
Gravel grit 91.25 0.07 0.15 0.00 32 0.82 2000
Coarse sand 31.53 0.14 0.23 0.01 40 0.82 2200
Fine sand 32.64 0.07 0.14 0.00 35 0.82 2000
Silty clay 3.84 0.21 0.79 1.50 18 0.82 1800
Sandy clay 20.19 12.40 17.24 2.52 25 0.82 2200
Siltstone 9.57 19.12 24.46 9.60 31 4.31 2545
Mudstone 36.42 1.86 2.96 1.50 22 0.55 2100
Medium sandstone 10.85 0.79 1.52 2.20 25 0.60 1400
Fine sandstone 134.69 25.84 33.06 12.00 34 6.12 2700
Magmatic rock 16.23 31.01 39.68 14.40 40.8 7.34 2700
Contour of SXX Average calculation Plane: on
Magfac = 1.000e+000
–9.0724e+006 to –9.0000e+006 –9.0000e+006 to –8.0000e+006 –8.0000e+006 to –7.0000e+006 –7.0000e+006 to –6.0000e+006 –6.0000e+006 to –5.0000e+006 –5.0000e+006 to –4.0000e+006 –4.0000e+006 to –3.0000e+006 –3.0000e+006 to –2.0000e+006 –2.0000e+006 to –1.0000e+006 –1.0000e+006 to 0.0000e+000
(a) Horizontal stress
Contour of SZZ Average calculation
Plane: on
Magfac = 1.000e+000 –1.4993e+007 to –1.4000e+007 –1.4000e+007 to –1.2000e+007 –1.2000e+007 to –1.0000e+007 –1.0000e+007 to –8.0000e+006 –8.0000e+006 to –6.0000e+006 –6.0000e+006 to –4.0000e+006 –4.0000e+006 to –2.0000e+006 –2.0000e+006 to 0.0000e+000 0.0000e+000 to 2.1504e+005
(b) Vertical stress
the water pressure is 0.5, 1, and 2 times of the hydrostatic pres-sure, the maximum horizontal displacement is 17.526 mm, 17.528 mm, and 19.79 mm, and the maximum vertical displacement is 70.451 mm, 70.316 mm, and 65.894 mm, respectively.
Figure 17 shows that with the increase of water pressure, the plastic damage range, and the damage degree of the shaft surrounding rock increases, the damage position roughly corresponds to the current water outlet point position.
5. Grouting Construction Plan and
Technological Design
5.1. Grouting Material Selection.Malisan N is a low-viscosity, two-component synthetic polymer-polyimide resin material. Malisan N and its catalyst are configured to form liquid slurry in a ratio of 1 : 1. The topsoil section adopts interwall grouting, and the bedrock section adopts high-pressure
pouring slurry to replace fracture water, plug sandstone water, fill pores, and squeeze and reinforce the shaft sur-rounding rock to achieve the purpose of preventing leakage. Use different testing instruments to conduct experimental research on Malisan N and grouting samples. The specific grouting material parameters are shown in Tables 6–10.
The above data shows that the grouting material has good
fluidity, permeability, cohesion, and swelling properties and has high strength. The grouting material has fast gelation velocity; the slurry quickly penetrates the tiny pores and expands by 20 times when exposed to water. Finally, the con-solidation of the slurry can form a whole with the surround-ing rock to meet the needs of the construction requirements.
5.2. Grouting Drilling Layout. The drilling is arranged at
the water outlet point or within 0.5 m of the water outlet point, using grouting behind the shaft linings; the hole depth is 1.0~1.5 m; and the elevation angle is 10~20°. The sealing device is installed after the hole is formed by the pneumatic drill. The sealing device is made of steel pipe and expanded rubber, with a length of 280 mm and a diame-ter ofΦ= 38 mm. The rubber swells up during grouting, and the hole is sealed under pressure.
Each section is designed with four holes, the grouting drilling diameter is 42 mm, the drilling spacing is 2.3 m, the grout diffusion radius is 4.2 m, and the height of the grouting section is 3 m. The grouting section is mainly concentrated in the shaft depth of 90~110 m, 180~210 m, 270~300 m, and 320~360 m. This grouting has plugged twelve water outlet points, seven topsoil sections, and five bedrock sections. A total of 48 holes are designed. The specific layout of the grouting drilling is shown in Figure 18.
5.3. Grouting and Water-Blocking Construction Technology
5.3.1. Grouting Equipment.The grouting equipment includes
the grouting pumps, drilling machinery, mixers, packer, and
Contour of X-Displacement
–1.4451e+002 to –1.2500e–002 –1.2500e–002 to –1.0000e–002 –1.0000e–002 to –7.5000e–003 –7.5000e–003 to –5.0000e–003 –5.0000e–003 to –2.5000e–003 –2.5000e–003 to 0.0000e+000 0.0000e+000 to 2.5000e–003 2.5000e–003 to 5.0000e–003 5.0000e–003 to 7.5000e–003 7.5000e–003 to 1.0000e–002 1.0000e–002 to 1.2500e–002 Plane: on
Magfac = 1.000e+000
(a) Horizontal displacement
Contour of Z-Displacement
–7.5041e–003 to –7.0000e–003 –7.0000e–003 to –6.0000e–003 –6.0000e–003 to –5.0000e–003 –5.0000e–003 to –4.0000e–003 –4.0000e–003 to –3.0000e–003 –3.0000e–003 to –2.0000e–003 –2.0000e–003 to –1.0000e–003 –1.0000e–003 to 0.0000e–000 0.0000e+000 to 1.0000e–003 1.0000e–000 to 1.8408e–003 Plane: on
Magfac = 1.000e+000
(b) Vertical displacement
Figure11: Shaft surrounding rock displacement.
Block state Plane: on None Shear-n shear-p Shear-n shear-p tension-p
Shear-p tension-p Tension-n shear-p tension-p Tension-p
Shear-n tension-n shear-p tension-p Shear-p
Contour of SXX
Average calculation Effective stresses Plane: on Magfac = 1.000e+000
–7.6659e+006 to –7.0000e+006
–7.0000e+006 to –6.0000e+006
–6.0000e+006 to –5.0000e+006
–5.0000e+006 to –4.0000e+006
–4.0000e+006 to –3.0000e+006
–3.0000e+006 to –2.0000e+006
–2.0000e+006 to –1.0000e+006
–1.0000e+006 to 0.0000e+000
0.0000e+000 to 1.0000e+006
(a)Pw= 0:5Ps
Contour of SXX
Average calculation Effective stresses Plane: on Magfac = 1.000e+000
–5.6052e+006 to –5.0000e+006
–5.0000e+006 to –4.0000e+006
–4.0000e+006 to –3.0000e+006
–3.0000e+006 to –2.0000e+006
–2.0000e+006 to –1.0000e+006
–1.0000e+006 to 0.0000e+000
0.0000e+000 to 1.0000e+006
1.0000e+006 to 2.0000e+006
2.0000e+006 to 3.0000e+006
(b)Pw= 1:0Ps
Contour of SXX
Average calculation Effective stresses Plane: on Magfac = 1.000e+000
–1.7042e+006 to –1.0000e+006
–1.0000e+006 to 0.0000e+000
0.0000e+000 to 1.0000e+006
1.0000e+006 to 2.0000e+006
2.0000e+006 to 3.0000e+006
3.0000e+006 to 4.0000e+006
4.0000e+006 to 5.0000e+006
5.0000e+006 to 6.0000e+006
6.0000e+006 to 7.0000e+006
(c)Pw= 2:0Ps
Figure13: Horizontal stress.
Contour of X-Displacement Plane: on
Magfac = 1.000e+000
–1.7526e–002 to –1.5000e–002
–1.5000e–002 to –1.0000e–002
–1.0000e–002 to –5.0000e–003
–5.0000e–003 to 0.0000e+000 0.0000e–000 to 5.0000e–003 5.0000e–003 to 1.0000e–002 1.0000e–002 to 1.5000e–002 1.5000e–002 to 1.7576e–002
(a)Pw= 0:5Ps
Contour of X-Displacement Plane: on
Magfac = 1.000e+000
–1.7528e–002 to –1.5000e–002
–1.5000e–002 to –1.0000e–002
–1.0000e–002 to –5.0000e–003
–5.0000e–003 to 0.0000e+000
0.0000e+000 to 5.0000e–003
5.0000e–003 to 1.0000e–002
1.0000e–002 to 1.5000e–002
1.5000e–002 to 1.7577e–002
(b)Pw= 1:0Ps
Contour of X-Displacement Plane: on
Magfac = 1.000e+000 –1.9790e–002 to –1.5000e–002
–1.5000e–002 to –1.0000e–002 –1.0000e–002 to –5.0000e–003
–5.0000e–003 to 0.0000e+000
0.0000e+000 to 5.0000e–003
5.0000e–003 to 1.0000e–002
1.0000e–002 to 1.5000e–002
1.5000e–002 to 1.9792e–002
(c)Pw= 2:0Ps
Figure15: Horizontal displacement.
Contour of SZZ
Average calculation Effective stresses
Plane: on Magfac = 1.000e+000
–1.5049e+007 to –1.4000e+007 –1.4000e+007 to –1.2000e+007 –1.2000e+007 to –1.0000e+007 –1.0000e+007 to –8.0000e+006 –8.0000e+006 to –6.0000e+006 –6.0000e+006 to –4.0000e+006 –4.0000e+006 to –2.0000e+006 –2.0000e+006 to –8.4109e+003
(a)Pw= 0:5Ps
Contour of SZZ
Average calculation Effective stresses
Plan: on Magfac = 1.000e+000
–1.3516e+007 to –1.2000e+007
–1.2000e+007 to –1.0000e+007
–1.0000e+007 to –8.0000e+006
–8.0000e+006 to –6.0000e+006
–6.0000e+006 to –4.0000e+006
–4.0000e+006 to –2.0000e+006
–2.0000e+006 to 0.0000e+000
0.0000e+000 to 1.6518e+004
(b)Pw= 1:0Ps
Contour of SZZ
Average calculation Effective stresses Plan: on Magfac = 1.000e+000
–1.0299e+007 to –1.0000e+007 –1.0000e+007 to –8.0000e+006 –8.0000e+006 to –6.0000e+006 –6.0000e+006 to –4.0000e+006 –4.0000e+006 to –2.0000e+006 –2.0000e+006 to 0.0000e+000 0.0000e+000 to 2.0000e+006 2.0000e+006 to 2.4615e+006
(c)Pw= 2:0Ps
necessary instruments. The grouting pump adopts a special small air pump with a size of 1:16 m × 0:41 m × 0:41 m (Figure 19). The wind source is used as the grouting power, the wind pressure is 0.4~0.8 MPa, the pump capacity is 5.2 L/min, the slurry obtains 12.5 times the wind pressure during the grouting process, and the pumping distance of the air pump can reach at least 40 m.
Malisan N accessories mainly include two high-pressure pipes, an injection gun, a standard injection tube, and a
self-locking oil seal. The injection gun adopts a two-liquid injec-tion mixing gun composed of a static mixer, homomixer, one-way valve, ball valve, etc., and a loop self-punching sealing device is used for grouting and sealing the hole.
5.3.2. Grouting Construction Technology. For grouting
con-struction, use cages to build a workbench, and prepare
Contour of Z-Displacement
Plane: on Magfac = 1.000e+000
–7.0451e–002 to –7.0000e–002 –7.0000e–002 to –6.0000e–002 –6.0000e–002 to –5.0000e–002 –5.0000e–002 to –4.0000e–002 –4.0000e–002 to –3.0000e–002 –3.0000e–002 to –2.0000e–002 –2.0000e–002 to –1.0000e–002 –1.0000e–002 to 0.0000e+000 0.0000e+000 to 0.0000e+000
Con
Plan Ma
(a)Pw= 0:5Ps
Plane: on
Contour of Z-Displacement
Magfac = 1.000e+000 –7.0316e–002 to –7.0000e–002 –7.0000e–002 to –6.0000e–002 –6.0000e–002 to –5.0000e–002 –5.0000e–002 to –4.0000e–002 –4.0000e–002 to –3.0000e–002 –3.0000e–002 to –2.0000e–002 –2.0000e–002 to –1.0000e–002 –1.0000e–002 to 0.0000e+000 0.0000e+000 to 0.0000e+000
(b)Pw= 1:0Ps
Plane: on
Contour of Z-Displacement
Magfac = 1.000e+000
–6.0000e–002 to –5.0000e–002 –6.5894e–002 to –6.0000e–002
–5.0000e–002 to –4.0000e–002 –4.0000e–002 to –3.0000e–002 –3.0000e–002 to –2.0000e–002 –2.0000e–002 to –1.0000e–002 –1.0000e–002 to 0.0000e+000 0.0000e+000 to 0.0000e+000
(c)Pw= 2:0Ps
Figure16: Vertical displacement.
Plane: on
None
Shear-p tension-p
Tension-p
Block state
Shear-p
(a)Pw= 0:5Ps
None
Shear-p tension-p
Tension-n shear-p tension-p
Tension-p Shear-p Plane: on Block state
(b)Pw= 1:0Ps
None
Shear-p tension-p
Shear-n tension-n shear-p tension-p Shear-n shear-p
Shear-n shear-p tension-p
Tension-n shear-p tension-p Tension-n tension-p Tension-p Shear-p Plane: on Block state
(c)Pw= 2:0Ps
Figure17: Plastic damage. Table6: Malisan N basic data.
Basic ingredients Resin Catalyst
Density at 25°C (g/cm3) 1.04 1.23
Viscosity at 25°C (MPa·s) 200 210
Mixing ratio (volume ratio) 1 1
Shelf life at 20°C (month) 6 6
Storage temperature (°C) 5~300 5~300
Table7: Malisan N performance data. Aggregate products
Application temperature (°C) 15° 25°
Initial viscosity (MPa·s) 450 250
Start to react (minute) 1 : 15 0 : 45
End of foaming (minute) 2 : 10 1 : 25
Expansion ratio 2 2
Pressure (MPa) >15 >15
construction equipment and materials on the workbench. The “8 h/d” operation system is adopted, with a total of six operators: three persons are responsible for grouting technology and equipment operation, and three persons are responsible for shaft lining drilling construction, water source tracking, material preparation, and other grouting auxiliary operations. The shaft grouting construction sequence adopts downward grouting, plugging the upper water outlet point first then the lower water outlet point, and finally plugging the middle. The shaft lining thickness of the water outlet section is 450 mm; the drilling depth should be greater than 450 mm to ensure that the borehole penetrates the shaft linings. The depth of the self-locking oil seal that extends into the hole is 200 mm, and use quick-setting cement to block grouting holes and nonoutlet holes after grouting.
Preliminary preparation for grouting is completed, con-nect the air passage and grouting pipeline, start the grouting pump, suck in Malisan N and its catalyst according to the mixing ratio of 1 : 1 (volume ratio), and press them into the
equalizing mixer at the front of the injection gun. The grout-ing pressure should be 0.5~1.0 MPa higher than the hydro-static pressure at the water outlet point. After uniform mixing and standard injection, the high-pressure mixed liq-uid is instantly pressurized in the self-locking oil seal, and part of the liquid enters the gap between the steel pipe and the expanded rubber, causing the rubber to swell up and stick to the hole wall. The mixed liquid rapidly foams and expands in the cavity to complete the self-locking oil seal. After the mixed slurry enters the gushing cavity and cracks behind shaft linings, a series of plugging processes (spreads, fills, foams, and solidifies) are completed. The specific process
flow is shown in Figure 20.
Table8: Uniaxial compressive strength test.
No. Specimen size (mm) Plastic deformation starting load value (kN) Maximum breaking load (kN) Compressive strength (MPa)
Length Width Height
1 50 50 100 160.1 166.7 66.7
2 50 50 100 150.9 158.6 63.4
3 50 50 100 151.9 168.4 67.4
Table9: Shear strength test.
No. Specimen size (mm) Shear angle (°) Failure load (kN) Maximum normal
stress (MPa)
Maximum shear stress (MPa)
Internal friction
angle (°) Cohesion (MPa)
Length Width Height
1 70 70 70 55 188.6 22.1 31.5 45 10.2
2 70 70 70 60 167.9 17.1 29.7 45 10.2
3 70 70 70 65 108.4 9.35 20.1 45 10.2
Table10: Uniaxial tensile strength test.
No. DiameterSpecimen size (mm)Length Failure load (kN) Average tensile strength (MPa) Deformation (mm) Extension rate (%)
1 22 180 17.0 44.7 8.61 4.78
2 22 180 13.2 34.7 5.67 3.15
3 22 190 15.6 41.0 6.72 3.54
>4.5m
>4.5m
5.0 m
10~20° 2
4 3 1
r=2.5 m
Figure18: Schematic diagram of the grouting drilling layout.
Double liquid injection gun
Circumferential self-piercing sealer Grouting pump
6. Engineering Application Effect Analysis
6.1. Groundwater Level Change.According to the monitoring
data, the water level in the observation hole changes with sea-sonalfluctuations, the rainy season rises and the dry season decreases. With the implementation of the shaft grouting, the water level in the observation hole gradually increases. The measured water level line shows that the shaft grouting effect is obvious.
6.2. Slurry Diffusion Radius. According to the measured
data, obtain the cross-grout distance of the slurry diffusion radius.
(1) The slurry diffusion radius in conglomerate and glu-tenite ranges is 7.0~77.0 m, and the effective diffusion radius is greater than 7.0~8.5 m. The data shows that conglomerate and glutenite have strong internal con-nectivity; the range of slurry diffusion and slurry con-sumption is large
(2) The slurry diffusion radius in the weathered sand-stone layer, pseudointegrated sandsand-stone layer, and sandstone layer ranges is 2.4~80.0 m, and the eff ec-tive diffusion radius is greater than 6.0~7.5 m. The average number of vertical observations of the above-mentioned rock formations is gradually reduced, from 22 to 8, and the degree of fracture development and connectivity decreased with the depth increase Combined with the above data, to shorten the construc-tion period and ensure the quality of grouting, a single row of grouting holes is used, and the slurry diffusion radius is controlled at 4.2 m.
6.3. Numerical Simulation Analysis of the Grouting Effect.
Figure 21 depicts that after the shaft grouting is completed, considering the action of the water bodies, the water pressure adopts the actual hydrostatic pressure, and the solid-liquid coupling mode is used to obtain the stress and displacement changes of the shaft surrounding rock.
Grouting pump
In
jec
tio
n gun f
ro
n
t mix
er
Self-sealing
Water yield crack location Self-sealing
Activator Malisan N
Figure20: Grouting processflow chart. Contour of SXX
Average calculation Effective stresses
Plane: on
–5.5023e+006 to –5.0000e+006 –5.0000e+006 to –4.0000e+006 –4.0000e+006 to –3.0000e+006 –3.0000e+006 to –2.0000e+006 –2.0000e+006 to –1.0000e+006 –1.0000e+006 to 0.0000e+000 0.0000e+000 to 1.0000e+006 1.0000e+006 to 2.0000e+006 2.0000e+006 to 3.0000e+006 Magfac = 1.000e+000
Co
A Eff
Pl M
(a) Horizontal stress
–1.3193e+007 to –1.2000e+007 –1.2000e+007 to –1.0000e+007 –1.0000e+007 to –8.0000e+006 –8.0000e+006 to –6.0000e+006 –6.0000e+006 to –4.0000e+006 –4.0000e+006 to –2.0000e+006 –2.0000e+006 to 0.0000e+000 0.0000e+000 to 5.4734e+004
Contour of SZZ
Average calculation Effective stresses
Plane: on
Magfac = 1.000e+000
(b) Vertical stress
It can be seen from Figure 21 that the stress change of the shaft surrounding rock has a nonlinear relationship with the depth, showing a wave-type state. The maximum tensile stress of the horizontal stress is 1.43 MPa, and the maximum compressive stress is 4.17 MPa. The stress of the surrounding rock after the grouting is less than the stress without grouting.
Figure 22 shows that after the water outlet point is grouted, the horizontal displacement of the shaft surround-ing rock has a nonlinear relationship with the depth. The maximum horizontal displacement is 16.94 mm, and the maximum vertical displacement is 50.21 mm. Comparing Figures 15(b) and 16(b, it can be seen that the displacement of the shaft surrounding rock is smaller than the displace-ment without grouting.
6.4. Grouting Effect Analysis.When plugging the water outlet point of the topsoil, it is difficult to grout due to the annular cracks in the shaft surrounding rock. During the grouting process, a new water outlet point appears. At the same time, there is a cross-grout phenomenon within the water outlet area, and the smaller the water inflow, the more difficult to plug the water outlet point. Because of the above problems, it is necessary to increase the pump pressure and grouting volume to increase the spreading radius of the slurry, to reduce the new water outlet point. When plugging the water outlet point, the water plugging speed is slow, and it takes 10~30 minutes. The Malisan N grouting material is used to plug thefive water outlet points in a short period; the shaft grouting takes 56 hours in total and consumes 3.20 t of Mal-isan N raw material. After grouting, the measured water
7
6
5
5 10 15 20
Detection time (m)
Shaft
wa
ter
inflo
w (m
3/h)
25 30 35 40 45
4
3
2
1
0
Figure23: The measured water volume changes in the shaft.
Plane: on
Contour of X-Displacement
Magfac = 1.000e+000
–1.6940e–002 to –1.5000e–002 –1.5000e–002 to –1.0000e–002 –1.0000e–002 to –5.0000e–003
1.0000e–002 to 1.5000e–002 1.5000e–002 to 1.6946e–002 –5.0000e–003 to 0.0000e–000
5.0000e–003 to 1.0000e–002 0.0000e+000 to 5.0000e–003
(a) Horizontal displacement
Contour of Z-Displacement
Plane: on
Magfac = 1.000e+000
–5.0208e–002 to –5.0000e–002 –5.0000e–002 to –4.5000e–002 –4.5000e–002 to –4.0000e–002 –4.0000e–002 to –3.5000e–002 –3.5000e–002 to –3.0000e–002 –3.0000e–002 to –2.5000e–002 –2.5000e–002 to –2.0000e–002 –2.0000e–002 to –1.5000e–002 –1.5000e–002 to –1.0000e–002 –1.0000e–002 to –5.0000e–003 –5.0000e–003 to 0.0000e+000
(b) Vertical displacement
inflow is less than 0.05 m3/h, and the shaft water inflow has not changed; the measured water volume changes in the shaft as shown in Figure 23.
7. Conclusion
(1) Through field data monitoring, the flow direction and velocity of the Quaternary water were 150° (ES60°) and 0.73 m/h, respectively. At the same time, the characteristics of the rock mass around the main (auxiliary) shaft, the aquifer parameters (position, depth, thickness, and water inflow), and the hydrau-lic connection between the layers are obtained throughflow monitoring
(2) Through the numerical simulation analysis of the groundwater seepagefield, the change law of the shaft surrounding rock under the action of water bodies and the change rule of the groundwater seepagefield around the shaft were obtained; the water outlet point was determined; and the grouting drilling parameters were optimized. Combined with experi-mental research, a grouting material based on Mali-san N was selected and designed, and a self-locking oil seal technology was developed to improve the grouting efficiency
(3) The grouting behind the shaft linings was adopted to plug the water, which can effectively plug the water outlet point and reinforce the surrounding rock. The monitoring data show that there was no water spray in summer, the water inflow in winter has dropped to 0.05 m3/h, and there is no change for a long time
Data Availability
The data used to support the findings of this study are included within the article.
Conflicts of Interest
The authors declare no conflicts of interest.
Acknowledgments
This study was funded by the National Natural Science Foun-dation of China (No. 51704152) and the Natural Science Foundation of Shandong Province (No. ZR2017PEE018, No. ZR2019BEE013, and No. ZR2017BEE001).
References
[1] G. Q. Zhou, H. C. Liang, and G. S. Zhao,“Test of grouting
sur-rounding pile for improving bearing capacity,” Journal of
China University of Mining & Technology, vol. 34, no. 3, pp. 265–269, 2005.
[2] Q. Yu, J. Ma, H. Shimada, and T. Sasaoka,“Influence of coal
extraction operation on shaft lining stability in eastern Chinese
coal mines,”Geotechnical and Geological Engineering, vol. 32,
no. 4, pp. 821–827, 2014.
[3] A. Mitelman, D. Elmo, and D. Stead,“Development of a spring
analogue approach for the study of pillars and shafts,” Interna-tional Journal of Mining Science and Technology, vol. 28, no. 2, pp. 267–274, 2018.
[4] X.-b. Li, W. Zhang, D.-y. Li, and Q.-s. Wang,“Influence of
underground water seepageflow on surrounding rock
defor-mation of multi-arch tunnel,”Journal of Central South
Univer-sity of Technology, vol. 15, no. 1, pp. 69–74, 2008.
[5] P. Roghanchi and K. C. Kocsis, “Quantifying the thermal
damping effect in underground vertical shafts using the
non-linear autoregressive with external input (NARX) algorithm,”
International Journal of Mining Science and Technology, vol. 29, no. 2, pp. 255–262, 2019.
[6] Y. D. Jia, R. Stace, and A. Williams,“Numerical modelling of
shaft lining stability at deep mine,” Mining Technology,
vol. 122, no. 1, pp. 8–19, 2013.
[7] C. C. Li,“Disturbance of mining operations to a deep
under-ground workshop,”Tunneling & Underground Space
Technol-ogy, vol. 21, no. 1, pp. 1–8, 2006.
[8] A. Jaiswal and B. K. Shrivastva,“Stability analysis of the
pro-posed hybrid method of partial extraction for underground
coal mining,” International Journal of Rock Mechanics and
Mining Sciences, vol. 52, pp. 103–111, 2012.
[9] Y.-Y. Yang, Y.-S. Xu, S.-L. Shen, Y. Yuan, and Z.-Y. Yin,“
Min-ing-induced geo-hazards with environmental protection
mea-sures in Yunnan, China: an overview,”Bulletin of Engineering
Geology & the Environment, vol. 74, no. 1, pp. 141–150, 2015.
[10] L. Tong, L. Leo, B. Amatya, and S. Liu,“Risk assessment and
remediation strategies for highway construction in abandoned
coal mine region: lessons learned from Xuzhou, China,”
Bulle-tin of Engineering Geology & the Environment, vol. 75, no. 3,
pp. 1045–1066, 2016.
[11] J. Konior,“Development of load exerted on the lining of the
shaft after its liquidation / Kształtowanie Się Obciążeń
Obudowy Szybu Po Jego Likwidacji,”Archives of Mining
Sci-ences, vol. 60, no. 1, pp. 253–263, 2015.
[12] F. S. Ma, Q. H. Deng, D. Cunningham, R. M. Yuan, and H. J.
Zhao, “Vertical shaft collapse at the Jinchuan Nickel Mine,
Gansu Province, China: analysis of contributing factors and
causal mechanisms,” Environmental Earth Sciences, vol. 69,
no. 1, pp. 21–28, 2013.
[13] Y. Hang, G.-l. Zhang, and G.-y. Yang,“Numerical simulation
of dewatering thick unconsolidated aquifers for safety of
underground coal mining,” Mining Science and Technology,
vol. 19, no. 3, pp. 312–316, 2009.
[14] Y.-c. Xu, X.-d. Li, and Y.-x. Jie,“Test on water-level stabiliza-tion and prevenstabiliza-tion of mine-shaft failure by means of ground-water injection,”Geotechnical Testing Journal, vol. 37, no. 2,
pp. 20130027–20130332, 2014.
[15] Y. Xu, J. Li, Q. Zhang, and X. Wang,“Engineering parameters
of water injection to control mine shaft damage at Jisan coal
mine,”Journal of Liaoning Technical University (Natural
Sci-ence), vol. 33, no. 9, pp. 1153–1158, 2014.
[16] D. Lin and X. Wu,“Study on water blocking and reinforcing by
grouting and anchoring method in a shaft about one kilome-ter,” Chinese Journal of Rock Mechanics and Engineering, vol. 23, no. s1, pp. 4666–4668, 2004.
[17] G. Q. Zhou, Y. Z. Liu, X. W. Feng, and G. S. Zhao,“Application
and effect of grouting in surrounding soil on releasing and
restraining additional stress of shaft lining,”Chinese Journal of Geotechnical Engineering, vol. 27, no. 7, pp. 3274–3280, 2004.
[18] A. Aalianvari, “Optimum depth of grout curtain around
pumped storage power cavern based on geological conditions,”
Bulletin of Engineering Geology and the Environment, vol. 73, no. 3, pp. 775–780, 2014.
[19] Y. S. Wang, Z. J. Yang, and W. H. Yang,“Viscoelastic analysis
of interaction between freezing wall and outer shaft wall in
freeze sinking,”Procedia Earth and Planetary Science, vol. 1,
no. 1, pp. 612–620, 2009.
[20] G. Walton and M. S. Diederichs,“A mine shaft case study on
the accurate prediction of yield and displacements in stressed
ground using lab-derived material properties,”Tunneling &
Underground Space Technology, vol. 49, pp. 98–113, 2015.
[21] H. Ozturk and E. Guler,“A methodology for lining design of
circular mine shafts in different rock masses,” International
Journal of Mining Science and Technology, vol. 26, no. 5, pp. 761–768, 2016.
[22] H. C. Liang, G. Q. Zhou, and Z. Q. Liu,“In-situ tests on ground
surface settlement and additional strain of shaft linings,” Chi-nese Journal of Geotechnical Engineering, vol. 32, no. 6, pp. 925–928, 2010.
[23] J. H. Huang and W. H. Yang,“Study on variation of vertical
additional force on shaft lining by simulation tests,”Chinese
Journal of Geotechnical Engineering, vol. 28, no. 10,
pp. 1205–1207, 2006.
[24] H. Cheng, J. Su, and Z. S. Yao,“Study on distributing rule of
additional force of compressible shaft wall in hydrophobic
set-tlement stratum,” Rock and Soil Mechanics, vol. 28, no. 3,
pp. 471–475, 2007.
[25] Y. Wang, C. Zhang, L. Xue, and X. Huang,“Prediction and
safety analysis of additional vertical stress within a shaft wall
in an extra-thick alluvium,” Mining Science and Technology,
vol. 20, no. 3, pp. 350–356, 2010.
[26] Z. Q. Meng, H. G. Ji, and F. Peng,“Additional stress of shafting linings in thick alluvium constructed by freeing process,” Jour-nal of China Coal Society, vol. 38, no. 2, pp. 205–208, 2013.
[27] H. C. Xia and M. A. Tang, “Mechanism and application of
grouting into topsoil to prevent shaft lining from fracturing,”
Journal of Mining and Safety Engineering, vol. 26, no. 4, pp. 407–412, 2009.
[28] R. Yang, Q. Wang, and L. Yang,“Closed-form elastic solution
for irregular frozen wall of inclined shaft considering the
inter-action with ground,”International Journal of Rock Mechanics