Gaining detailed information about the traffic on your network and the behavior of your subscribers is crucial to achieving success in the highly competitive service provider market. The latest breed of IP service optimization systems allows you to obtain the information about network application behavior that you need to control overall network performance and to ensure IP fairness among individual subscribers. To implement the proper network management policies at the subscriber and
application levels, you must first determine what kind of traffic is currently on the network and how it is performing. In other words, the initial phase of implementing effective IP service optimization is establishing a baseline.
Establishing your baseline involves gathering usage statistics, generated by the service optimization system in the form of graphical reports, and analyzing them from several perspectives. You may be surprised to find out what traffic shows up on your network! This baseline information will allow you to design a plan to optimize the operation of your network.
Today’s Baseline Is Tomorrow’s Key
Optimizing network use is key to most service providers’ transition to delivering IP “triple play” voice, data, and video services, a move intended to increase revenue. Triple-play deployment, however, involves considerable capital expenditure (capex) in the form of additional network equipment and capacity needed to support rich
shown that in 2005, on average, 40 percent of capital expenditures by North American, European, and Asia-Pacific service providers went toward triple-play network equipment.
Using intelligent IP service optimization is the smart way to avoid making unnecessary capex investments and also helps defray significant additional operational expenditures (opex) in troubleshooting and network management. The baseline information you need is whether there is congestion is on your network, at which times it occurs, and its cause. Generally, gathering usage statistics for one to two weeks gives you enough information to accurately analyze network activity. You may also consider monitoring the network through one complete billing cycle to study the needs of your subscribers. What you discover could assist you in designing new service packages.
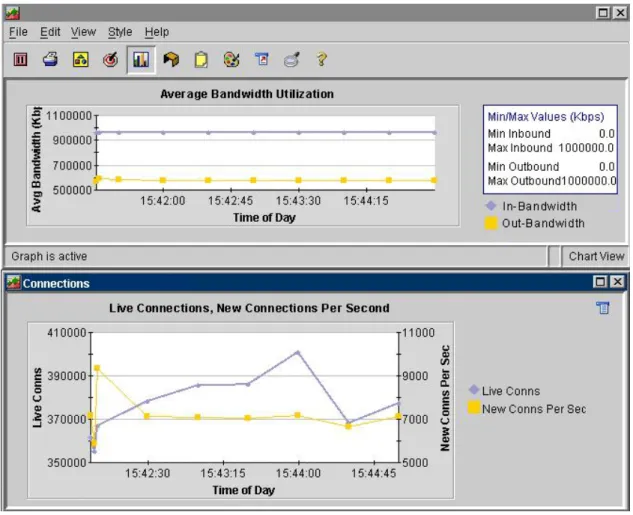
The monitor’s graphical reports show when the network is used (see Figure 1), by whom, and by what applications and protocols. This information helps you determine how to manage network traffic effectively, thereby improving your average revenue per user (ARPU), the quality of your service delivery, and your long-range capital investment planning.
Figure 1. Analyzing Traffic Patterns
Basic monitoring reveals time-of-day traffic patterns and what volumes of traffic fall in and out of subscribers’ profiles.
__________________________________________________________________ Visibility and Correlation
Legacy monitors have been around for a while. These devices monitor Layer 2–3
activity. They generate reports about performance levels of individual permanent virtual circuits (PVCs), measure whether or not traffic levels fall within a committed information rate (CIR) and, generally, determine whether basic customer
service-met. These monitors can also identify top talkers—the PCs, users, and servers generating the highest traffic volumes—based on IP or MAC addresses.
Today, more advanced monitoring products add visibility into Layers 4–7 through a
capability called deep packet inspection (DPI). DPI allows the systems to identify applications not only by port number but also, more granularly, by application-specific information deep inside the packet header. This application-recognition capability enables monitors to calculate response times and traffic loads on a per-application basis, while correlating this information per subscriber across all traffic classes. Armed with this “network intelligence,” service providers can understand how to tune the network and its policies on a per-subscriber, per-application basis for continued optimal performance.
Today’s DPI-enabled Layer 7 network monitors support deep analysis of static and dynamic protocols, application signatures, content patterns, and session behavior, such as number of connections per second (Figure 1). This visibility is the key to controlling and optimizing IP service delivery for both best-effort and new, premium services.
DPI is especially useful for providers of triple-play voice, data, and video services, because DPI accurately identifies even those application types that use dynamic port numbers, such as voice over IP (VoIP), net conferencing, and peer-to-peer (P2P) applications. It also specifically differentiates between various Web applications that use HTTP’s open port 80 and identifies suspicious code that tries to “sneak” onto the network via port 80.
The reports generated by DPI-capable monitors help service providers gain a competitive advantage by enabling them to do the following:
• Fine-tune policies for specific subscriber segments
• Manage bandwidth for optimizing delivery of premium services • Ensure that customers actually receive the service levels for which
they are paying
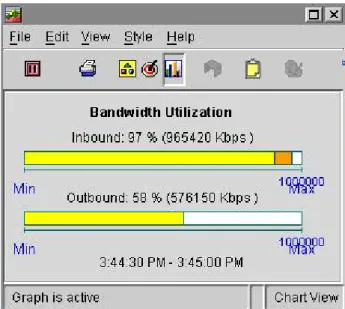
Figure 2 shows how much of the network is being used at a particular point in time. __________________________________________________________________ Figure 2. Utilization of the Network
This operator’s network is reaching its capacity limit in the inbound direction. The orange band warns that the link has surpassed a given
threshold of utilization (in this case, more than 90 percent). By also viewing information shown in Figure 3, a service provider can determine how best to rate-limit or otherwise control high-usage traffic flows to relieve the
inbound congestion.
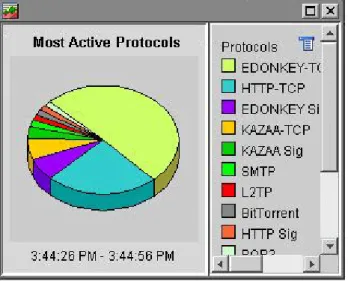
___________________________________________________________________ Figure 3 shows the most active protocols on the network. The graphic report
indicates specifically that TCP-based eDonkey (a P2P file-sharing application) is consuming one-half of the bandwidth and is causing congestion on the network. Knowing this, the service provider might decide to rate-limit the amount of bandwidth eDonkey can consume or, conversely, measure it on a per-subscriber basis and charge a premium for it.
________________________________________________________________________
Figure 3. Most Active Protocols
TCP-based eDonkey music and video sharing is consuming the most bandwidth (the purple wedge refers to UDP-based eDonkey application traffic). By creating policies for controlling this application, service
providers can alleviate bandwidth congestion and avoid additional network capacity investments.
________________________________________________________________________
Establishing and Tuning Network Policy
Establishing a baseline of your network activity is the key to understanding how to optimize the way your existing network resources are used. Your baseline data will tell you:
• The composition of your network traffic at all OSI layers
• Which applications are hogging bandwidth and which are
bandwidth-constrained
• Where the main sources of congestion originate (i.e., identifying subscribers generating large traffic volumes)
• Which SLAs are being violated
• Which network usage policies are being overridden or abused
• Where P2P is degrading the network
• What areas require the setting of new policies or limits
You can fine-tune your network by using the results of baseline monitoring to determine and improve upon network policy. This involves first grouping all your traffic into classes based on what network policies should apply to them. Classes can be created on the basis of application, subscriber base, subscriber IP address,
category of service, or a combination of these variables. Classification helps you to generally meet the demands of individual subscribers and subscriber groups. Chapter Summary
Controlling today’s converged networks depends on understanding what users, protocols, and applications are on the network and how they are behaving.
Establishing a baseline using a Layer 7, DPI-capable network monitor enables you to discover what’s actually on your network, traffic patterns, and overall network behavior—the first step in controlling traffic and usage down to the subscriber level. Managing both aggregate and per-subscriber traffic behavior allows you to deploy new premium services and to enforce IP fairness among subscribers, all important capabilities for ARPU improvement.